MEMBERS ONLY
Apollo Bucks the Market with Bearish Engulfing
by Arthur Hill,
Chief Technical Strategist, TrendInvestorPro.com
Apollo (APOL) opened strong and moved lower to trace out a bearish engulfing during the day on Tuesday. It is interesting that APOL is not moving higher with the market and that this bearish candlestick pattern formed at resistance. Follow through below Tuesday's low would confirm the pattern....
READ MORE
MEMBERS ONLY
SPY Forms Lower High as GLD Surges
by Arthur Hill,
Chief Technical Strategist, TrendInvestorPro.com
It is a short, but packed week for the market with several key economic reports on deck. We have ISM Manufacturing and FOMC minutes on Tuesday, Factory Orders and Auto/Truck Sales on Wednesday, ISM Services and Jobless Claims on Thursday, and the big Employment Report on Friday. The first...
READ MORE
MEMBERS ONLY
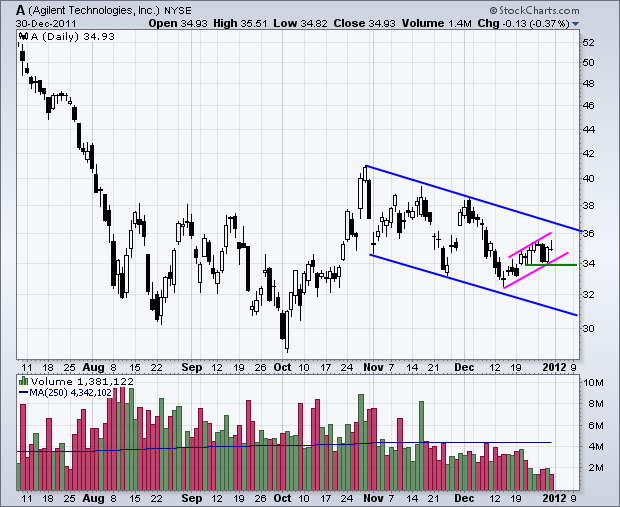
Charts of Interest: A, ALTR, ARO, CAT, ESRX, MGM, SLB, STX
by Arthur Hill,
Chief Technical Strategist, TrendInvestorPro.com
ARO Forms Pennant after Sharp Decline.
SLB Firms at Support Zone.
STX Challenges Wedge Trendline.
Plus A, ALTR, CAT, ESRX, MGM
This commentary and charts-of-interest are designed to stimulate thinking. This analysis is not a recommendation to buy, sell, hold or sell short any security (stock ETF or...
READ MORE
MEMBERS ONLY
Dow Transports Challenges Resistance
by Arthur Hill,
Chief Technical Strategist, TrendInvestorPro.com
With a surge in late December, the Dow Transports is once again challenging resistance from the October highs. Notice that the Average failed at this level in early December. The Dow Industrials is also hitting resistance near the October high. Breakouts in both would be bullish according to Dow Theory....
READ MORE
MEMBERS ONLY
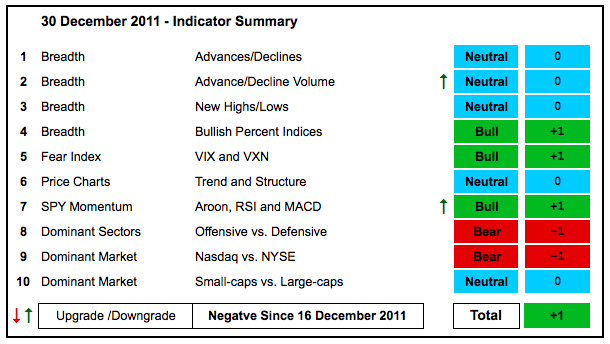
Divided Market Keeps Indicator Summary in Check
by Arthur Hill,
Chief Technical Strategist, TrendInvestorPro.com
With a couple of upgrades, the indicator summary moved from -2 to +1 this week. The total has been waffling around the zero level for a few weeks now, which reflects a divided the market. The average Nasdaq stock is relatively weak, but the average NYSE stock is relatively strong....
READ MORE
MEMBERS ONLY
SPY Maintains Short-Term Uptrend as UUP Breaks Out
by Arthur Hill,
Chief Technical Strategist, TrendInvestorPro.com
Stocks continued their short-term uptrends with further strength on Tuesday and then fell sharply on Wednesday. This decline was not enough to reverse the short-term uptrend. With a modest bounce on Thursday, the major index ETFs established short-term support levels to watch going forward. On the S&...
READ MORE
MEMBERS ONLY
Energy SPDR Forms Large Triangle Consolidation
by Arthur Hill,
Chief Technical Strategist, TrendInvestorPro.com
After surging in October, the Energy SPDR (XLE) moved into a sideways pattern with a lower high and a higher low. In short, the noose is tightening as a triangle consolidation takes shape. Watch resistance from the early December high and support from the mid December low for the next...
READ MORE
MEMBERS ONLY
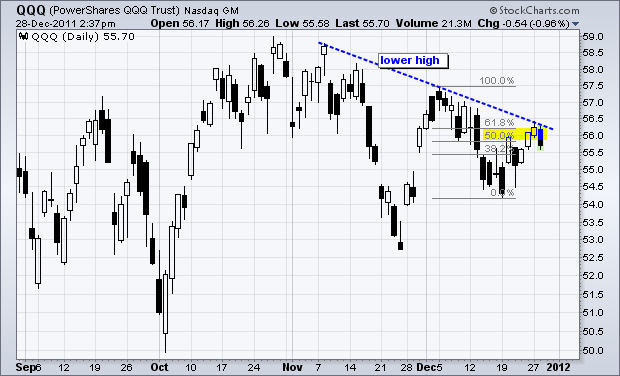
QQQ Turns Back At November Trendline
by Arthur Hill,
Chief Technical Strategist, TrendInvestorPro.com
The Nasdaq 100 ETF (QQQ) is hitting resistance from the November trendline and a key retracement. Notice that the ETF turned back at the 62% retracement with Wednesday's decline. A lower high could be taking shape as buying pressure dries up below the early December high.
Click this...
READ MORE
MEMBERS ONLY
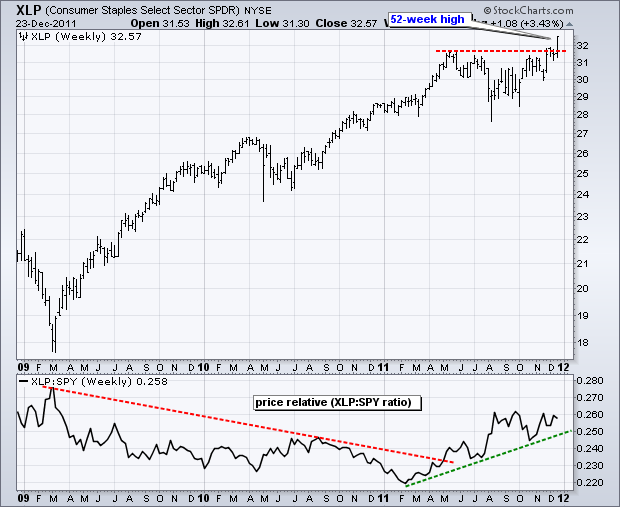
Consumer Staples SPDR Continues to Lead with 52-week High $XLP
by Arthur Hill,
Chief Technical Strategist, TrendInvestorPro.com
Of the nine sector SPDRs, only two hit new 52-week highs last week: the Consumer Staples SPDR (XLP) and the Utilities SPDR (XLU). These two defensive sectors are clearly leading the market right now. The chart below shows XLP breaking its May highs and the Price Relative moving higher...
READ MORE
MEMBERS ONLY
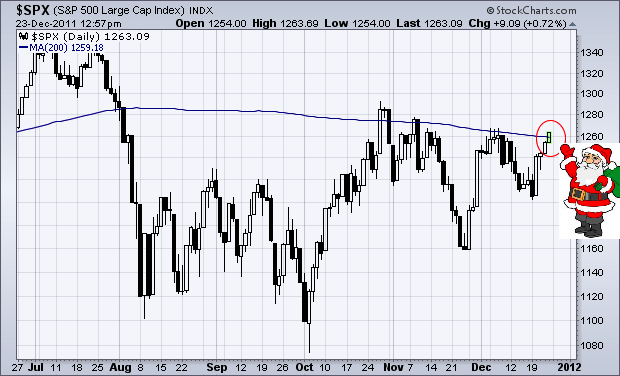
Santa Delivers the 200-day for the S&P 500
by Arthur Hill,
Chief Technical Strategist, TrendInvestorPro.com
The Santa Clause rally continued into Friday with the S&P 500 clearing its 200-day moving average in the early afternoon. Prior attempts in early December failed as the index fell back before the close. Let's see if Santa can make good on this one. Merry...
READ MORE
MEMBERS ONLY
Market Remains Mixed as Nasdaq Shows Relative Weakness
by Arthur Hill,
Chief Technical Strategist, TrendInvestorPro.com
Even though the indicator summary remains unchanged this week, there was some strengthening under the hood this week. Notably the NYSE Net New Highs Line continues to rise and shows no signs of weakness. The AD Volume Lines bounced this week and are on the verge of trend changing breakouts....
READ MORE
MEMBERS ONLY
SPY holds Breakout as Euro Bounce Helps Gold
by Arthur Hill,
Chief Technical Strategist, TrendInvestorPro.com
First, note that Art's Charts will not be published next Monday through Thursday. It is a fine time for family and Christmas. Commentary will resume on Friday, December 30th. Merry Christmas and Happy Holidays from all of us at Stockcharts.com. Now to the charts! The good ole...
READ MORE
MEMBERS ONLY
DIA Forms Inverse Head-and-Shoulders Pattern
by Arthur Hill,
Chief Technical Strategist, TrendInvestorPro.com
The Dow Industrials SPDR (DIA) is challenging resistance from an inverse Head-and-Shoulders pattern. After surging in October, the ETF consolidated for two months to set up the pattern. The late November low formed the head and neckline resistance is set just above 122. Before getting too bullish, note...
READ MORE
MEMBERS ONLY
SPY Holds the Breakout and QQQ Tests Support
by Arthur Hill,
Chief Technical Strategist, TrendInvestorPro.com
An earnings miss from Oracle hit the Nasdaq 100 ETF (QQQ) hard, but the broader market held up pretty well as the S&P 500 ETF (SPY) finished the day with a slight gain. On the 60-minute chart, SPY broke resistance with Tuesday's surge and broken...
READ MORE
MEMBERS ONLY
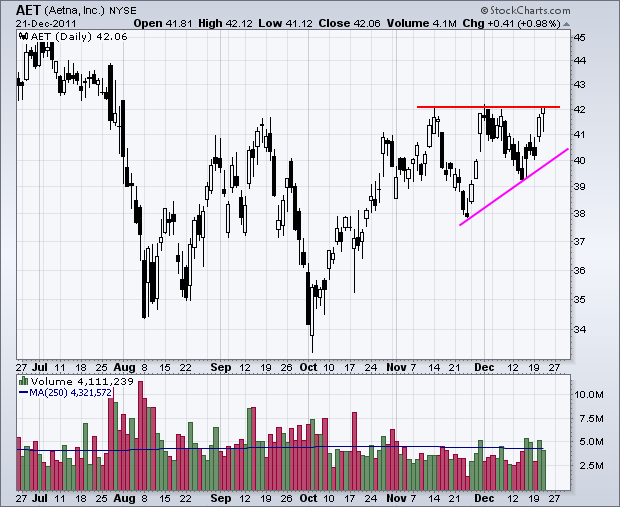
Charts of Interest: AET, ATVI, HST, MET, NYB, PBCT, PGR, T
by Arthur Hill,
Chief Technical Strategist, TrendInvestorPro.com
ATVI Forms Harami at Support.
NYB Edges High on Expanding Volume.
T Breaks Flag Resistance after Failed Deal.
Plus AET, HST, MET, PBCT and PGR.
This commentary and charts-of-interest are designed to stimulate thinking. This analysis is not a recommendation to buy, sell, hold or sell short any...
READ MORE
MEMBERS ONLY
Two Bearish Patterns Take Shape in Akamai
by Arthur Hill,
Chief Technical Strategist, TrendInvestorPro.com
There are two bearish patterns at work with Akamai (AKAM). First, a lower high formed in early December and a descending triangle is taking shape. A move below 26 would confirm this pattern. Second, a bear flag formed the prior five days and the stock is on the verge of...
READ MORE
MEMBERS ONLY
SPY Breaks Channel Resistance as TLT Plunges
by Arthur Hill,
Chief Technical Strategist, TrendInvestorPro.com
The European Central Bank (ECB) is opening the monetary floodgates today. While they may not call it quantitative easing (QE) by name, the ECB is essentially giving money to European banks so they can stimulate the economy with increased lending. Seems I've heard this one before. The US...
READ MORE
MEMBERS ONLY
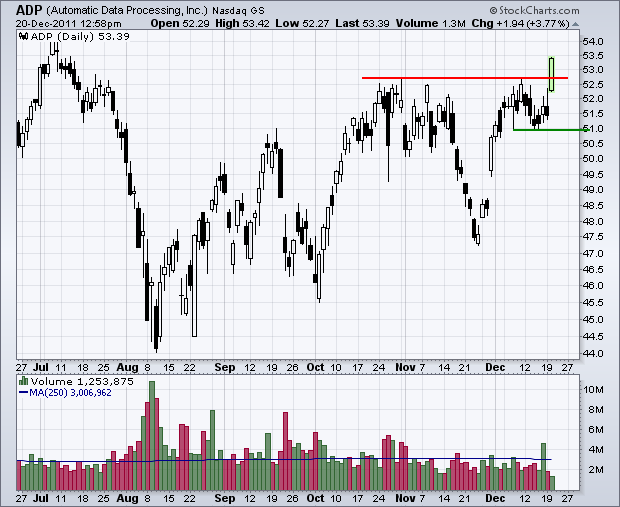
ADP Breaks Resistance with big Surge
by Arthur Hill,
Chief Technical Strategist, TrendInvestorPro.com
Automatic Data Processing (ADP) may have an antiquated name, but the stock has outperformed Apple (AAPL) since mid September. On the chart below, ADP broke resistance from the October-November highs with a big move. Even though volume is light, the breakout is bullish as long as it holds.
Click...
READ MORE
MEMBERS ONLY
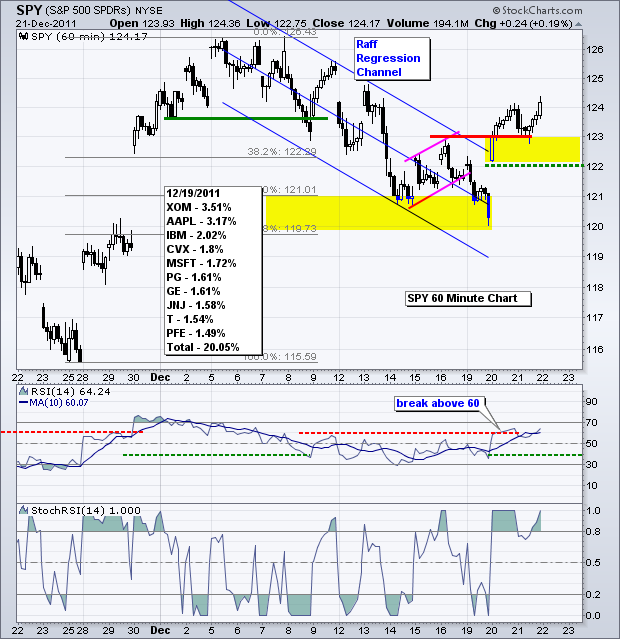
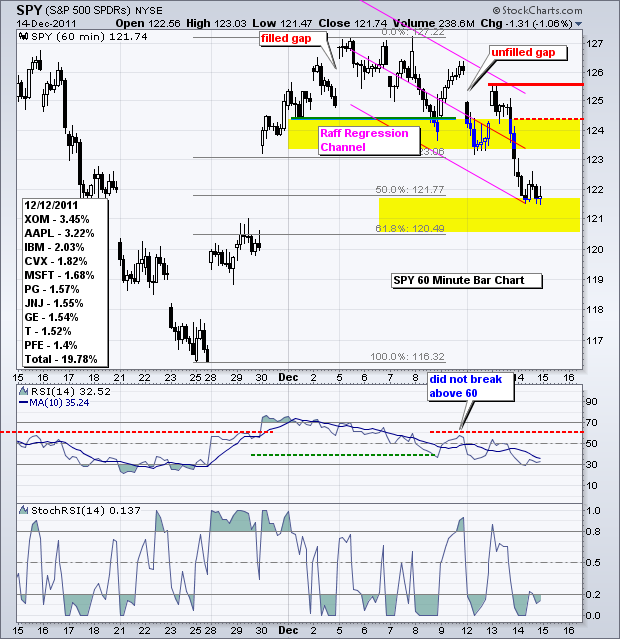
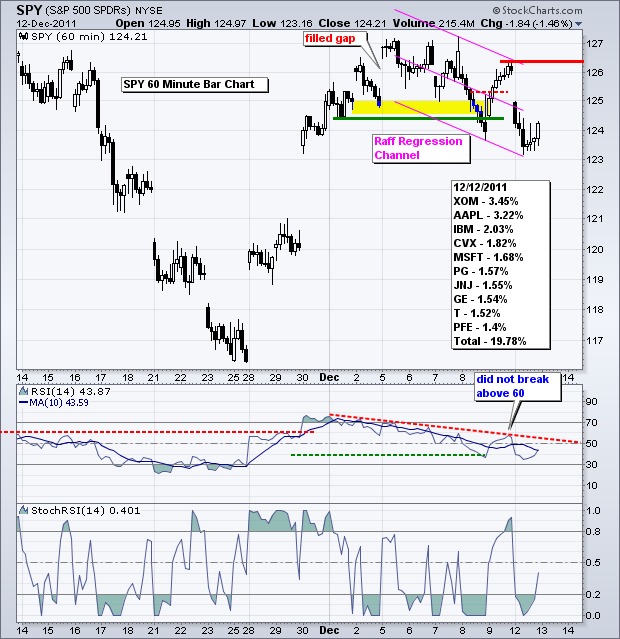
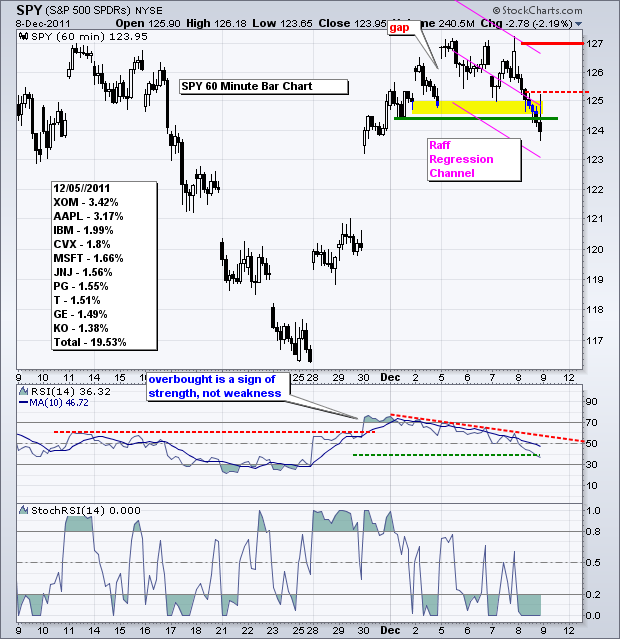
GLD Holds it Bounce as TLT Becomes Way Overbought
by Arthur Hill,
Chief Technical Strategist, TrendInvestorPro.com
Now that everyone has officially given up on the Santa Claus rally and stocks are oversold, perhaps we will get that rally. The S&P 500 ETF (SPY) remains in a falling price channel that is defined by the Raff Regression Channel. Key resistance is set at 123. Within...
READ MORE
MEMBERS ONLY
Charts of Interest: AMZN, AN, APOL, CCL, D, DE, FISV, MXIM
by Arthur Hill,
Chief Technical Strategist, TrendInvestorPro.com
AMZN Forms Big Hammer at Support.
CCL Traces out Big Bearish Engulfing.
DE Declines Six Days Straight.
Plus $AN, $APOL, D, DE, FSIV, MXIM
This commentary and charts-of-interest are designed to stimulate thinking. This analysis is not a recommendation to buy, sell, hold or sell short any security...
READ MORE
MEMBERS ONLY
A Triple Bottom Breakdown for QQQ on 30min PnF Chart
by Arthur Hill,
Chief Technical Strategist, TrendInvestorPro.com
The Nasdaq 100 ETF (QQQ) broke below the prior two O-Columns to forge a triple bottom breakdown on the 30min PnF chart. This bearish signal suggests that the ETF is going lower with a downside price objective around 52.90. This can be see at the top of the...
READ MORE
MEMBERS ONLY
No commentary - Charts Updated - Back Tuesday
by Arthur Hill,
Chief Technical Strategist, TrendInvestorPro.com
I am taking a day off of the commentary today, but the charts have been updated and posted below. Art's Charts will return in full on Tuesday.
Key Economic Reports:
Mon - Dec 19 - 10:00 - NAHB Housing Market Index
Tue - Dec 20 - 08:30 - Housing Starts/Building Permits...
READ MORE
MEMBERS ONLY
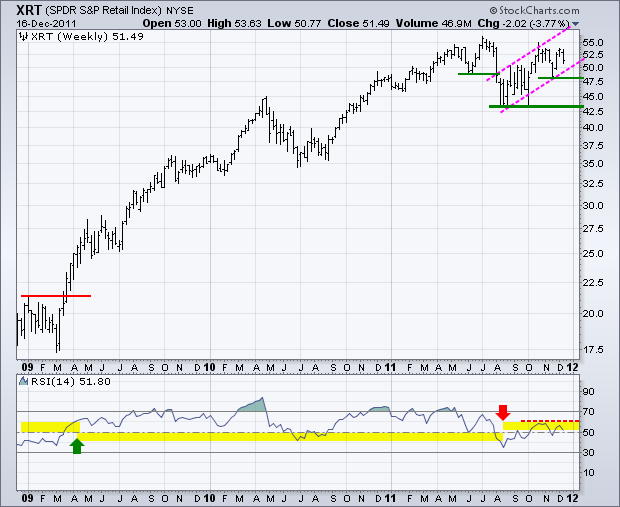
RETAIL SPDR COULD HOLD THE KEY IN 2012
by Arthur Hill,
Chief Technical Strategist, TrendInvestorPro.com
The Retail SPDR (XRT) remains one of the strongest ETFs in the market. As a core part of the consumer discretionary sector, retail is one of the most important industry groups and Christmas is perhaps the most important season. A lot is riding on the consumer this holiday season. The...
READ MORE
MEMBERS ONLY
NYSE McClellan Summation Index Turns Down
by Arthur Hill,
Chief Technical Strategist, TrendInvestorPro.com
With a downturn in the stock market this week, the NYSE Summation Index ($NYSI) turned back down and broke below its 5-day EMA. This shows that breadth is deteriorating once again. The McClellan Oscillator also turned negative. Note that the Summation Index is a cumulative measure of the McClellan...
READ MORE
MEMBERS ONLY
AD Volume Lines Weigh on Indicator Summary
by Arthur Hill,
Chief Technical Strategist, TrendInvestorPro.com
The market is about as mixed up as it can be right now. With a few downgrades this week, the indicator summary flipped back to negative territory (-2). There are still a few neutral readings out there that could go either way with a significant move. The AD Volume Lines...
READ MORE
MEMBERS ONLY
Stocks, Gold and the Euro Firm after Becoming Oversold
by Arthur Hill,
Chief Technical Strategist, TrendInvestorPro.com
Stocks got a bounce as the Euro finally firmed for a day. The seasonal patterns for the stock market are still bullish this time of year. These include yearend window dressing, the Santa Claus rally, historic returns in December, the January effect and the six-month cycle. It is also...
READ MORE
MEMBERS ONLY
Oil Plunges as Risk-off Trade Remains in Force
by Arthur Hill,
Chief Technical Strategist, TrendInvestorPro.com
The risk-off trade remained in force on Wednesday with oil joining the sell-off in stocks, the Euro and gold. US Treasuries and the Dollar benefitted from a flight to safety. Concerns over Europe continue to dominate the headlines as Italian 10-year yields moved to 6.69%. Italy...
READ MORE
MEMBERS ONLY
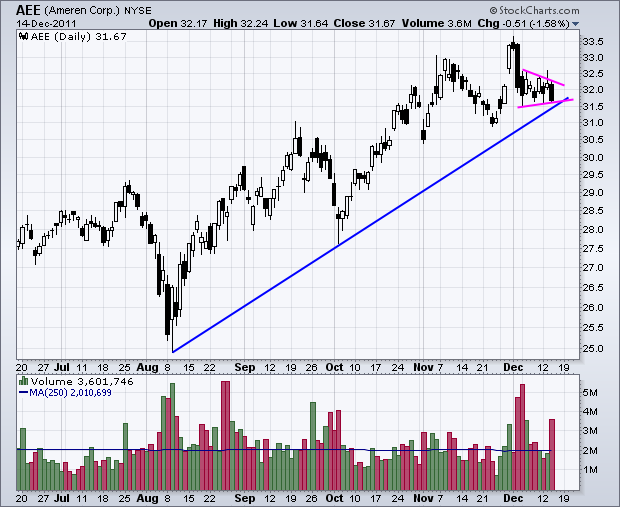
Charts of Interest: AEE, AMGN, CPN, CVX, GE, GGP
by Arthur Hill,
Chief Technical Strategist, TrendInvestorPro.com
AEE Forms Pennant after Sharp Decline.
CVX Breaks Support on High Volume.
GGP Stalls with Bull Flag.
Plus AMGN, CPN, GE
This commentary and charts-of-interest are designed to stimulate thinking. This analysis is not a recommendation to buy, sell, hold or sell short any security (stock ETF or...
READ MORE
MEMBERS ONLY
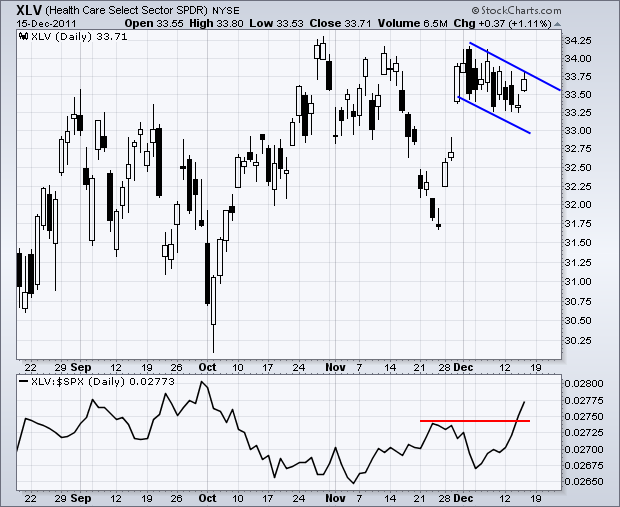
Healthcare SPDR Forms Bull Flag
by Arthur Hill,
Chief Technical Strategist, TrendInvestorPro.com
After a big surge in late November, the Healthcare SPDR (XLV) pulled back with the rest of the market and formed a falling flag the last few weeks. This is a bullish continuation pattern and a break above 34 would reverse the three week slide. Notice that XLV continues to...
READ MORE
MEMBERS ONLY
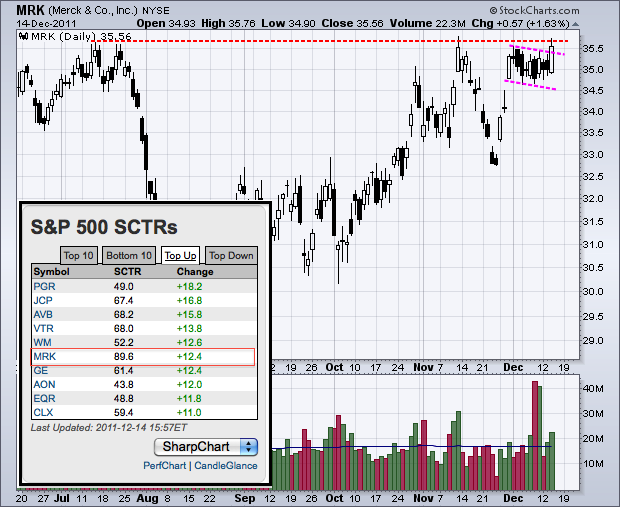
StockCharts Technical Rank Surges as Merck Breaks Flag Resistance
by Arthur Hill,
Chief Technical Strategist, TrendInvestorPro.com
Top ten lists for the StockCharts Technical Rank (SCTR) can now be found on the home page (scroll down). Merck (MRK) stands out from the list of stocks with the biggest SCTR change. The SCTR jumped 12.4 as the stock broke flag resistance and challenged its 2011 highs.
Click...
READ MORE
MEMBERS ONLY
SPY Remains within Falling Channel as UUP Surges
by Arthur Hill,
Chief Technical Strategist, TrendInvestorPro.com
The risk-off trade took hold in the markets with stocks and the Euro falling. Bonds and the Dollar surged, but oil bucked the trend with a big gain. I am not sure how long oil can hold up in the face of a strong Dollar and weak stock market....
READ MORE
MEMBERS ONLY
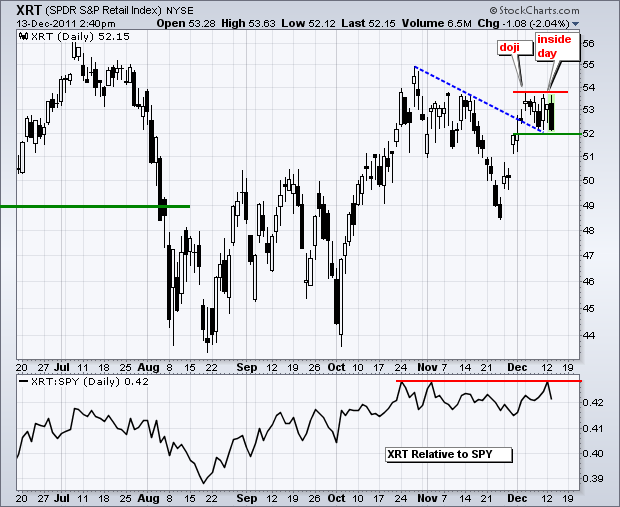
Retailer SPDR Tests Breakout and Near Term Support
by Arthur Hill,
Chief Technical Strategist, TrendInvestorPro.com
The Retail SPDR (XRT) is under pressure today after a miss from Best Buy (BBY) and a lackluster Retail Sales report. XRT broke trendline resistance in early December and then consolidated. This breakout is holding, but barely. Consolidation support is set at 52 and a break below this level would...
READ MORE
MEMBERS ONLY
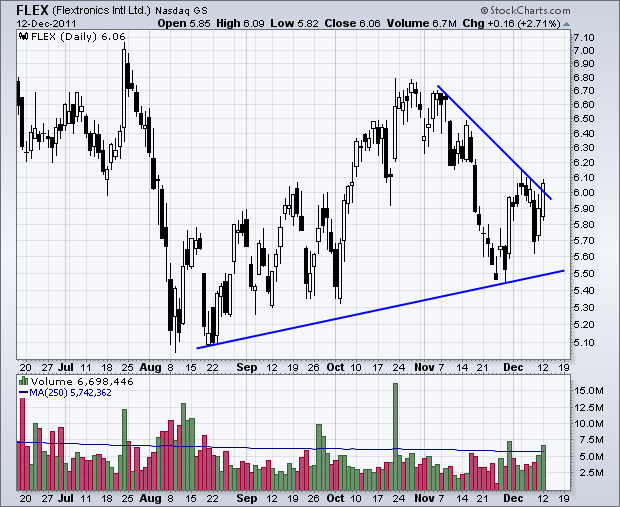
Charts of Interest: FLEX, MMM, TEVA, THO, TTWO, URBN
by Arthur Hill,
Chief Technical Strategist, TrendInvestorPro.com
FLEX Flexes its Muscles.
MMM Hits Big Resistance Zone.
TEVA Forms Bullish Pennant.
Plus THO, TTWO, URBN
This commentary and charts-of-interest are designed to stimulate thinking. This analysis is not a recommendation to buy, sell, hold or sell short any security (stock ETF or otherwise). We all need...
READ MORE
MEMBERS ONLY
SPY, GLD and USO Plunge as TLT and UUP Surge
by Arthur Hill,
Chief Technical Strategist, TrendInvestorPro.com
Even though the seasonal patterns are bullish, stocks remain under pressure and the stt trends are down. The bullish seasonals include the two-year cycle, the fourth year of a presidential term, the six-month cycle, the Santa Claus rally, yearend window dressing and the January effect. On the S&...
READ MORE
MEMBERS ONLY
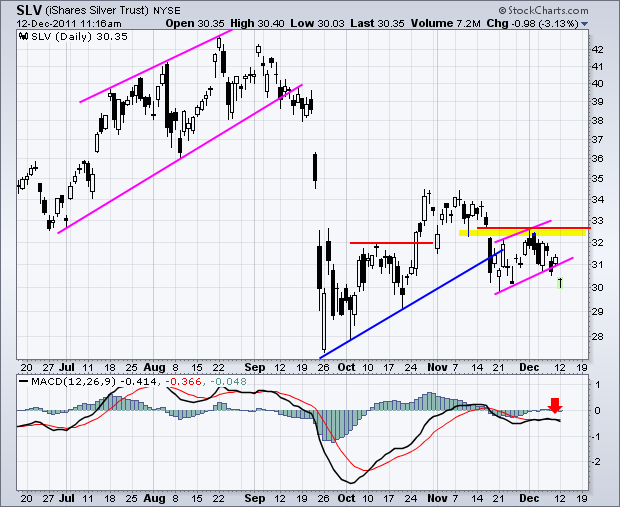
Silver ETF Breaks Flag Support
by Arthur Hill,
Chief Technical Strategist, TrendInvestorPro.com
Weakness in precious and industrial metals weighed on silver as the Silver Trust (SLV) broke flag support with a sharp decline Monday. This break signals a continuation of the breakdown from mid November. MACD moved below its signal line to turn momentum bearish. Resistance is set at the early December...
READ MORE
MEMBERS ONLY
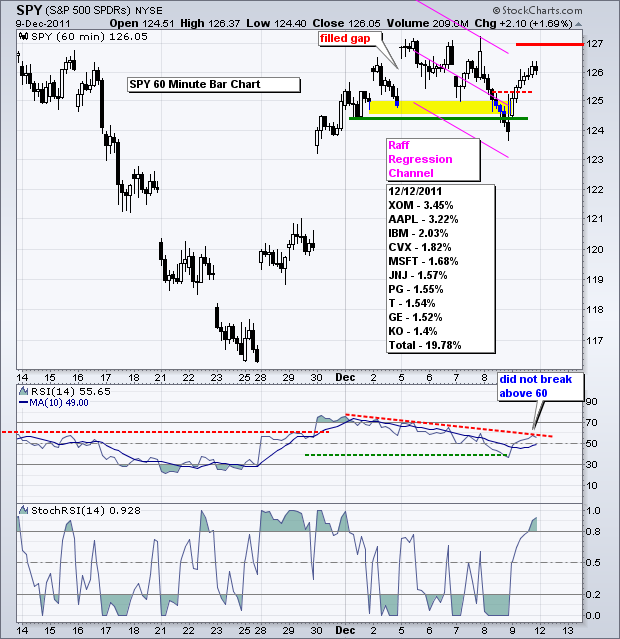
SPY Challenges Resistance as GLD Tests Key Support
by Arthur Hill,
Chief Technical Strategist, TrendInvestorPro.com
It looks like we had some sell-the-rumor and buy-the-news. Rumors of an EU breakdown were swirling on Thursday and this caused a sell-off in stocks. However, these rumors were squashed with an agreement to agree on fiscal constraints. Admittedly, we did not get a concrete...
READ MORE
MEMBERS ONLY
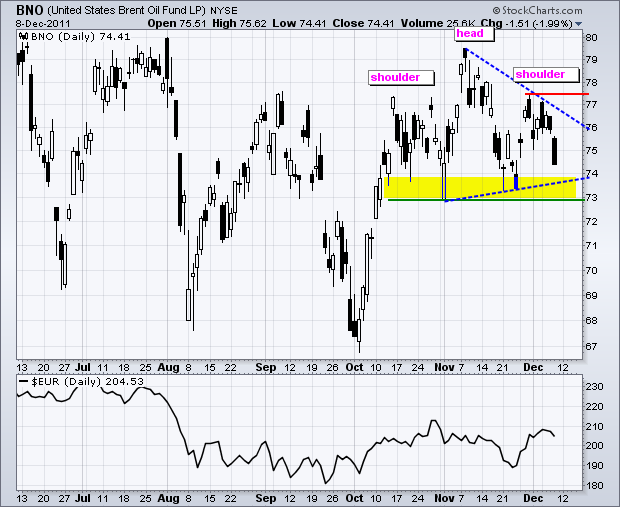
Brent Oil ETF Traces out Head-and-Shoulders Pattern
by Arthur Hill,
Chief Technical Strategist, TrendInvestorPro.com
The Brent Crude ETF (BNO) hit resistance from the summer highs and formed a small Head-and-Shoulders pattern over the last two months. Neckline support is set at 73, a break of which would confirm the pattern. The alternative pattern is a Symmetrical Triangle and a break above the...
READ MORE
MEMBERS ONLY
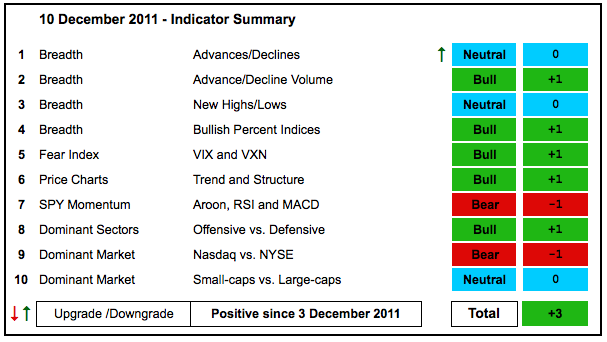
November Gaps and 50-day Lines Hold the Key
by Arthur Hill,
Chief Technical Strategist, TrendInvestorPro.com
There is not much change in the indicator summary. I upgraded the NYSE AD Line because this chart looks just like the charts for the Nasdaq and NYSE AD Volume Lines. The Nasdaq AD Line remains bearish so the AD Lines as a whole are neutral. Basically, the NYSE AD...
READ MORE
MEMBERS ONLY
SPY Breaks Short-Term Support as TLT Breaks Resistance
by Arthur Hill,
Chief Technical Strategist, TrendInvestorPro.com
The negotiation marathon continues in Brussels. The 27-nation block fell apart as the UK and Hungary opted out of the current deal. Eurocrats are, however, making progress with the remaining 17 plus 6 or so. Nobody really expected an earth shattering agreement that would completely solve the problem. There...
READ MORE
MEMBERS ONLY
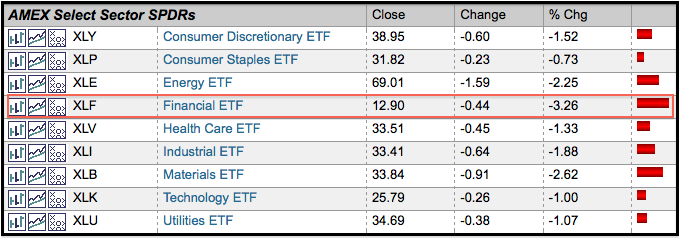
Finance Sector Leads Market Lower
by Arthur Hill,
Chief Technical Strategist, TrendInvestorPro.com
Once again, it is the finance sector feeling the heat from across the pond. This screenshot from the market summary page shows the nine sectors, and all are in the red. In afternoon trading on Thursday, XLF is the only one with a loss greater than 3%. Obviously, the banks...
READ MORE