MEMBERS ONLY
Stocks Consolidate as World Waits on Europe
by Arthur Hill,
Chief Technical Strategist, TrendInvestorPro.com
Today is the day - or rather two days. The European Central Bank (ECB) will make its policy statement and the 2-day EU summit starts. There are plenty of good reads and opinions regarding the EU situation. At the end of the day it boils down to probabilities and realities....
READ MORE
MEMBERS ONLY
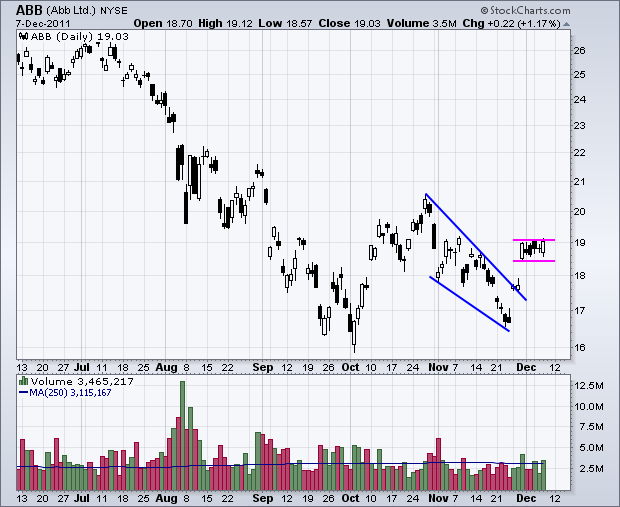
Charts of Interest: ABB, ABT, ECA, HPQ, XRAY
by Arthur Hill,
Chief Technical Strategist, TrendInvestorPro.com
ABB Consolidates after Breakout Surge.
ECA Bounces off Support for Potential Double Bottom.
XRAY Forms Bullish Pennant.
Plus ABT and HPQ.
This commentary and charts-of-interest are designed to stimulate thinking. This analysis is not a recommendation to buy, sell, hold or sell short any security (stock ETF or...
READ MORE
MEMBERS ONLY
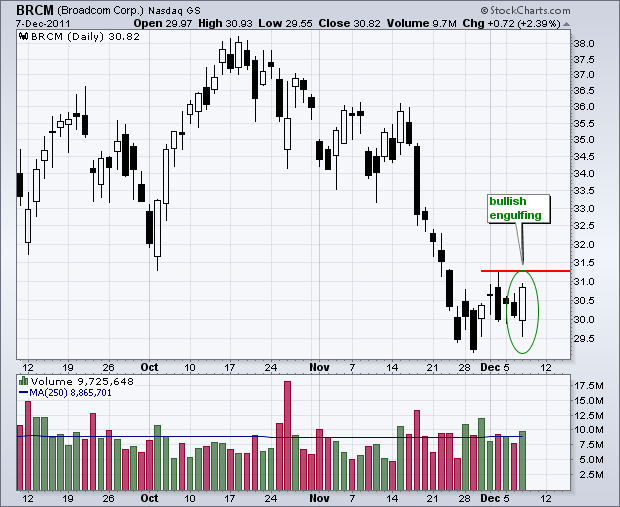
Broadcom Forms Bullish Engulfing on Good Volume
by Arthur Hill,
Chief Technical Strategist, TrendInvestorPro.com
Broadcom (BRCM) came across the bullish engulfing scan on Wednesday. After becoming oversold with a sharp decline in November, the stock firmed the last two weeks and formed a bullish engulfing on Wednesday. This white candlestick completely engulfed the prior black candlestick. Volume was also above average. Follow through above...
READ MORE
MEMBERS ONLY
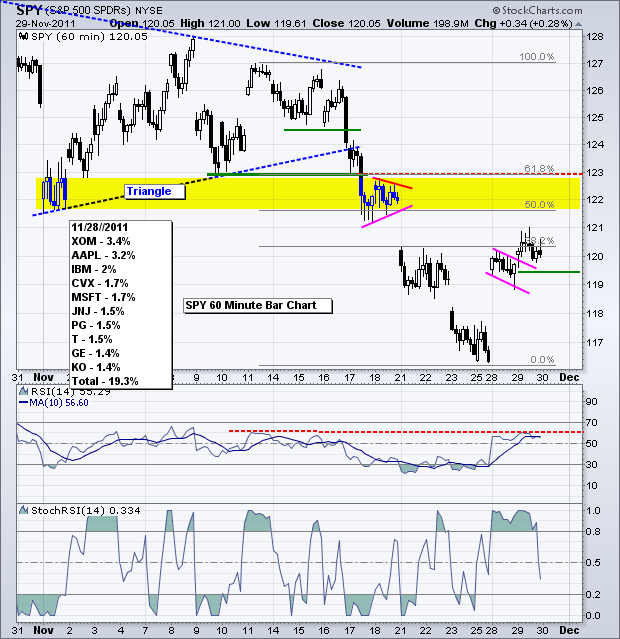
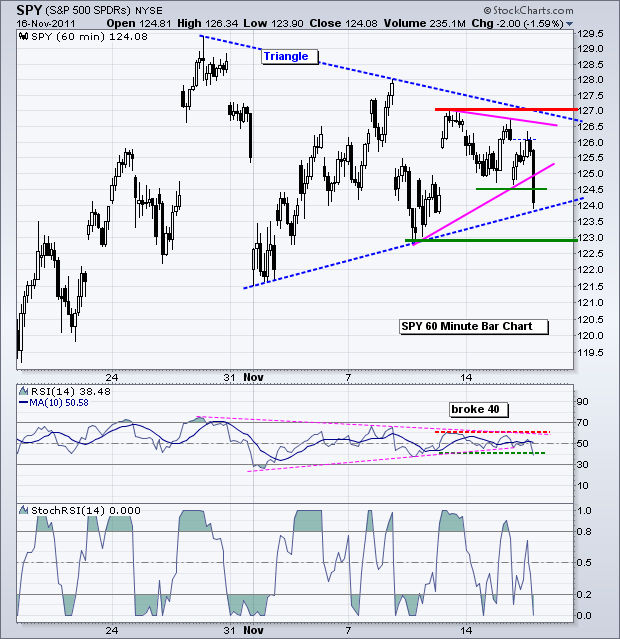
SPY Holds Uptrend, TLT Breaks Support and UUP Consolidates
by Arthur Hill,
Chief Technical Strategist, TrendInvestorPro.com
The stock market held its breadth yesterday as the major index ETFs were barely changed the entire day. No change in the short-term uptrend means the short-term uptrend remains in play. According to the financial press, stocks are waiting for clues from Europe, which will start to flow...
READ MORE
MEMBERS ONLY
Charts of Interest: AGU, ALTR, AMCC, JCOM, MAS, SHAW
by Arthur Hill,
Chief Technical Strategist, TrendInvestorPro.com
AGU Consolidates after Island Reversal.
MAS Challenges Flag Resistance.
SHAW Forms Small Flag after Breakout.
Plus ALTR, AMCC, JCOM
This commentary and charts-of-interest are designed to stimulate thinking. This analysis is not a recommendation to buy, sell, hold or sell short any security (stock ETF or otherwise). We...
READ MORE
MEMBERS ONLY
Stocks Hold Short-Term Uptrends as Gold Weakens
by Arthur Hill,
Chief Technical Strategist, TrendInvestorPro.com
This could be the week that breaks the bear's back or triggers a sharp reversal at resistance. While US ties to Europe are relatively small as a percentage of GDP, Europe's influence on the stock market and Dollar has been relatively large. Today's headlines...
READ MORE
MEMBERS ONLY
Home Construction iShares Leads with a Breakout
by Arthur Hill,
Chief Technical Strategist, TrendInvestorPro.com
The Home Construction iShares (ITB) is one of the strongest industry group ETFs in the market right now. The chart below shows ITB breaking above its mid-November high with a surge the last few days. In the indicator window, the Price Relative confirms relative strength with a move to...
READ MORE
MEMBERS ONLY
SPY Surges over 7% and GLD Follows
by Arthur Hill,
Chief Technical Strategist, TrendInvestorPro.com
That was one heck of a rally last week. SPY and QQQ surged over 7% and IWM was up over 10%. Was last week's surge an August-September surge or an October surge? A 7% surge in SPY compares to the beginning of October, which preceded a huge...
READ MORE
MEMBERS ONLY
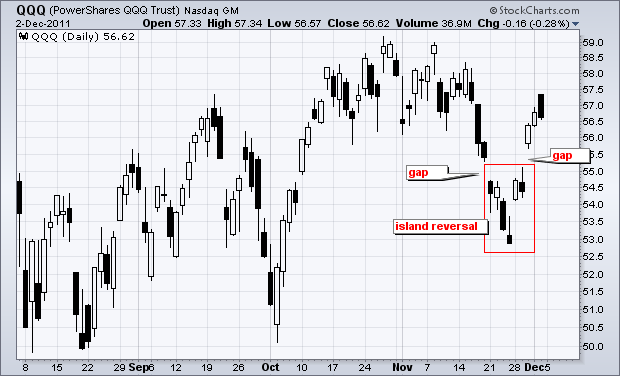
QQQ Forms Island Reversal with Big Move
by Arthur Hill,
Chief Technical Strategist, TrendInvestorPro.com
While gaps are not what they used to be, there were a few island reversals on the charts this week. The chart below shows the Nasdaq 100 ETF (QQQ) with a large island reversal over the last three weeks. A bullish island reversal forms with a gap down, a consolidation...
READ MORE
MEMBERS ONLY
Market Surge Turns Indicator Summary Positive
by Arthur Hill,
Chief Technical Strategist, TrendInvestorPro.com
With this week's big move, the indicator summary flipped from negative to positive. There are clearly some judgment calls at work here. It really boils down to accepting this week's surge as the real deal. The alternative is that it was just one heck of a...
READ MORE
MEMBERS ONLY
A Double Island Reversal for the Finance SPDR
by Arthur Hill,
Chief Technical Strategist, TrendInvestorPro.com
With a gap up on Monday and another on Wednesday, the Finance SPDR (XLF) formed two island reversals over the last three weeks. The first island formed on Friday-Monday (red circle). The second island formed from 21 to 29 November (blue oval). Notice the gaps on either side of...
READ MORE
MEMBERS ONLY
SPY and GLD Consolidate after Big Moves as TLT Hits Support
by Arthur Hill,
Chief Technical Strategist, TrendInvestorPro.com
This market is just itching to continue higher. As I write, the Dow futures are of over 100 points. Hints of a European deal are in the air, the US economic numbers have been pretty good and central banks are printing money. What more could a stock market want? Even...
READ MORE
MEMBERS ONLY
Watson Pharma Forms Monster Bearish Engulfing Patterm
by Arthur Hill,
Chief Technical Strategist, TrendInvestorPro.com
Even though the market moved sharply higher on Wednesday, Watson Pharma could not hold its early gain and closed weak. Wednesday's black/filled candlestick completely engulfed the prior white/hollow candlestick to form a bearish engulfing. Also notice that volume surged. You can read more on candlesticks in...
READ MORE
MEMBERS ONLY
IWM Surges over 10% in Three Days as Treasuries Correct
by Arthur Hill,
Chief Technical Strategist, TrendInvestorPro.com
Coordinated action from five central banks sparked a massive rally in the finance sector (+6.17%) that extended to the rest of the market. All sectors were up. Seven of nine were up more than 3%. Utilities and consumer staples were up less than 3%. The materials, energy, finance and...
READ MORE
MEMBERS ONLY
Charts of Interest: AMZN, BBY, FDX, LOW, LUV, RL, WY
by Arthur Hill,
Chief Technical Strategist, TrendInvestorPro.com
BBY Forms Dark Cloud at Key Retracement.
FDX Breaks Flag Resistance.
RL Traces out Bear Wedge.
Plus AMZN, LOW, LUV, WY
This commentary and charts-of-interest are designed to stimulate thinking. This analysis is not a recommendation to buy, sell, hold or sell short any security (stock ETF or...
READ MORE
MEMBERS ONLY
JP Morgan Surges off Support with Gap
by Arthur Hill,
Chief Technical Strategist, TrendInvestorPro.com
As one of the big money-center banks, JP Morgan (JPM) clearly benefited from the coordinated central bank action on Wednesday. The chart below shows JPM bouncing off support with a big gap on big volume. JPM closed near the high of the day. The gap is bullish as long...
READ MORE
MEMBERS ONLY
IWM Trades with Tight Range as TLT Holds its Breakout
by Arthur Hill,
Chief Technical Strategist, TrendInvestorPro.com
Guess what? Reports indicate that the Euro-zone bailout fund is smaller than EU finance ministers once thought. There is also a "secret" report suggesting that Italy is on the verge of blowing up the Euro zone. Yes, the rumors continue to fly. These latest rumors are putting...
READ MORE
MEMBERS ONLY
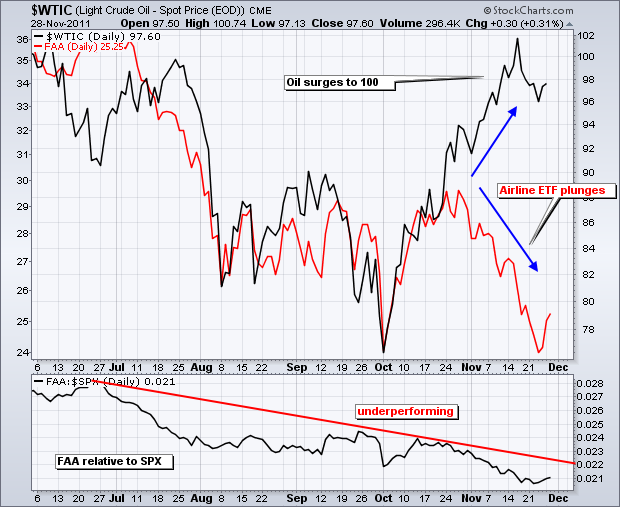
Airlines and Oil Go their Separate Ways
by Arthur Hill,
Chief Technical Strategist, TrendInvestorPro.com
The Airline ETF (FAA) and Spot Light Crude ($WTIC) were moving in the same direction from July to mid October, but went their separate was in late October. Spot Light Crude surged above 100 in November as the Airline ETF tested its early October low. Airlines are clearly not happy...
READ MORE
MEMBERS ONLY
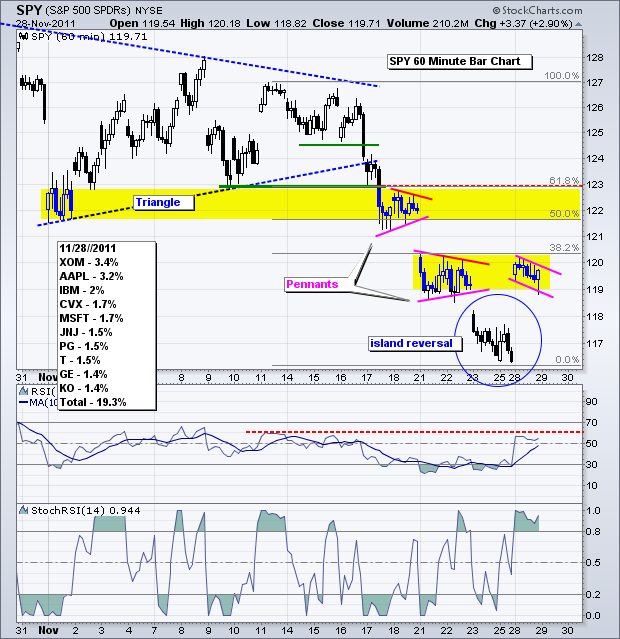
Stocks Gap Up and Hold Gaps as SPY Forms Island Reversal
by Arthur Hill,
Chief Technical Strategist, TrendInvestorPro.com
Stocks opened strong and finished strong with a broad advance on Monday. While it is still considered an oversold bounce within a bigger downtrend, there is room for further upside before resistance from broken support levels comes into play. SPY gapped up to form an island reversal over the last...
READ MORE
MEMBERS ONLY
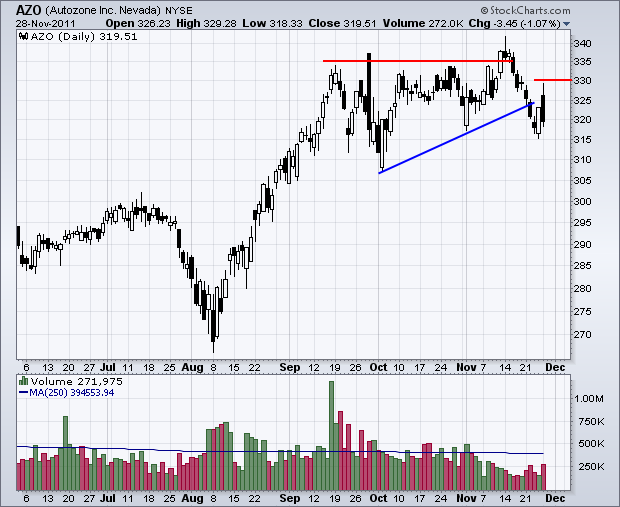
Charts of Interest: AZO, DDS, LH, SUN, TGT
by Arthur Hill,
Chief Technical Strategist, TrendInvestorPro.com
DDS Forms Pennant after Sharp Decline.
LH Challenges Flag Resistance.
SUN Gaps above Wedge Resistance.
Plus AZO and TGT.
This commentary and charts-of-interest are designed to stimulate thinking. This analysis is not a recommendation to buy, sell, hold or sell short any security (stock ETF or otherwise). We...
READ MORE
MEMBERS ONLY
Oil and Gasoline ETFs Diverge
by Arthur Hill,
Chief Technical Strategist, TrendInvestorPro.com
The indicator window shows the US Gasoline Fund (UGA) peaking in mid October (blue) and moving lower the last six weeks, while the US Oil Fund (USO) continued moving higher (red). Something needs to give here. Notice that UGA formed a large descending triangle the last 5-6 months and...
READ MORE
MEMBERS ONLY
Stocks and Euro Poised for Oversold Bounce
by Arthur Hill,
Chief Technical Strategist, TrendInvestorPro.com
Stock futures are trading sharply higher on news (rumors) of an Italian bailout. Also note that it is a big week on the economic front. See the listing of economic reports further down in this commentary. Market moving rumors and innuendo are all part of the game these days. Traders...
READ MORE
MEMBERS ONLY
Wal-Mart Moves into Narrow Range as Black Friday Hits
by Arthur Hill,
Chief Technical Strategist, TrendInvestorPro.com
Wal-Mart (WMT) remains in an uptrend overall, but may be poised for a correction as Black Friday comes and goes. The stock declined sharply in mid November and then consolidated the last 6-7 days. Watch for a break from this consolidation to trigger the next signal.
Click this...
READ MORE
MEMBERS ONLY
Broken Support Turns First Resistance for German DAX
by Arthur Hill,
Chief Technical Strategist, TrendInvestorPro.com
After forming a rising wedge in October, the German DAX reversed in the key retracement zone and broke support with a sharp decline below 5700 the last few days. These are clearly bearish developments. Broken support in the 5800 area turns first resistance, which is confirmed by the trendline extending...
READ MORE
MEMBERS ONLY
Indicator Summary Turns Negative as Breakouts Fail
by Arthur Hill,
Chief Technical Strategist, TrendInvestorPro.com
Monday's sharp decline was enough to trigger a slew of downgrades in the indicator summary. I noted on Friday that the indicator was already looking vulnerable and it would not take much to tilt the balance back to the bears. Monday's big decline marked the fifth...
READ MORE
MEMBERS ONLY
Stocks Consolidate as Treasuries Stay Strong
by Arthur Hill,
Chief Technical Strategist, TrendInvestorPro.com
The stock market can fall simply from a lack of buying pressure. In other words, it does not always take an increase in selling pressure to produce a decline. It is pretty easy to come up with reasons not to buy. The major index ETFs broke support levels with sharp...
READ MORE
MEMBERS ONLY
Only a Handful of Stocks are Up the last Five Days
by Arthur Hill,
Chief Technical Strategist, TrendInvestorPro.com
There have been few hiding places over the last five trading days. The major indices are down sharply and all sectors are also down. As the Sector Market Carpet shows, stocks in the utilities and consumer staples sectors were down the least, while technology and energy stocks were down the...
READ MORE
MEMBERS ONLY
SPY Becomes Oversold as TLT Becomes Overbought
by Arthur Hill,
Chief Technical Strategist, TrendInvestorPro.com
With the major index ETFs down 5-6% in the last six trading days, the market is short-term oversold and this could pave the way for a consolidation or oversold bounce. Trading could also get real tricky as volume dries up for the Thanksgiving holiday and the potential news...
READ MORE
MEMBERS ONLY
Charts of Interest: ALTR, IR, M, NVDA, URBN, WDC
by Arthur Hill,
Chief Technical Strategist, TrendInvestorPro.com
NVDA Buck the Market with Big Surge.
URBN Firms with Falling Wedge.
WDC Forms Harami with two Inside Days.
Plus ALTR, IR and M.
This commentary and charts-of-interest are designed to stimulate thinking. This analysis is not a recommendation to buy, sell, hold or sell short any security...
READ MORE
MEMBERS ONLY
All 30 Dow Stocks Moving Lower
by Arthur Hill,
Chief Technical Strategist, TrendInvestorPro.com
The CandleGlance chart for the 30 Dow stocks provides snapshot of the current day's action. As of 12:30ET on Monday, all 30 components were down with most down over 2%. This is clearly a broad-based decline that is affecting all sectors. The screenshot below shows the...
READ MORE
MEMBERS ONLY
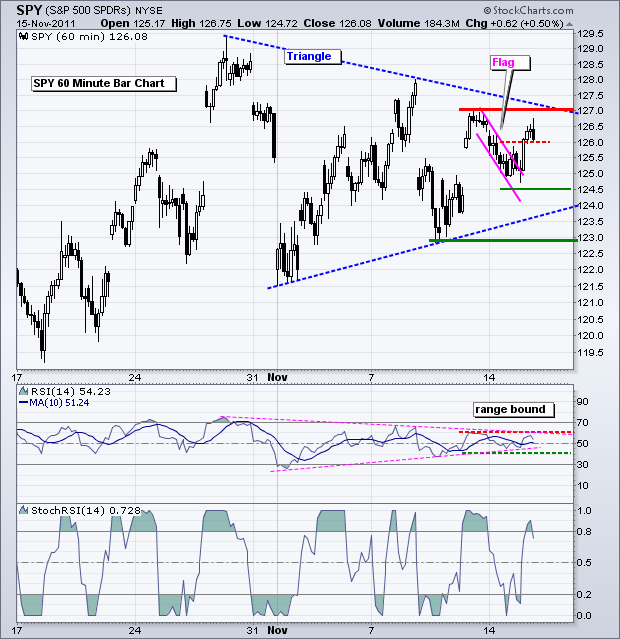
SPY Forms Pennant as TLT Holds Breakout
by Arthur Hill,
Chief Technical Strategist, TrendInvestorPro.com
The risk-off trade remains the flavor of the month. Stocks broke down last week as the Dollar and Treasuries moved to their highest levels for November. The S&P 500 ETF (SPY) broke triangle support with a sharp decline on Wednesday-Thursday and then consolidated on Friday with...
READ MORE
MEMBERS ONLY
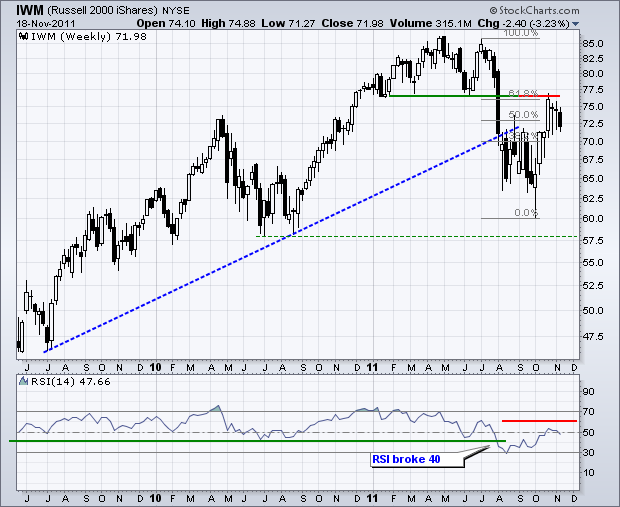
Russell 2000 ETF Hits Big Resistance
by Arthur Hill,
Chief Technical Strategist, TrendInvestorPro.com
A number of bearish developments have emerged on the weekly chart for the Russell 2000 ETF (IWM). This weekly chart extends two and a half years to cover the long-term situation. First, the ETF broke support with a sharp decline in August and then exceeded the July 2009 trendline....
READ MORE
MEMBERS ONLY
Bollinger Bands Narrow for Procter & Gamble
by Arthur Hill,
Chief Technical Strategist, TrendInvestorPro.com
After a sharp decline and gap down, Procter & Gamble (PG) moved into a tight trading range the last three weeks. The pink lines show a pennant or small triangle taking shape. The blue lines show Bollinger Bands (10,2) narrowing as well. A break below the lower band would...
READ MORE
MEMBERS ONLY
Indicator Summary is Still Positive, but Looks Vulnerable
by Arthur Hill,
Chief Technical Strategist, TrendInvestorPro.com
Even though there is no change in the indicator summary, it would not take much to tilt the balance back to the bears. With this week's sharp decline, the major index ETFs are on the verge of support breaks that would question the October breakouts. Support breaks in...
READ MORE
MEMBERS ONLY
Breakouts in TLT and UUP Show a Return to Risk-off
by Arthur Hill,
Chief Technical Strategist, TrendInvestorPro.com
The risk-off trade took center stage on Thursday. Treasuries and the Dollar were higher, while stocks, commodities and the Euro were lower. Gold followed the stock market again. The S&P 500 ETF (SPY) broke triangle support with a sharp decline over the last two days. After a...
READ MORE
MEMBERS ONLY
Techs and Finance Lead Lower in Market Carpet
by Arthur Hill,
Chief Technical Strategist, TrendInvestorPro.com
The Market Carpet is a sea of red on Thursday with the technology and finance sectors leading the way lower. Notice the numbers in the top box of each sector. The average tech stock is down 2.8% and the average finance stock is down 2.2% (just before the...
READ MORE
MEMBERS ONLY
SPY Breaks Support with Triangle as TLT Challenges Resistance
by Arthur Hill,
Chief Technical Strategist, TrendInvestorPro.com
With the US Dollar Fund (UUP) hitting its highest level of the month and the 20+ year Bond ETF (TLT) on the verge of a breakout, it is little wonder stocks finally succumbed to some selling pressure. Also note that $LIBOR continues to rise and the Finance SPDR (XLF) continues...
READ MORE
MEMBERS ONLY
Charts of Interest: ADP, AMZN, CTAS, INTU, JDSU, MON, SYMC
by Arthur Hill,
Chief Technical Strategist, TrendInvestorPro.com
AMZN Forms Rising Wedge in Gap Zone.
The Triangle Noose Tightens for CTAS.
SYMC Consolidates after Sharp Decline.
Plus ADP, INTU, JDSU, MON
This commentary and charts-of-interest are designed to stimulate thinking. This analysis is not a recommendation to buy, sell, hold or sell short any security (stock...
READ MORE
MEMBERS ONLY
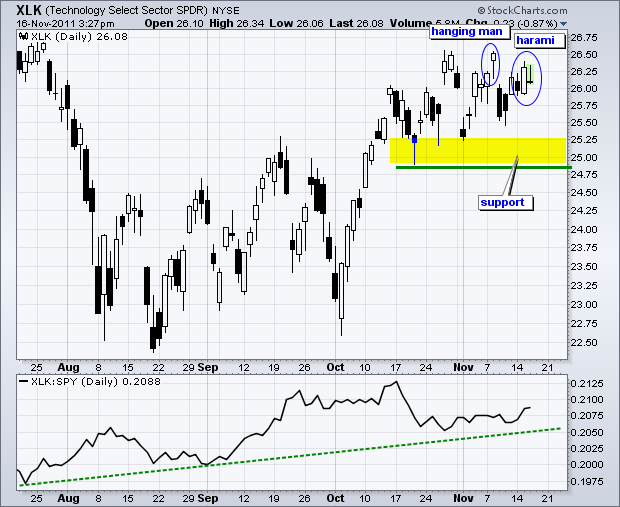
A Hanging Man and a Harami for XLK
by Arthur Hill,
Chief Technical Strategist, TrendInvestorPro.com
The Technology SPDR (XLK) is hitting resistance from the late October high with a Hanging Man last week and a Harami this week. Both candlesticks are bearish reversal patterns. The Hanging Man was confirmed with a gap down and long black candlestick, but the ETF quickly bounced back above 26....
READ MORE
MEMBERS ONLY
SPY Remains Rangebound as UUP and TLT Strengthen
by Arthur Hill,
Chief Technical Strategist, TrendInvestorPro.com
Even though the Euro and Treasuries surged off support over the last two days, stocks are holding up and oil remains near $100. It is a paradox and something needs to give here. Strength in Treasuries and the Dollar is tied to the risk-off trade, while strength in stocks...
READ MORE