MEMBERS ONLY
Indicator Summary Improves, but Still No Breakouts
by Arthur Hill,
Chief Technical Strategist, TrendInvestorPro.com
Stocks reversed last Tuesday and surged the last nine days, but this has not been enough to push the indicator summary into positive territory. Another week or two of strength would likely lead to resistance breakouts in the major index ETFs and some key breadth statistics. For now though, the...
READ MORE
MEMBERS ONLY
Short-term Uptrend Starts to Lose Momentum
by Arthur Hill,
Chief Technical Strategist, TrendInvestorPro.com
Upside momentum is weakening in the stock market, but the short-term swing remains up and we have yet to see an actual breakdown. There is often a pecking order to a trend reversal, even a short-term trend reversal. The short-term trend has been up since the breakouts last Tuesday (October...
READ MORE
MEMBERS ONLY
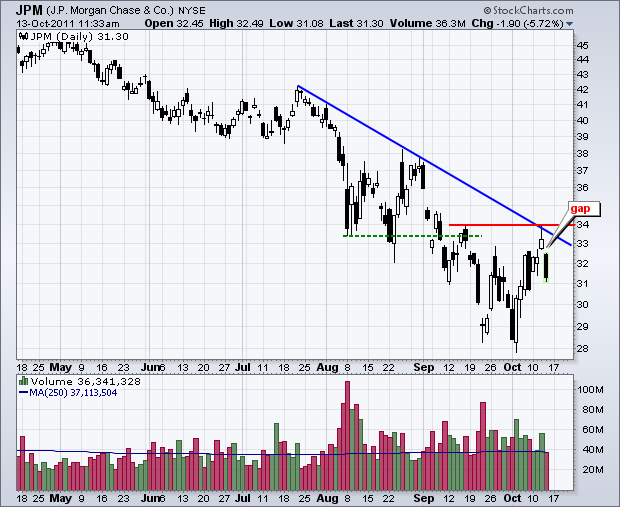
JP Morgan Leads Finance Sector Lower with Gap Down
by Arthur Hill,
Chief Technical Strategist, TrendInvestorPro.com
JP Morgan kicked off earnings season for the finance sector with a failure at resistance. After a 10+ percent surge the prior seven days, the stock hit resistance in the 33-34 area and gapped down on Wednesday. The big trend is clearly down and a break above 34 is needed...
READ MORE
MEMBERS ONLY
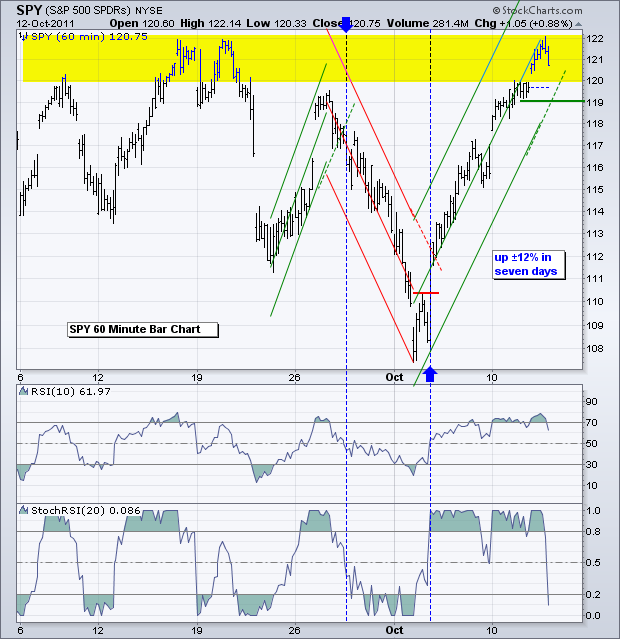
SPY Looses Some Upside Momentum as Oil Weakens
by Arthur Hill,
Chief Technical Strategist, TrendInvestorPro.com
Stocks started the day with a bang, kept their gains most of the day and then sold off in the afternoon. With the S&P 500 ETF (SPY) up some 12% in seven days, the market is pricing in some pretty good news or some better-than-expected earnings reports. With...
READ MORE
MEMBERS ONLY
Charts: CCL, CHKP, FNSR, GRMN, MCD, SBUX, WINN
by Arthur Hill,
Chief Technical Strategist, TrendInvestorPro.com
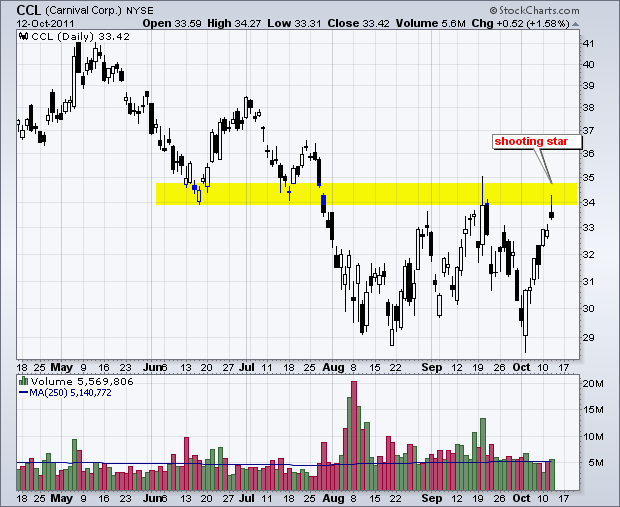
Careful, it is earnings season....
CCL Forms Shooting Star at Resistance.
MCD Tracing out Bearish Engulfing with Uptick in Volume.
WINN Consolidates after Bounce.
Plus CHKP, FNSR, GRMN, SBUX
This commentary and charts-of-interest are designed to stimulate thinking. This analysis is not a recommendation to buy, sell, hold or sell...
READ MORE
MEMBERS ONLY
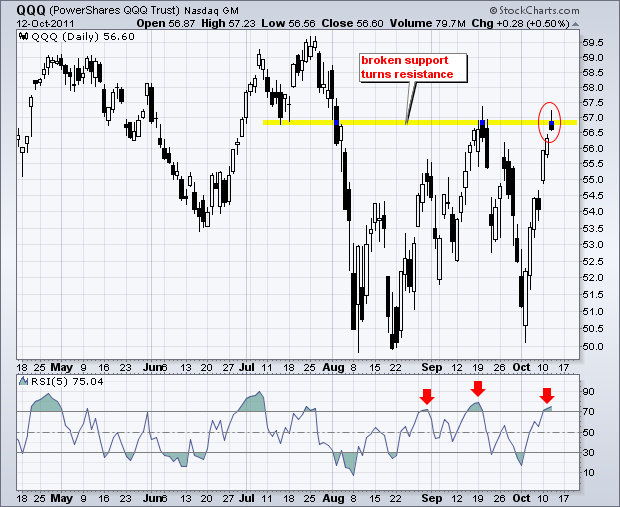
QQQ Gets Cold Feet at Resistance
by Arthur Hill,
Chief Technical Strategist, TrendInvestorPro.com
The Nasdaq 100 ETF (QQQ) surged all the way to its September high and formed a small black candlestick with a modest upper shadow on Wednesday. This shows that the ETF moved above 57 intraday, but failed to hold these gains and closed near the low for the day. The...
READ MORE
MEMBERS ONLY
SPY Hits Resistacne Zone as GLD Forms Rising Flag
by Arthur Hill,
Chief Technical Strategist, TrendInvestorPro.com
Earnings season kicked off on Tuesday and stocks stalled in mixed trading. A mere six days ago, the S&P 500 ETF (SPY) was trading around 108, just before the big Tuesday turnaround on October 4th. The ETF was then down some 14% from its September high and around...
READ MORE
MEMBERS ONLY
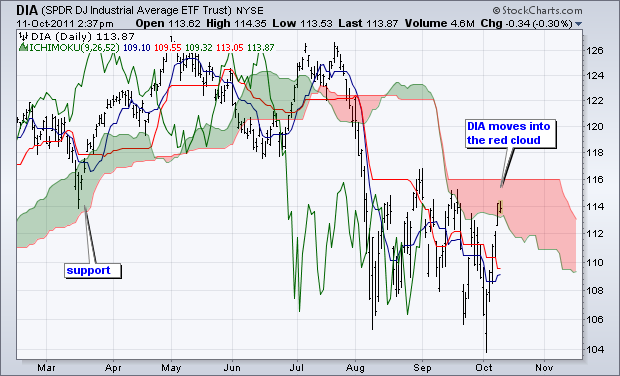
Dow Industrials SPDR Moves into the Red Cloud
by Arthur Hill,
Chief Technical Strategist, TrendInvestorPro.com
With a big surge the last 5-6 days, the Dow Industrials SPDR (DIA) moved into the red cloud. This chart shows DIA breaking below the cloud in early August. This cloud now turns into a resistance zone that holds the key to the current downtrend. You can read more on...
READ MORE
MEMBERS ONLY
Stocks Extend Gains as TLT Hits Support Zone
by Arthur Hill,
Chief Technical Strategist, TrendInvestorPro.com
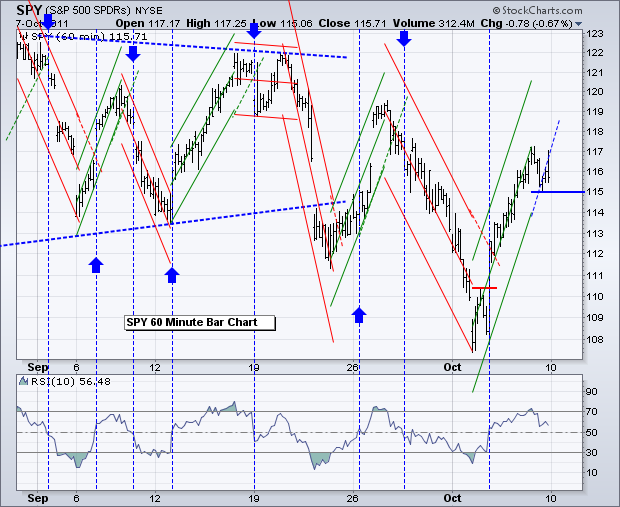
Stocks opened strong, remained strong and closed strong on Columbus Day. Unsurprisingly, volume was very light. This move keeps the short-term uptrends alive and allows for an extension of the rising channels. On the S&P 500 ETF (SPY) chart, the Raff Regression Channel can now be drawn from...
READ MORE
MEMBERS ONLY
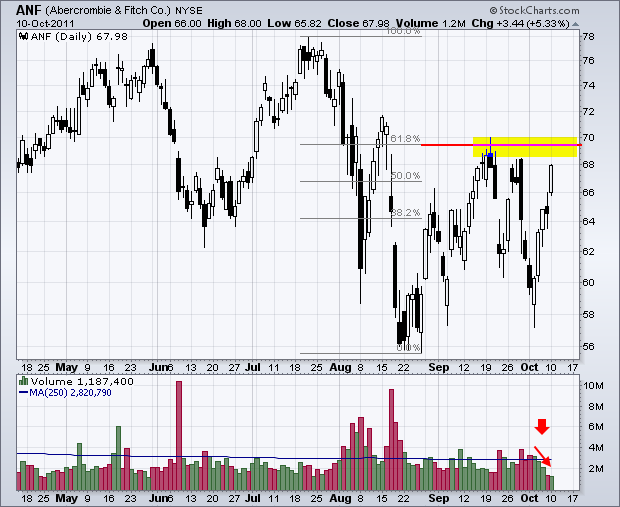
Charts of Interest: ANF, EXPD, LULU, MOLX, PX
by Arthur Hill,
Chief Technical Strategist, TrendInvestorPro.com
Careful, it is earnings season.
ANF Surges to Resistance on Low Volume.
EXPD Retraces 61.80% of Prior Decline.
PX Surges into Resistance Zone.
Plus LULU and MOLX.
This commentary and charts-of-interest are designed to stimulate thinking. This analysis is not a recommendation to buy, sell, hold or sell short...
READ MORE
MEMBERS ONLY
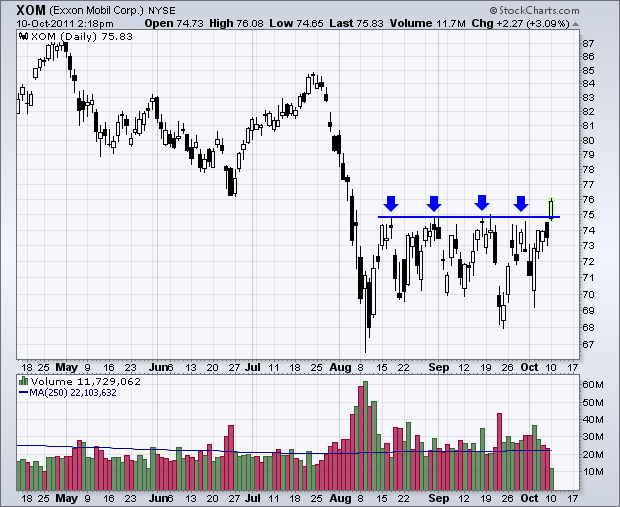
Exxon Mobil Breaks Above Resistance
by Arthur Hill,
Chief Technical Strategist, TrendInvestorPro.com
After at least four attempts, Exxon Mobil (XOM) finally broke above 75 and exceeded resistance. This level held from mid August until today. The breakout zone around 74-75 becomes first support. A below 74 would question the validity of this breakout.
Click this image for a live chart...
READ MORE
MEMBERS ONLY
Dollar Continues Correction as Stocks Continue Upswing
by Arthur Hill,
Chief Technical Strategist, TrendInvestorPro.com
It is another week and we have yet another promise from EU leaders. Dexia Bank passed the European stress test a few months ago and went belly up last week. This weekend we saw another flurry of pledges and deadlines to fixed the European debt situation. According to Sarkozy and...
READ MORE
MEMBERS ONLY
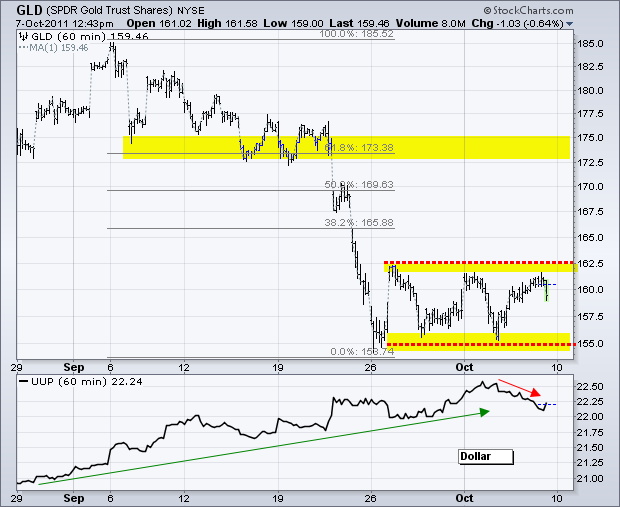
The Battle Lines are Drawn as the Gold SPDR Consolidates
by Arthur Hill,
Chief Technical Strategist, TrendInvestorPro.com
After a sharp decline in September, the Gold SPDR (GLD) moved into a consolidation the last two weeks. Support resides at 155 and resistance 162.50. Traders should watch these levels for the next direction clue. Also watch the Dollar. Gold bounced this week as the Dollar declined, but a...
READ MORE
MEMBERS ONLY
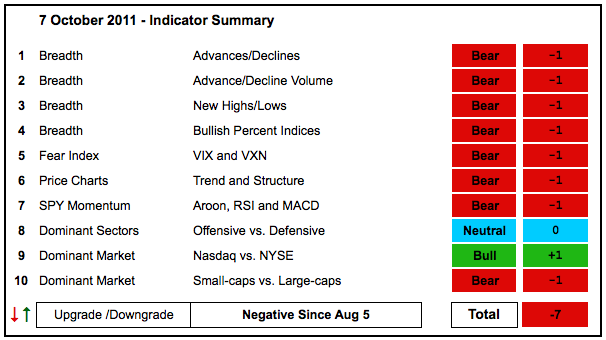
Reversal Day and Gains Fail to Sway Indicator Summary
by Arthur Hill,
Chief Technical Strategist, TrendInvestorPro.com
Despite a big reversal on Tuesday and good gains Wednesday-Thursday, the Indicator Summary remains decidedly negative. These gains simply erased the losses from Monday and the gain for the week is still modest compared to recent volatility. More importantly, lower lows formed with the plunge on October 3rd (Monday) and...
READ MORE
MEMBERS ONLY
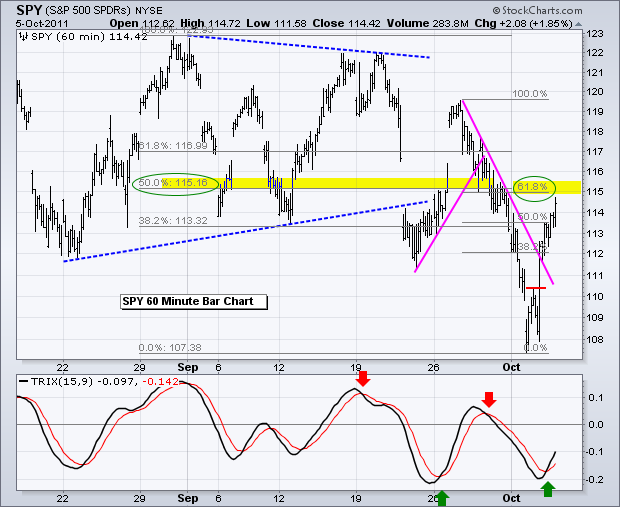
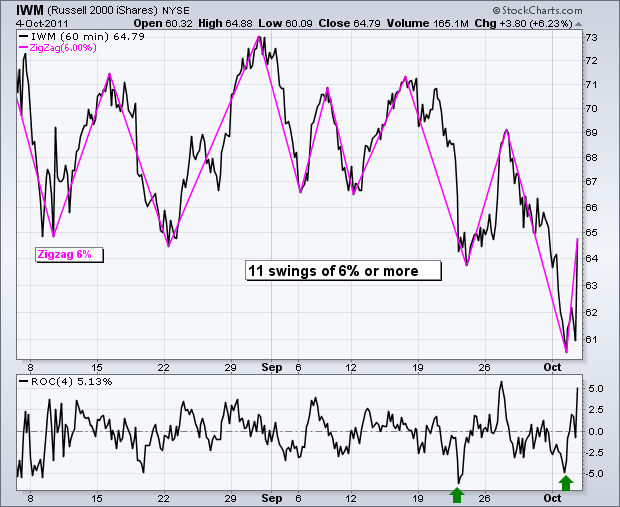
Using the Raff Regression Channel to Trade Swings in SPY
by Arthur Hill,
Chief Technical Strategist, TrendInvestorPro.com
There is nothing to do now, but wait for the market's reaction to the employment report. The current swing for stocks remains up. Since early August, the S&P 500 ETF (SPY) has 11 swings that are at least 5 percent. The ETF started August with a...
READ MORE
MEMBERS ONLY
Gold Miners ETF Fills Gap with Bounce off Support
by Arthur Hill,
Chief Technical Strategist, TrendInvestorPro.com
The Gold Miners ETF (GDX) is making waves with an oversold bounce off support the last two days. The ETF briefly broke below its June low on Tuesday, but recovered with the rest of the market and filled the gap with a strong close. Also notice that RSI moved below...
READ MORE
MEMBERS ONLY
SPY Moves into Center of Seven Week Range
by Arthur Hill,
Chief Technical Strategist, TrendInvestorPro.com
The current upswing continued as stocks added to Tuesday's gains. All major index ETFs were up over 1%, but the Russell 2000 ETF (IWM) lagged with the smallest gain. Unsurprisingly, the Nasdaq 100 ETF (QQQ) led the way higher with a 2.57% gain. Big techs continue to...
READ MORE
MEMBERS ONLY
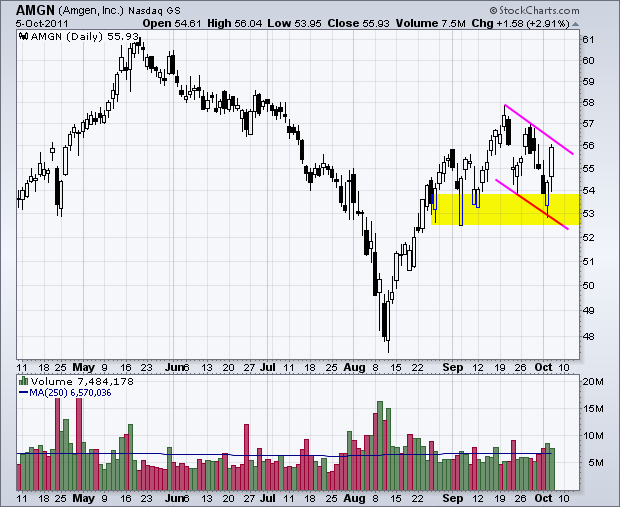
Charts of Interest: AMGN, ASEI, FLIR, LLTC, LRCX, PFE, TTWO
by Arthur Hill,
Chief Technical Strategist, TrendInvestorPro.com
FLIR Forms Bullish Engulfing at Key Retracement.
LRCX Breaks Triangle Resistance.
PFE Breaks Channel Resistance with Volume.
Plus AMGN, ASEI, LRCX, TTWO
This commentary and charts-of-interest are designed to stimulate thinking. This analysis is not a recommendation to buy, sell, hold or sell short any security (stock ETF or otherwise)...
READ MORE
MEMBERS ONLY
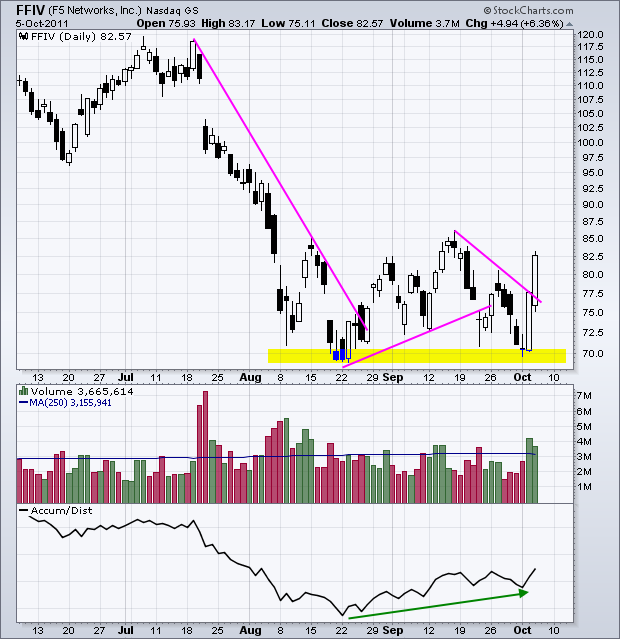
F5 Networks Surges off Support with Big Volume
by Arthur Hill,
Chief Technical Strategist, TrendInvestorPro.com
F5 Networks (FFIV) formed a doji near the August low and then surged off this support level with two long white candlesticks. Volume was also above average both days. In the indicator window, the Accumulation Distribution Line bottomed in August and formed a higher low in early October. Money appears...
READ MORE
MEMBERS ONLY
SPY Surges Back to Broken Support Zone
by Arthur Hill,
Chief Technical Strategist, TrendInvestorPro.com
There it is again. Stocks were down sharply in afternoon trading and then mounted a spectacular advance in the final 50 minutes. Press reports attributed this turnaround to an article in the FT. According to the FT, European finance ministers were considering another package to save European banks. Yes, Europe...
READ MORE
MEMBERS ONLY
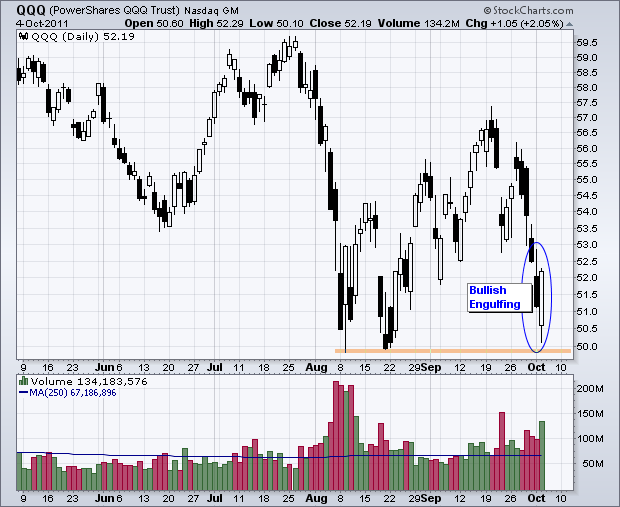
QQQ Forms Bullish Engulfing At Support
by Arthur Hill,
Chief Technical Strategist, TrendInvestorPro.com
With a lower open and sharp advance in the final hour, the Nasdaq 100 ETF (QQQ) formed a large bullish engulfing on high volume. Also note that this pattern comes with a successful, for now, test of the August lows. Now let's see if the bulls can follow...
READ MORE
MEMBERS ONLY
Small-Caps Lead Stocks Lower and Gold Bounces
by Arthur Hill,
Chief Technical Strategist, TrendInvestorPro.com
The S&P 500 ETF (SPY), Nasdaq 100 ETF (QQQ) and Russell 2000 ETF (IWM) all broke below their September lows on Monday. IWM led the market lower with a break below its early August lows. Small-caps have shown relative weakness for several months now and this remains a...
READ MORE
MEMBERS ONLY
Charts of Interest: AAPL, CHRW, CMCSA, HOG, PG, PLCE
by Arthur Hill,
Chief Technical Strategist, TrendInvestorPro.com
AAPL Hits Congestion Zone as iPhone Announcement Looms.
CHRW Forms Triangle within Downtrend.
PG Backs off Resistance Again.
Plus CMCSA, HOG, PLCE
This commentary and charts-of-interest are designed to stimulate thinking. This analysis is not a recommendation to buy, sell, hold or sell short any security (stock ETF or otherwise)...
READ MORE
MEMBERS ONLY
Campbell Soupd and Newmont Show Gains on the Market Carpet
by Arthur Hill,
Chief Technical Strategist, TrendInvestorPro.com
It was a sea of red on Monday as stocks declined sharply. All sectors were down, but there were a few isolated gainers. These can be found on the Sector Market Carpet. Two come from the consumer staples sector (Campbell Soup and Lorillard). One comes from the precious metals group...
READ MORE
MEMBERS ONLY
SPY Poised to Test 2011 Lows as Gold Firms
by Arthur Hill,
Chief Technical Strategist, TrendInvestorPro.com
The S&P 500 ETF (SPY) broke down with a move below 114, but surged right back to broken support in the 119 area. Talk about a vicious bull trap. The ETF ultimately formed a lower high below 120 and moved sharply lower the last three days. SPY broke...
READ MORE
MEMBERS ONLY
TECHNOLOGY SPDR FAILS AT KEY RETRACEMENT
by Arthur Hill,
Chief Technical Strategist, TrendInvestorPro.com
After hitting resistance at a key retracement this month, the Technology ETF (XLK) fell with what looks like a continuation of the bigger downtrend. First, notice that the ETF formed a massive Triple Top that extends from January to July. XLK became oversold with the July-August breakdown and then retraced...
READ MORE
MEMBERS ONLY
FTSE and EuroNext Move Sharply Lower
by Arthur Hill,
Chief Technical Strategist, TrendInvestorPro.com
The London FTSE 100 ($FTSE) and the EuroNext 100 ($N100) moved sharply lower on Friday. These two indices are easy to track from the StockCharts.com home page. The chart below comes from the home page. Click on the tabs at the top to see real time charts for four...
READ MORE
MEMBERS ONLY
Indicator Summary Remains Very Negative
by Arthur Hill,
Chief Technical Strategist, TrendInvestorPro.com
There is no change in the indicator summary. Nine of ten indicator groups are in bear mode. The NYSE AD Volume Line broke down last week. Small-caps show relative weakness as the $RUT:$OEX ratio hit a new low this month. The CBOE Volatility Index ($VIX) remains at relatively high...
READ MORE
MEMBERS ONLY
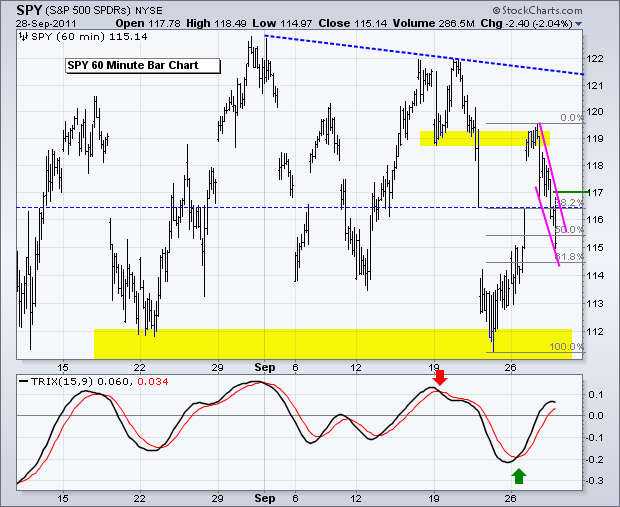
Stocks Pop, Drop and Pop, but Remain in Downtrend
by Arthur Hill,
Chief Technical Strategist, TrendInvestorPro.com
Despite a pop, drop and pop on Thursday, the short-term trend for stocks remains down. SPY opened above 117, but these gains did not last long as the ETF quickly dropped below 115. Selling pressure was actually pretty intense during the afternoon selloff. Even so, most of the losses were...
READ MORE
MEMBERS ONLY
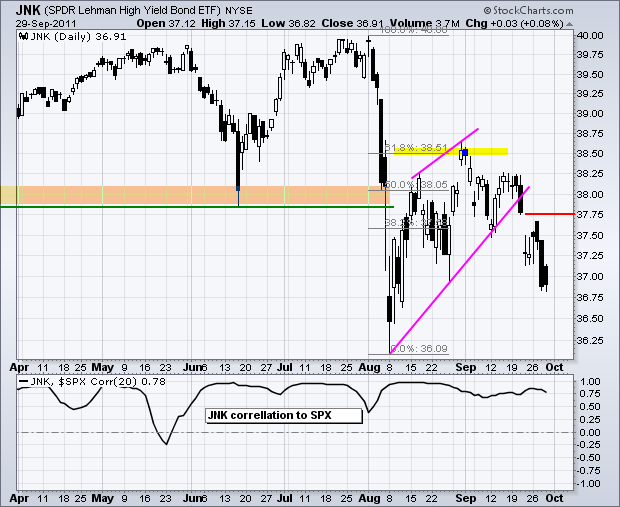
Junk Bond ETF Remains with Wedge Support Break
by Arthur Hill,
Chief Technical Strategist, TrendInvestorPro.com
The High-Yield Bond SPDR (JNK) has a strong positive correlation to the stock market. Notice that the Correlation Coefficient is consistently above the .50 level. This means that the Junk Bond ETF and the S&P 500 move in the same direction most of the time. It could, therefore,...
READ MORE
MEMBERS ONLY
SPY Forms Bull Flag as GLD Tests Prior Low
by Arthur Hill,
Chief Technical Strategist, TrendInvestorPro.com
Stocks continued their choppy ways with small and mid-caps leading the market lower on Wednesday. Oil, industrial metals and gold were also down sharply. The Dollar moved higher and US Treasuries were flat. The big trend for the stock market is down after the August breakdown, but trading since early...
READ MORE
MEMBERS ONLY
Charts of Interest: AET, ANF, JWN, LULU, MDT
by Arthur Hill,
Chief Technical Strategist, TrendInvestorPro.com
AET Reverses at Key Retracement.
ANF Stalls after Gap.
LULU Breaks Trendline with Gap Down.
Plus JWN and MDT.
This commentary and charts-of-interest are designed to stimulate thinking. This analysis is not a recommendation to buy, sell, hold or sell short any security (stock ETF or otherwise). We all need...
READ MORE
MEMBERS ONLY
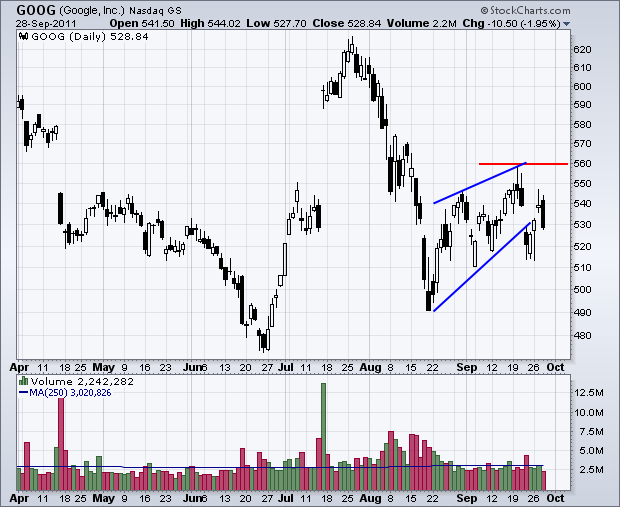
Bearish Engulfing Scan Lights Up
by Arthur Hill,
Chief Technical Strategist, TrendInvestorPro.com
With a strong open and weak close on Wednesday, hundres of stocks made the cut for the bearish engulfing scan (177 Nasdaq and 183 NYSE). The chart below shows Google ($GOOG) breaking wedge support last week and forming a bearish engulfing after a three day bounce. You can find more...
READ MORE
MEMBERS ONLY
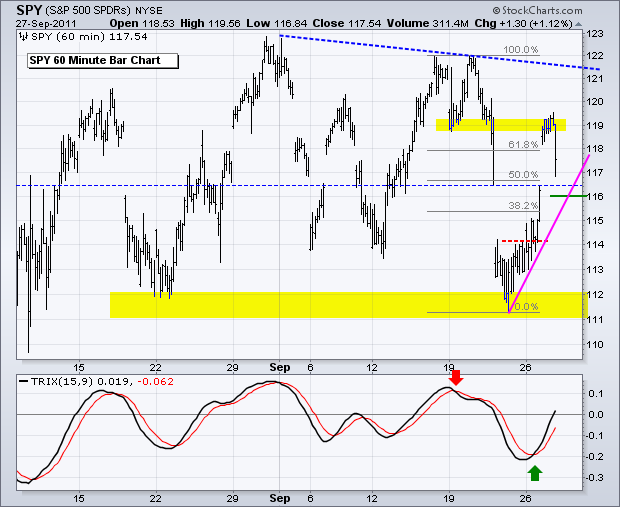
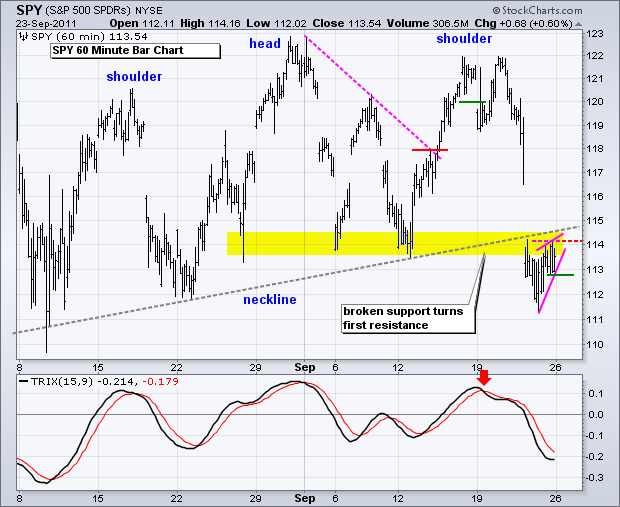
SPY Hits Resistance from Broken Support
by Arthur Hill,
Chief Technical Strategist, TrendInvestorPro.com
What a mess. The S&P 500 ETF (SPY) has been trading between 110 and 123 since early August (seven weeks). During this timeframe, the ETF has crossed the midpoint (116.50) at least 11 times. There have also been nine swings of at least five percent. This is...
READ MORE
MEMBERS ONLY
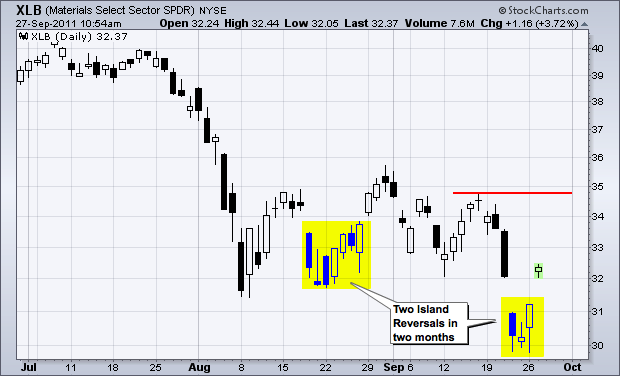
Basic Materials SPDR Produces Two Island Reversals in Two Months
by Arthur Hill,
Chief Technical Strategist, TrendInvestorPro.com
Recent volatility is making rare patterns not so rare. The chart below shows the Basic Materials SPDR (XLB) with its second Island Reversal in as many months. The most recent pattern formed with a gap down on Thursday, a consolidation Friday-Monday and a big gap up today. Shorts on Thursday-Friday-Monday...
READ MORE
MEMBERS ONLY
Stocks, Gold and Oil Get Oversold Bounce
by Arthur Hill,
Chief Technical Strategist, TrendInvestorPro.com
Stocks surged on Monday with the finance, energy and materials sectors leading the way. These three were also the most oversold. While Net Advancing Volume was fairly strong, Net Advances for the Nasdaq and NYSE were not that strong. Net Advances equals advancing issues less declining issues. Showing Net Advances...
READ MORE
MEMBERS ONLY
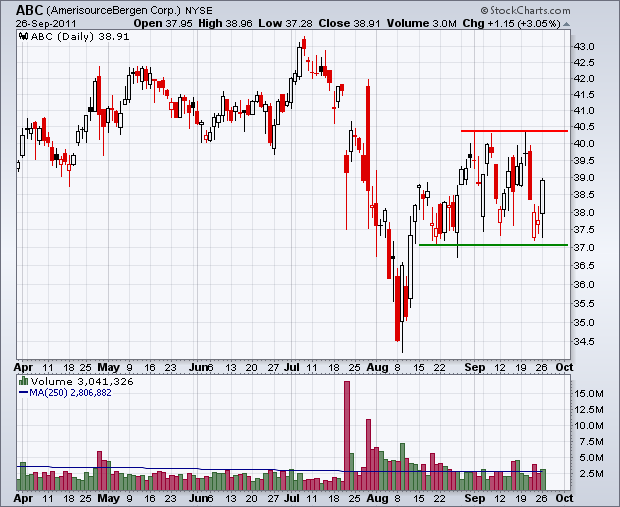
Charts of Interest: ABC, CSCO, ELN, LRCX, NVDA, WM
by Arthur Hill,
Chief Technical Strategist, TrendInvestorPro.com
CSCO Forms Inverse HS Pattern
ELN Breaks Resistance with Volume.
NVDA Declines to 61.80% retracement.
Plus ABC, LRCX and WM
This commentary and charts-of-interest are designed to stimulate thinking. This analysis is not a recommendation to buy, sell, hold or sell short any security (stock ETF or otherwise). We...
READ MORE
MEMBERS ONLY
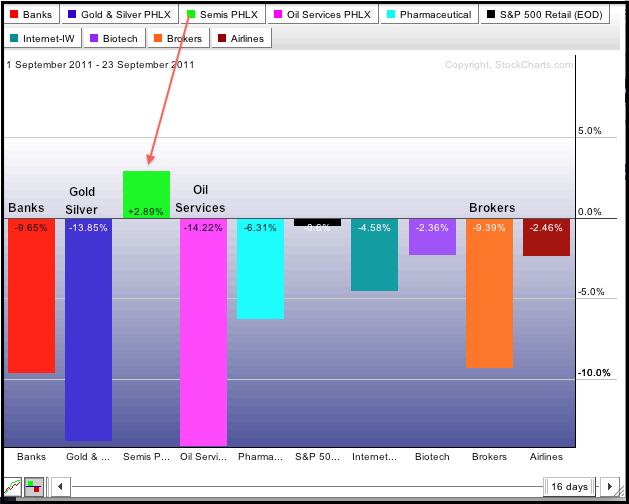
Semis Lead Industry Groups in September
by Arthur Hill,
Chief Technical Strategist, TrendInvestorPro.com
September has not been nice for the broader market, but one key industry group is holding up quite well. The Semiconductor Index ($SOX) actually shows a gain month-to-date and shows relative strength. The S&P Retail Index shows a relatively small loss, as does the Airline Index ($XAL). Banks,...
READ MORE
MEMBERS ONLY
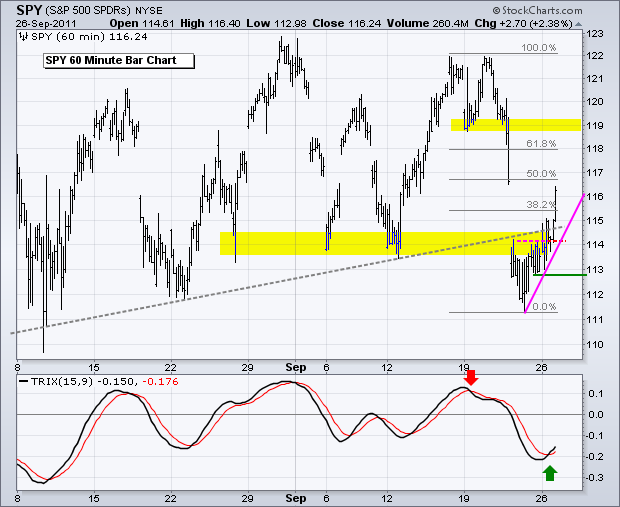
SPY Stalls after Big Support Break
by Arthur Hill,
Chief Technical Strategist, TrendInvestorPro.com
After a broad decline last week, stocks became short-term oversold and consolidated most of Thursday and Friday. This does nothing to change the short-term or medium-term downtrends. Overall, the medium-term trend is clearly down after a break below the September lows. For SPY, this area also marked neckline support for...
READ MORE
MEMBERS ONLY
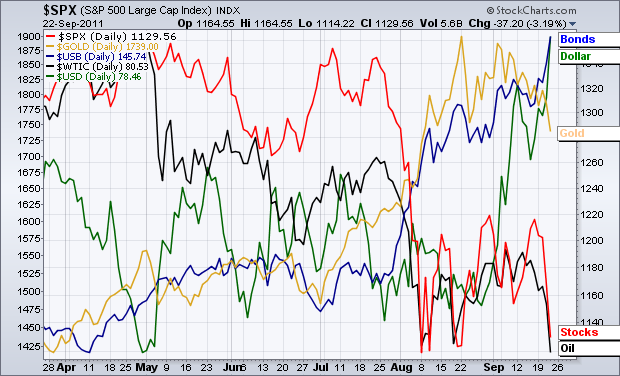
Intermarket Overview Captures Risk-off Environment $GOLD $DOLLAR
by Arthur Hill,
Chief Technical Strategist, TrendInvestorPro.com
The chart below shows the five key intermarket securities with each ranked on the right side of the chart. The US Dollar Index ($USD) and 30-Year US Treasury ($USB) are at the top (strongest), while the S&P 500 and Spot Light Crude ($WTIC) are at the bottom (weakest)...
READ MORE