MEMBERS ONLY
Schizophrenic Stock Market Reverses Bernanke Bounce
by Arthur Hill,
Chief Technical Strategist, TrendInvestorPro.com
Stocks continued their wild ride with a decline that gave back Tuesday's gains. Even so, the major index ETFs remained above Tuesday's lows. In other words, Wednesday's decline is perhaps a test of the lows. Current volatility reminds me of May-July 2010, which was...
READ MORE
MEMBERS ONLY
ESRX Forms Big Hammer after Gap Down
by Arthur Hill,
Chief Technical Strategist, TrendInvestorPro.com
With a big recovery on Tuesday, a number of stocks formed hammers on the price charts. Express Scripts (EXRX) formed a hammer, but has yet to follow through and fill Monday's gap. In other words, the stock is still down for the week. Follow through above the gap...
READ MORE
MEMBERS ONLY
Bernanke Makes Stocks the Only Game in Town
by Arthur Hill,
Chief Technical Strategist, TrendInvestorPro.com
In the FOMC policy statement, Bernanke signaled that the Fed is prepared to leave interest rates near zero until at least mid 2013. Say what? Bernanke must have one heck of a crystal ball to forecast interest rates so far in advance. The prospect of low rates just reinforces the...
READ MORE
MEMBERS ONLY
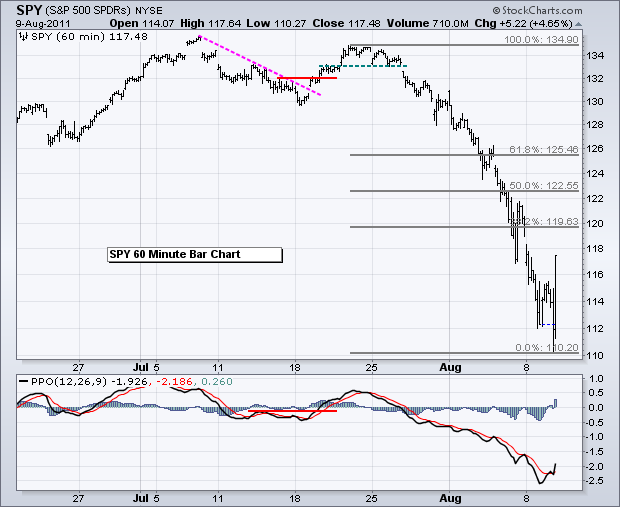
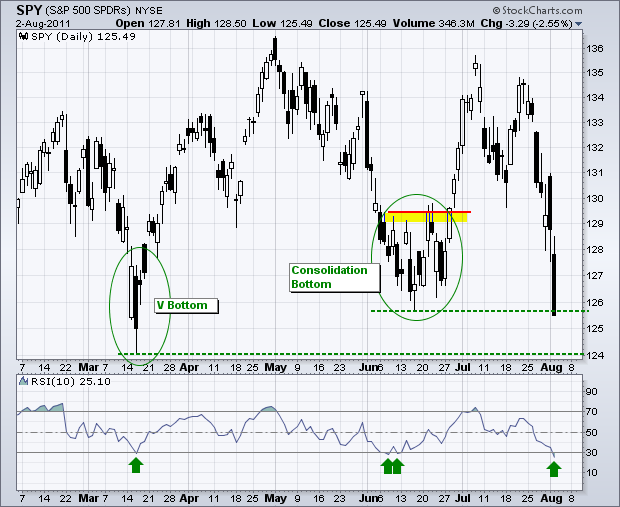
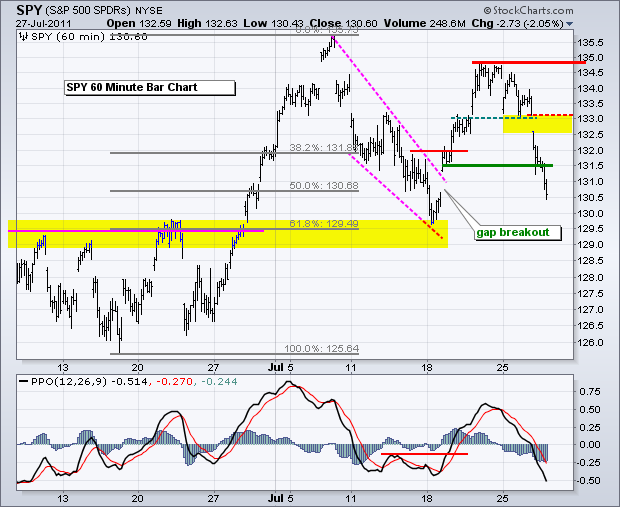
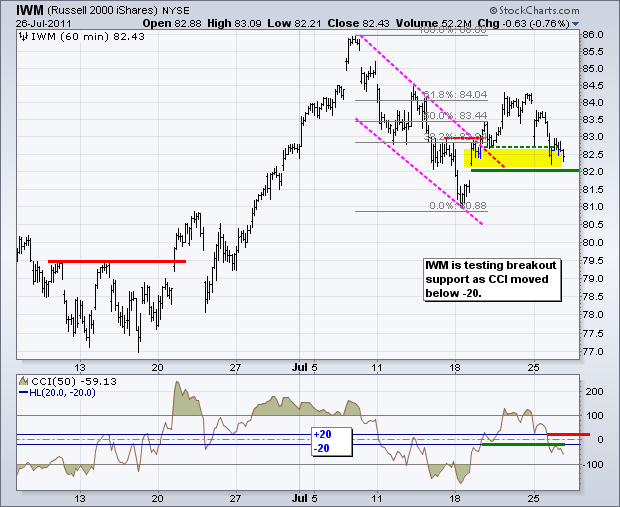
Mini-crash Creates Severe Oversold Conditions for SPY
by Arthur Hill,
Chief Technical Strategist, TrendInvestorPro.com
Stocks opened weak, remained weak and closed weak. The short-term and medium-term trends are clearly down at this point, but the current trends are way oversold after the sharp decline of the last two weeks. Going long at this point is a bottom picking exercise akin to catching a falling...
READ MORE
MEMBERS ONLY
Performance Chart Shows Move to Risk-off Trade
by Arthur Hill,
Chief Technical Strategist, TrendInvestorPro.com
Needless to say, there has been a clear shift in investor sentiment over the last few weeks. In short, money is re-pricing risk. Stocks and commodities, which are viewed as riskier assets, declined over the last two weeks. Bonds and gold, which are viewed as safe-havens, advanced as alternatives. The...
READ MORE
MEMBERS ONLY
S&P Downgrade Triggers Another Sharp Sell Off in Stocks $SPY
by Arthur Hill,
Chief Technical Strategist, TrendInvestorPro.com
As of this writing, the markets are in panic after Standard and Poor's downgraded US debt late Friday. Stocks, bonds and oil are down sharply overnight. Dow futures were down around 274 points at 2AM ET. The Dollar is also down, but the losses are relatively modest. Gold...
READ MORE
MEMBERS ONLY
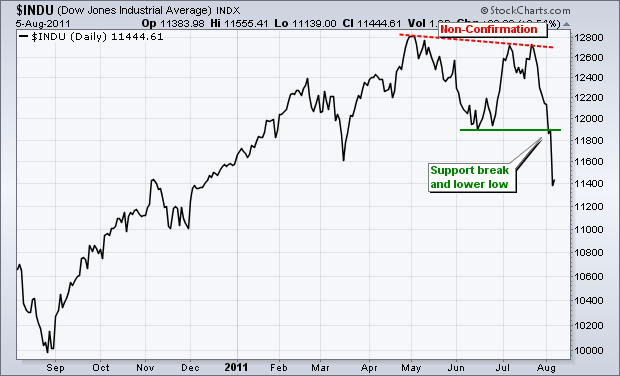
A Dow Theory Non-Confirmation and Sell Signal
by Arthur Hill,
Chief Technical Strategist, TrendInvestorPro.com
Based on the writings of Charles Dow, Dow Theory utilizes the Dow Industrials and Dow Transports to generate buy and sell signals for the broader market. The market trend is up when both forge higher highs. The market trend is down when both forge lower lows. A non-confirmation is present...
READ MORE
MEMBERS ONLY
AMGN Firms with a Harami on Friday
by Arthur Hill,
Chief Technical Strategist, TrendInvestorPro.com
Even though it is just midday, some stocks are showing signs of firmness. Amgen (AMGN) is firming with a Harami taking shape. After a sharp decline on Thursday, the stock opened up and is trading within Thursday's range. A break above Thursday's high would confirm the...
READ MORE
MEMBERS ONLY
Sharp Decline Does Serious Technical Damage
by Arthur Hill,
Chief Technical Strategist, TrendInvestorPro.com
Unsurprisingly, there were several downgrades this week as sharp declines did lots of technical damage. Last week I noted that many indicators were on the verge of turning bearish. Some turned bearish after the close on Friday and the rest followed on Tuesday. The AD Volume Lines both broke below...
READ MORE
MEMBERS ONLY
Flight to Safety Extends Intermarket Trends
by Arthur Hill,
Chief Technical Strategist, TrendInvestorPro.com
With another big move in stocks and bonds, the underlying trends have accelerated even further to become more extended. The only thing we can do at this point is respect the trend. The downtrend is too strong to justify longs and too oversold to justify new shorts. The ability to...
READ MORE
MEMBERS ONLY
SPY and QQQ Form High-Volume Hammers
by Arthur Hill,
Chief Technical Strategist, TrendInvestorPro.com
After becoming oversold on Tuesday, the major index ETFs formed high-volume hammers on Wednesday. Today's report will feature daily charts to get some perspective. SPY dipped below 124 and below its March low, but recovered to close above 126. Volume was the highest since the March low. The...
READ MORE
MEMBERS ONLY
Charts of Interest: EBAY, LSI, ORCL, SIRI, T, VZ
by Arthur Hill,
Chief Technical Strategist, TrendInvestorPro.com
EBAY Firms in Gap Zone.
LSI Breaks Pennant Resistance.
ORCL Tests Support with Inverted Hammer.
Plus SIR, T and VZ.
This commentary and charts-of-interest are designed to stimulate thinking. This analysis is not a recommendation to buy, sell, hold or sell short any security (stock ETF or otherwise). We all...
READ MORE
MEMBERS ONLY
RSI for SPY Becomes Oversold a Fourth Time
by Arthur Hill,
Chief Technical Strategist, TrendInvestorPro.com
10-day RSI for SPY moved below 30 for the fourth time in 2011. I lowered the look-back period from 14 to 10 to increase sensitivity. RSI became oversold in March, June and now August. Oversold does not guarantee a bounce, but it does increase the odds of at least a...
READ MORE
MEMBERS ONLY
Decline Accelerates as Major index ETFs Become Oversold
by Arthur Hill,
Chief Technical Strategist, TrendInvestorPro.com
Stocks are now very oversold with some long-term support levels coming into play. Over the last seven trading days, IWM is down 8.69%, SPY is down 6.75% and QQQ is down 5.59%. 10-day RSI moved below 30 for SPY and IWM, but remains above 30 for QQQ....
READ MORE
MEMBERS ONLY
A Rough Seven Days for All Sectors
by Arthur Hill,
Chief Technical Strategist, TrendInvestorPro.com
The Sector Market Carpet provides a color-coded display of the last seven trading days for the S&P 500 sectors. It is mostlly red as all sectors are down. Stocks holding up the best are shown with green or white-ish squares. Three of the five gainers come from the...
READ MORE
MEMBERS ONLY
Pop and Drop Keeps Bears in Control of Short-Term
by Arthur Hill,
Chief Technical Strategist, TrendInvestorPro.com
Trading turned quite volatile on Monday as stocks opened sharply higher, moved sharply lower and then recovered somewhat. Despite all this pushing and shoving, the major index ETFs closed slightly lower and all sector SPDRs were down for the day. Stocks did not follow through on the strong open and...
READ MORE
MEMBERS ONLY
Charts of Interest: ADM, ALK, AMX, BK, DOW, FITB
by Arthur Hill,
Chief Technical Strategist, TrendInvestorPro.com
ADM Forms Inverted Hammer within Steep Flag.
DOW Bucks the Trend with Small Gain.
FITB Forms Bull Flag.
Plus ALK, AMX, BK....
READ MORE
MEMBERS ONLY
Agriculture ETF Forms Wedge within a Wedge
by Arthur Hill,
Chief Technical Strategist, TrendInvestorPro.com
With a decline the last five months, the Agriculture ETF (DBA) formed a falling wedge that extends back to March. The May-July highs mark key resistance just above 33.25. After a surge in late June and early July, a smaller falling wedge took shape the last three weeks. Look...
READ MORE
MEMBERS ONLY
Stocks Poised for Oversold Bounce and Relief Rally
by Arthur Hill,
Chief Technical Strategist, TrendInvestorPro.com
Unsurprisingly, Congress and the White House struck an 11th hour deal on the debt ceiling. Stock futures are trading higher with the Dow poised to open some 100 points up. Oil is also higher, but bonds, gold and the Dollar are lower (±5AM ET). Technically, stocks were oversold after a...
READ MORE
MEMBERS ONLY
Nasdaq McClellan Summation Index Turns Down at Zero Line
by Arthur Hill,
Chief Technical Strategist, TrendInvestorPro.com
With another bout of selling pressure this week, the Nasdaq McClellan Summation Index reversed at the zero line and moved back below -100. Notice that this breadth indicator has been largely negative since mid March. You can read more on the McClellan Oscillator and Summation index in our ChartSchool.
Click...
READ MORE
MEMBERS ONLY
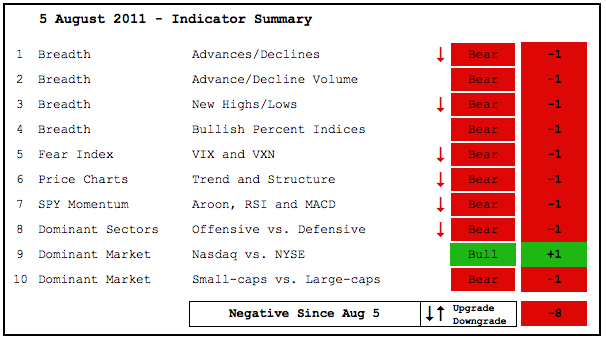
Downgrades Push Indicator Summary to Zero
by Arthur Hill,
Chief Technical Strategist, TrendInvestorPro.com
With a slew of downgrades this week, the Indicator Summary now stands at zero, which is a neutral reading. There are several neutral scores this week because many indicator groups are split or on the verge of turning bearish. For example, the Trend and Structure for the Price Charts is...
READ MORE
MEMBERS ONLY
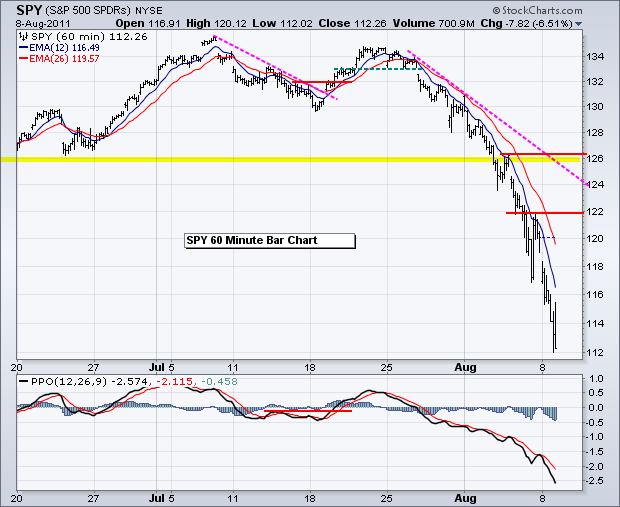
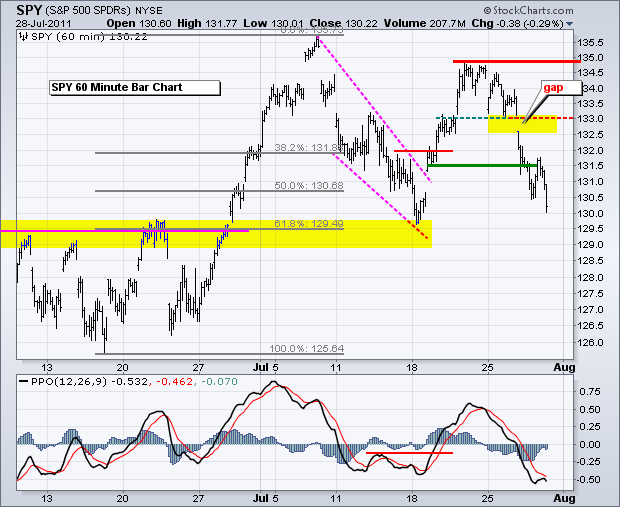
SPY and IWM Stall After Short-Term Support Breaks
by Arthur Hill,
Chief Technical Strategist, TrendInvestorPro.com
Stocks remained under pressure as early strength gave way to afternoon weakness. QQQ finished with a small gain, but the other major index ETFs finished with small losses. With little real movement on Thursday, nothing has changed on the 60-minute chart. IWM was the first to break support and turn...
READ MORE
MEMBERS ONLY
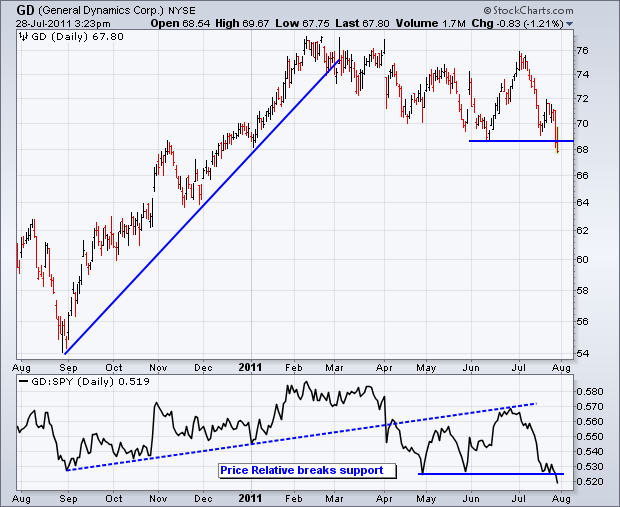
General Dynamics Breaks Chart Support and Relative Support
by Arthur Hill,
Chief Technical Strategist, TrendInvestorPro.com
General Dynamics (GD) broke below its June low with a sharp decline the last two days. Also notice that the Price Relative (GD:SPY Ratio) broke support. GD is showing both absolute and relative weakness.
Click this image for a live chart...
READ MORE
MEMBERS ONLY
IWM and SPY Break Short Term Supports with Broad Decline
by Arthur Hill,
Chief Technical Strategist, TrendInvestorPro.com
Stocks moved sharply lower with a broad sell off that rocked all boats. All nine sectors were down. Small-caps and mid-caps led the way lower with declines in excess of 2%. Breadth plunged with the NYSE Net Advances Ratio reaching -.81 and the Nasdaq Net Advancing Volume Ratio hitting...
READ MORE
MEMBERS ONLY
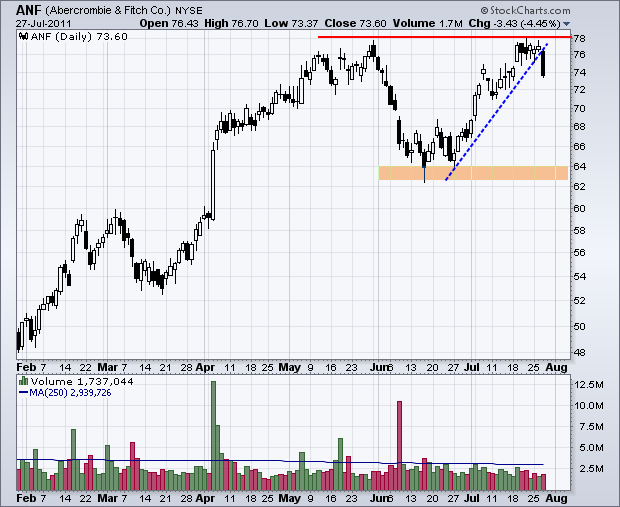
Charts of Interest: ANF, AVP, BBBY, DIS, PLCE, WMT
by Arthur Hill,
Chief Technical Strategist, TrendInvestorPro.com
ANF Fails at Resistance with Long Black Candle.
DIS Hits Resistance at Broken Support.
PLCE Retraces 50% with Rising Wedge.
Plus AVP, BBBY and WMT.
This commentary and charts-of-interest are designed to stimulate thinking. This analysis is not a recommendation to buy, sell, hold or sell short any security (stock...
READ MORE
MEMBERS ONLY
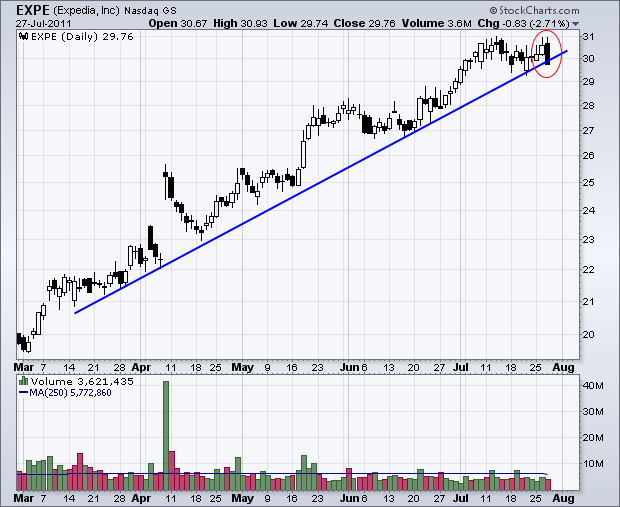
Expedia Forms Bearish Engulfing Pattern
by Arthur Hill,
Chief Technical Strategist, TrendInvestorPro.com
Expedia has been on a tear the last few months with 50+ percent advance since February. The stock has yet to correct, but a bearish engulfing pattern hints at a possible short-term reversal. More candlestick patterns can be found on the pre-defined scans page.
Click this image for a live...
READ MORE
MEMBERS ONLY
IWM Remains Relatively Weak as QQQ Remains Strong
by Arthur Hill,
Chief Technical Strategist, TrendInvestorPro.com
Relative weakness in small-caps remains a concern for the stock market. While the Nasdaq 100 ETF
(QQQ) is holding up fine, the Russell 2000 ETF (IWM) is already in its support zone with declines over the
last two days. The first chart shows IWM gapping down on Monday. This gap...
READ MORE
MEMBERS ONLY
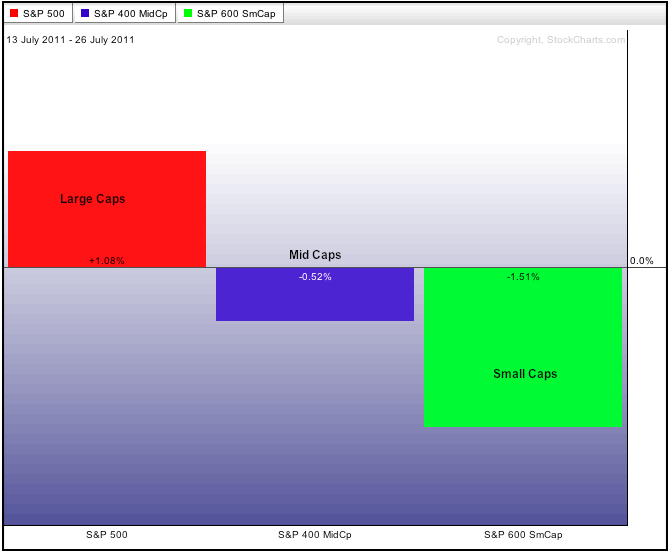
Small-Caps and Mid-Caps Lagging the Last 10 Days $MID $SML
by Arthur Hill,
Chief Technical Strategist, TrendInvestorPro.com
While the Nasdaq 100 continues to move higher and the S&P 500 shows gains the last 10 days, the PerfChart below shows that small and mid caps are starting to suffer. The S&P 500 is up just over 1% snce July 13th, but the S&...
READ MORE
MEMBERS ONLY
Small-caps Underperform and the Dollar Plummets
by Arthur Hill,
Chief Technical Strategist, TrendInvestorPro.com
The debt duel in Washington is weighing on stocks, bonds and the Dollar. Techs and QQQ are holding up the best, while small-caps and IWM are faring the worst. This debt duel will soon turn from rumor to news (on or before August 2nd). This news, whatever the outcome, could...
READ MORE
MEMBERS ONLY
Charts of Interest: AMGN, AMX, ARMH, DOW, EMR, KEY, SYMC
by Arthur Hill,
Chief Technical Strategist, TrendInvestorPro.com
AMGN Hits 61.80% Retracement.
EMR Forms Wedge Correction.
KEY Challenges Resistance with Volume Surge.
Plus AMX, DOW, EMR and SYMC.
This commentary and charts-of-interest are designed to stimulate thinking. This analysis is not a recommendation to buy, sell, hold or sell short any security (stock ETF or otherwise). We...
READ MORE
MEMBERS ONLY
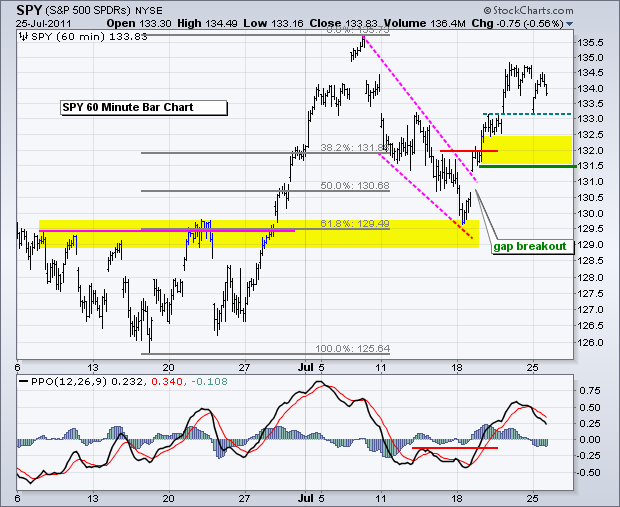
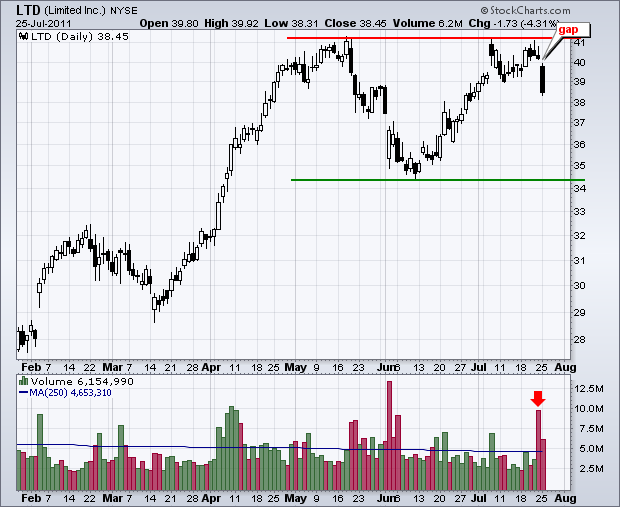
LTD Gaps From Resistance on High Volume
by Arthur Hill,
Chief Technical Strategist, TrendInvestorPro.com
After meeting resistance from the May high twice this month, Limited (LTD) gapped down on big volume Monday. This gap should be considered bearish until proven otherwise with a move back above the gap zone.
Click this image for a live chart...
READ MORE
MEMBERS ONLY
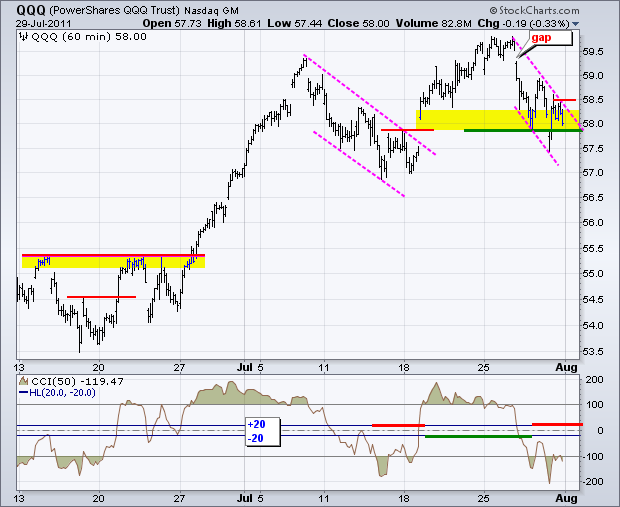
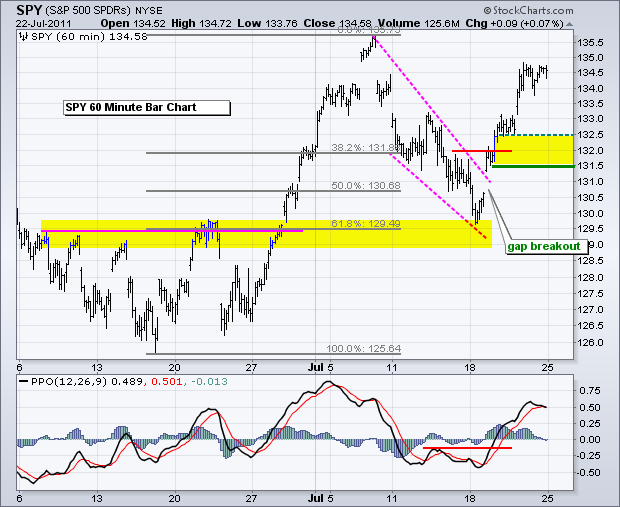
Breakouts in QQQ and SPY Get First Test as Gold Surges
by Arthur Hill,
Chief Technical Strategist, TrendInvestorPro.com
With pre-market stock futures pointing to a sharply lower open, last week's breakouts will get their first test. To recap: the major index ETFs broke channel resistance with gaps and surges on Tuesday. These breakouts held as the gains extended into Friday. QQQ moved above its early July...
READ MORE
MEMBERS ONLY
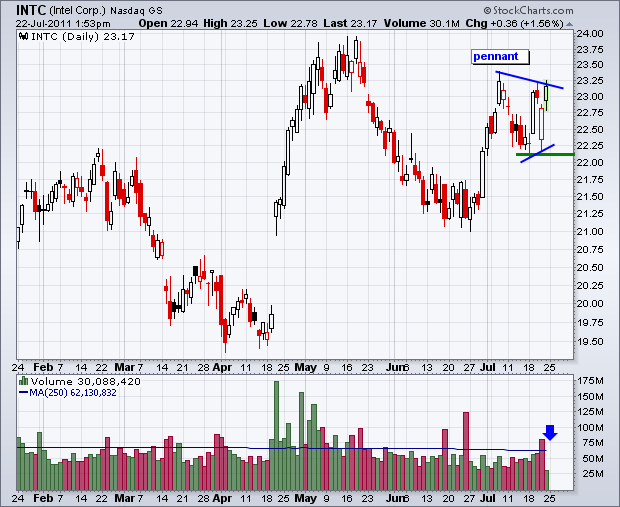
Intel Challenges Pennant Resistance on Light Volume
by Arthur Hill,
Chief Technical Strategist, TrendInvestorPro.com
Intel (INTC) is making waves today with an attempt to break pennant resistance. Notice how the stock surged from 21 to 23.25 and then consolidated the last few weeks. A breakout would signal a continuation higher, but low volume detracts from today's move.
Click this image for...
READ MORE
MEMBERS ONLY
Price Charts Remain Strong Despite Some Internal Weakness
by Arthur Hill,
Chief Technical Strategist, TrendInvestorPro.com
Even though the major index ETFs have yet to break down or show serious weakness, chartists should stay vigilant because the market is not firing on all cylinders right now. There were three downgrades this week, but the indicator summary remains positive overall. The AD Lines remain split with the...
READ MORE
MEMBERS ONLY
Euro Breaks out as Breakouts in QQQ and SPY Extend
by Arthur Hill,
Chief Technical Strategist, TrendInvestorPro.com
Stocks extended their gains with another broad rally that lifted all sectors. Seven of the nine sectors were up more than 1%. The Finance SPDR (XLF) led the way with a 2.40% gain. On the 60-minute charts, QQQ remains the strongest as it challenges its July (and 2011) highs....
READ MORE
MEMBERS ONLY
XLU Breaks Cup-with-handle Resistance
by Arthur Hill,
Chief Technical Strategist, TrendInvestorPro.com
With a big surge over the last three days, the Utilities SPDR (XLU) is breaking rim resistance from a cup-with-handle pattern. These bullish continuation patterns were popularized by William O'Neal, founder of Daily Graphs and IBD. Also notice that the July pullback looks like a falling flag.
Click...
READ MORE
MEMBERS ONLY
Gaps and Breakouts Holding for SPY and QQQ
by Arthur Hill,
Chief Technical Strategist, TrendInvestorPro.com
Trading was mixed on Wednesday with the major index ETFs finishing slightly negative. This looks like a little buy-the-rumor and sell-the-news, especially for Apple, which opened above 396 and closed below 387. The sectors were mixed with the Finance SPDR (XLF) sporting the biggest gain (+1.14%). This may be...
READ MORE
MEMBERS ONLY
Charts of Interest: AEO, DANG, IP, STJ, SVU, WFT
by Arthur Hill,
Chief Technical Strategist, TrendInvestorPro.com
AEO Consolidates after Surge.
DANG Forms Hammer Near June Lows.
STJ Traces out High Volume Bullish Engulfing.
Plus IP, SVU, WFT
This commentary and charts-of-interest are designed to stimulate thinking. This analysis is not a recommendation to buy, sell, hold or sell short any security (stock ETF or otherwise). We...
READ MORE
MEMBERS ONLY
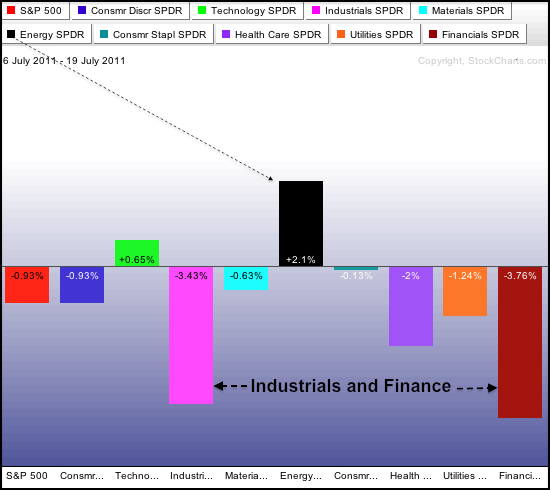
Energy SPDR Leads Sectors over the last 10 days
by Arthur Hill,
Chief Technical Strategist, TrendInvestorPro.com
As this sector PerfChart shows, the Energy SPDR (XLE) is the standout performer over the last 10 trading days with a 2.1% gain. In contrast, the S&P 500 is down around 1% during this timeframe. Industrials and finance have weighed on the S&P 500 the...
READ MORE
MEMBERS ONLY
Tech Sector Powers Gaps and Breakouts for QQQ and SPY
by Arthur Hill,
Chief Technical Strategist, TrendInvestorPro.com
Led by the technology and consumer discretionary sectors, stocks surged on Tuesday and the major index ETFs broke channel resistance. All nine sectors were up with seven of nine up more than 1%. Tuesday's trading started strong with a gap and finished strong with a close near the...
READ MORE