MEMBERS ONLY
SPY and IWM Stall After Short-Term Support Breaks
by Arthur Hill,
Chief Technical Strategist, TrendInvestorPro.com
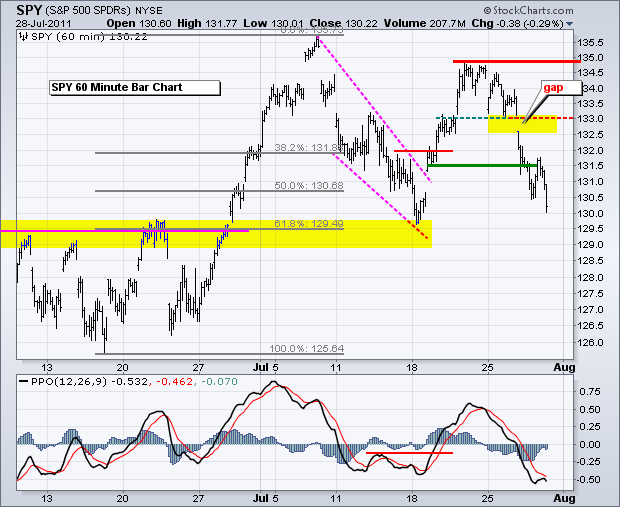
Stocks remained under pressure as early strength gave way to afternoon weakness. QQQ finished with a small gain, but the other major index ETFs finished with small losses. With little real movement on Thursday, nothing has changed on the 60-minute chart. IWM was the first to break support and...
READ MORE
MEMBERS ONLY
General Dynamics Breaks Chart Support and Relative Support
by Arthur Hill,
Chief Technical Strategist, TrendInvestorPro.com
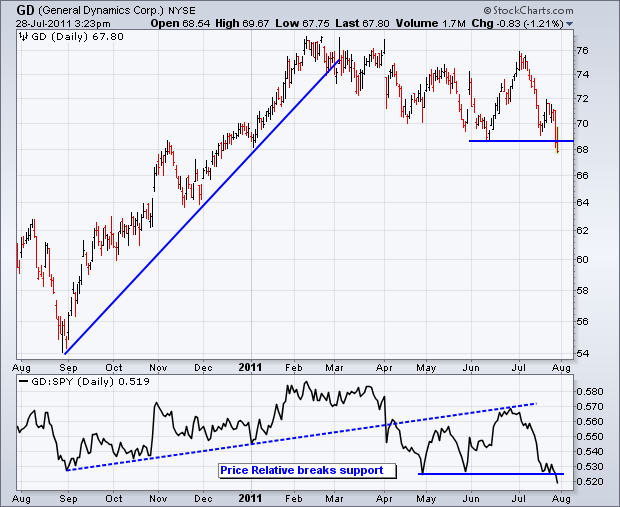
General Dynamics (GD) broke below its June low with a sharp decline the last two days. Also notice that the Price Relative (GD:SPY Ratio) broke support. GD is showing both absolute and relative weakness.
Click this image for a live chart...
READ MORE
MEMBERS ONLY
IWM and SPY Break Short Term Supports with Broad Decline
by Arthur Hill,
Chief Technical Strategist, TrendInvestorPro.com
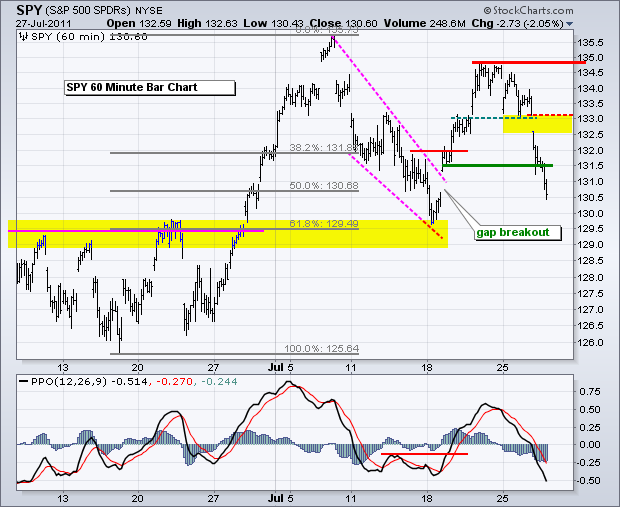
Stocks moved sharply lower with a broad sell off that rocked all boats. All nine sectors were down. Small-caps and mid-caps led the way lower with declines in excess of 2%. Breadth plunged with the NYSE Net Advances Ratio reaching -.81 and the Nasdaq Net Advancing Volume Ratio...
READ MORE
MEMBERS ONLY
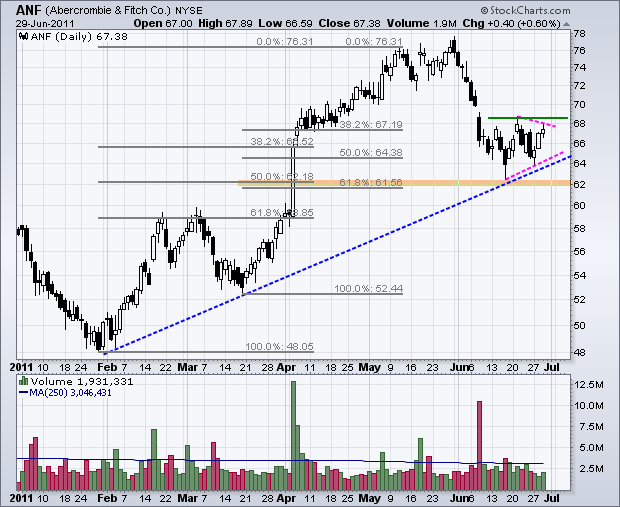
Charts of Interest: ANF, AVP, BBBY, DIS, PLCE, WMT
by Arthur Hill,
Chief Technical Strategist, TrendInvestorPro.com
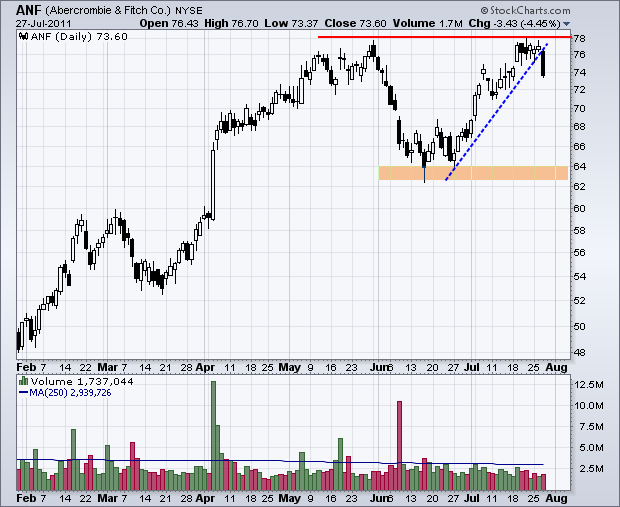
ANF Fails at Resistance with Long Black Candle.
DIS Hits Resistance at Broken Support.
PLCE Retraces 50% with Rising Wedge.
Plus AVP, BBBY and WMT.
This commentary and charts-of-interest are designed to stimulate thinking. This analysis is not a recommendation to buy, sell, hold or sell short any...
READ MORE
MEMBERS ONLY
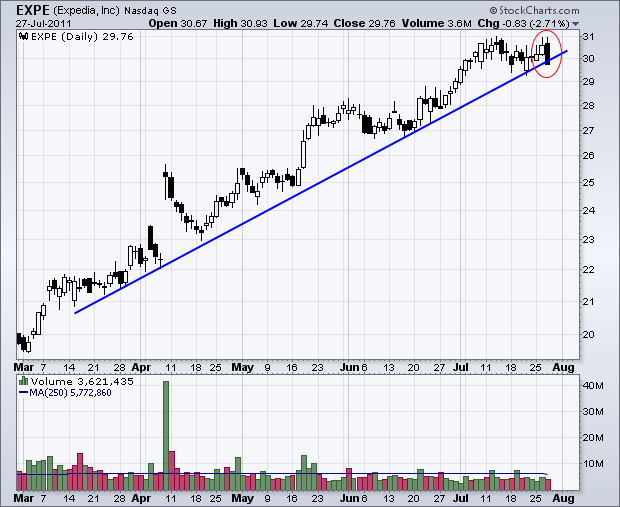
Expedia Forms Bearish Engulfing Pattern
by Arthur Hill,
Chief Technical Strategist, TrendInvestorPro.com
Expedia has been on a tear the last few months with 50+ percent advance since February. The stock has yet to correct, but a bearish engulfing pattern hints at a possible short-term reversal. More candlestick patterns can be found on the pre-defined scans page.
Click this image for...
READ MORE
MEMBERS ONLY
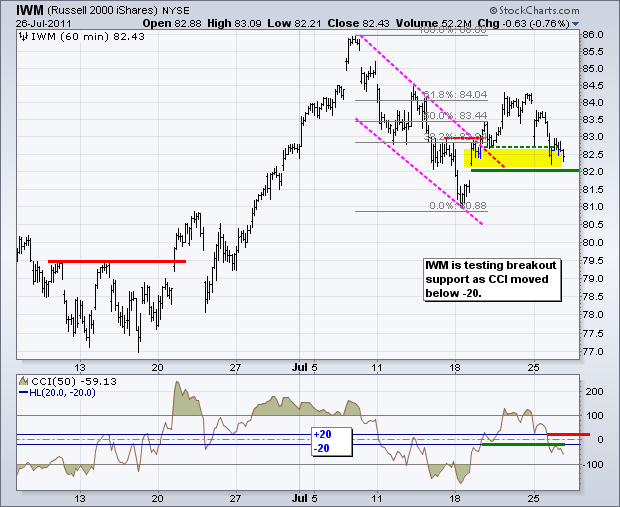
IWM Remains Relatively Weak as QQQ Remains Strong
by Arthur Hill,
Chief Technical Strategist, TrendInvestorPro.com
Relative weakness in small-caps remains a concern for the stock market. While the Nasdaq 100 ETF
(QQQ) is holding up fine, the Russell 2000 ETF (IWM) is already in its support zone with declines over the
last two days. The first chart shows IWM gapping down on Monday. This...
READ MORE
MEMBERS ONLY
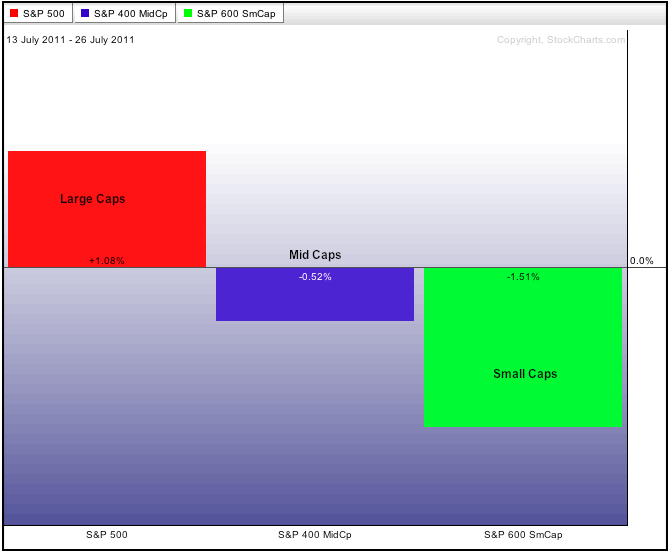
Small-Caps and Mid-Caps Lagging the Last 10 Days $MID $SML
by Arthur Hill,
Chief Technical Strategist, TrendInvestorPro.com
While the Nasdaq 100 continues to move higher and the S&P 500 shows gains the last 10 days, the PerfChart below shows that small and mid caps are starting to suffer. The S&P 500 is up just over 1% snce July 13th, but the S&...
READ MORE
MEMBERS ONLY
Small-caps Underperform and the Dollar Plummets
by Arthur Hill,
Chief Technical Strategist, TrendInvestorPro.com
The debt duel in Washington is weighing on stocks, bonds and the Dollar. Techs and QQQ are holding up the best, while small-caps and IWM are faring the worst. This debt duel will soon turn from rumor to news (on or before August 2nd). This news, whatever the outcome,...
READ MORE
MEMBERS ONLY
Charts of Interest: AMGN, AMX, ARMH, DOW, EMR, KEY, SYMC
by Arthur Hill,
Chief Technical Strategist, TrendInvestorPro.com
AMGN Hits 61.80% Retracement.
EMR Forms Wedge Correction.
KEY Challenges Resistance with Volume Surge.
Plus AMX, DOW, EMR and SYMC.
This commentary and charts-of-interest are designed to stimulate thinking. This analysis is not a recommendation to buy, sell, hold or sell short any security (stock ETF or...
READ MORE
MEMBERS ONLY
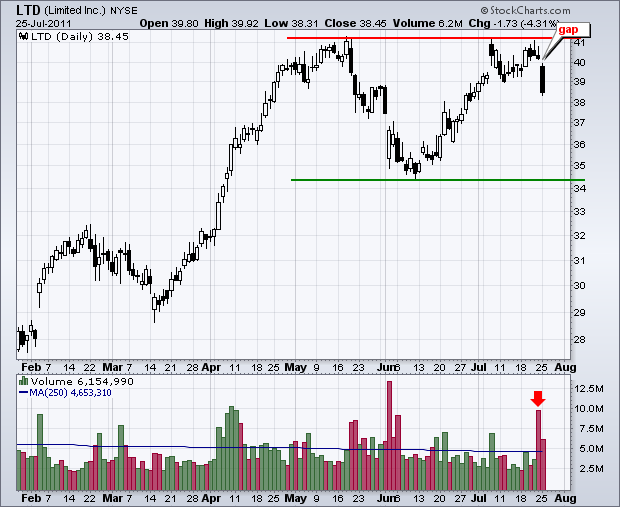
LTD Gaps From Resistance on High Volume
by Arthur Hill,
Chief Technical Strategist, TrendInvestorPro.com
After meeting resistance from the May high twice this month, Limited (LTD) gapped down on big volume Monday. This gap should be considered bearish until proven otherwise with a move back above the gap zone.
Click this image for a live chart...
READ MORE
MEMBERS ONLY
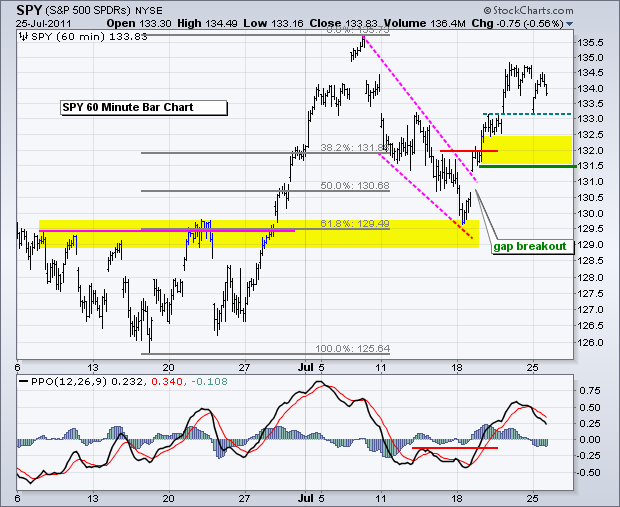
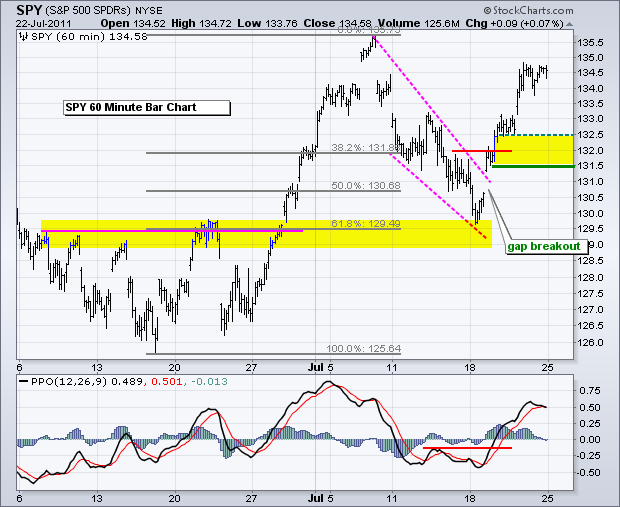
Breakouts in QQQ and SPY Get First Test as Gold Surges
by Arthur Hill,
Chief Technical Strategist, TrendInvestorPro.com
With pre-market stock futures pointing to a sharply lower open, last week's breakouts will get their first test. To recap: the major index ETFs broke channel resistance with gaps and surges on Tuesday. These breakouts held as the gains extended into Friday. QQQ moved above its early...
READ MORE
MEMBERS ONLY
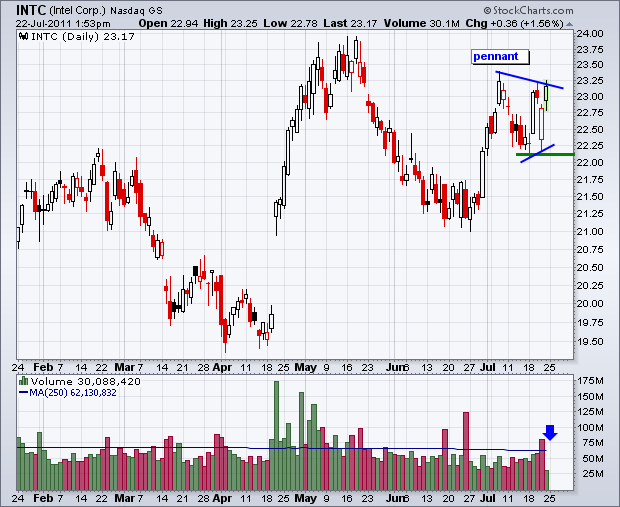
Intel Challenges Pennant Resistance on Light Volume
by Arthur Hill,
Chief Technical Strategist, TrendInvestorPro.com
Intel (INTC) is making waves today with an attempt to break pennant resistance. Notice how the stock surged from 21 to 23.25 and then consolidated the last few weeks. A breakout would signal a continuation higher, but low volume detracts from today's move.
Click this image for...
READ MORE
MEMBERS ONLY
Price Charts Remain Strong Despite Some Internal Weakness
by Arthur Hill,
Chief Technical Strategist, TrendInvestorPro.com
Even though the major index ETFs have yet to break down or show serious weakness, chartists should stay vigilant because the market is not firing on all cylinders right now. There were three downgrades this week, but the indicator summary remains positive overall. The AD Lines remain split with the...
READ MORE
MEMBERS ONLY
Euro Breaks out as Breakouts in QQQ and SPY Extend
by Arthur Hill,
Chief Technical Strategist, TrendInvestorPro.com
Stocks extended their gains with another broad rally that lifted all sectors. Seven of the nine sectors were up more than 1%. The Finance SPDR (XLF) led the way with a 2.40% gain. On the 60-minute charts, QQQ remains the strongest as it challenges its July (and 2011)...
READ MORE
MEMBERS ONLY
XLU Breaks Cup-with-handle Resistance
by Arthur Hill,
Chief Technical Strategist, TrendInvestorPro.com
With a big surge over the last three days, the Utilities SPDR (XLU) is breaking rim resistance from a cup-with-handle pattern. These bullish continuation patterns were popularized by William O'Neal, founder of Daily Graphs and IBD. Also notice that the July pullback looks like a falling...
READ MORE
MEMBERS ONLY
Gaps and Breakouts Holding for SPY and QQQ
by Arthur Hill,
Chief Technical Strategist, TrendInvestorPro.com
Trading was mixed on Wednesday with the major index ETFs finishing slightly negative. This looks like a little buy-the-rumor and sell-the-news, especially for Apple, which opened above 396 and closed below 387. The sectors were mixed with the Finance SPDR (XLF) sporting the biggest gain (+1....
READ MORE
MEMBERS ONLY
Charts of Interest: AEO, DANG, IP, STJ, SVU, WFT
by Arthur Hill,
Chief Technical Strategist, TrendInvestorPro.com
AEO Consolidates after Surge.
DANG Forms Hammer Near June Lows.
STJ Traces out High Volume Bullish Engulfing.
Plus IP, SVU, WFT
This commentary and charts-of-interest are designed to stimulate thinking. This analysis is not a recommendation to buy, sell, hold or sell short any security (stock ETF or...
READ MORE
MEMBERS ONLY
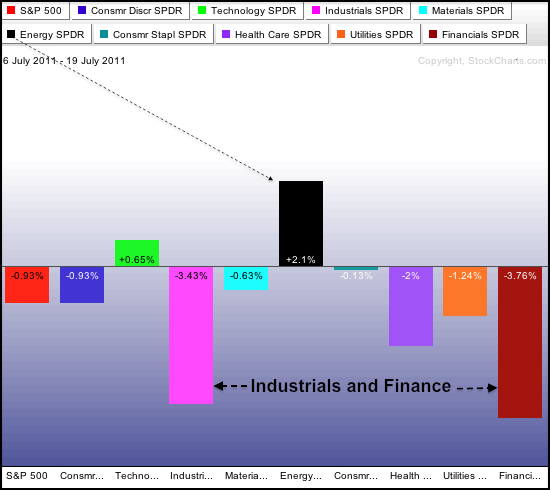
Energy SPDR Leads Sectors over the last 10 days
by Arthur Hill,
Chief Technical Strategist, TrendInvestorPro.com
As this sector PerfChart shows, the Energy SPDR (XLE) is the standout performer over the last 10 trading days with a 2.1% gain. In contrast, the S&P 500 is down around 1% during this timeframe. Industrials and finance have weighed on the S&P 500 the...
READ MORE
MEMBERS ONLY
Tech Sector Powers Gaps and Breakouts for QQQ and SPY
by Arthur Hill,
Chief Technical Strategist, TrendInvestorPro.com
Led by the technology and consumer discretionary sectors, stocks surged on Tuesday and the major index ETFs broke channel resistance. All nine sectors were up with seven of nine up more than 1%. Tuesday's trading started strong with a gap and finished strong with a close near the...
READ MORE
MEMBERS ONLY
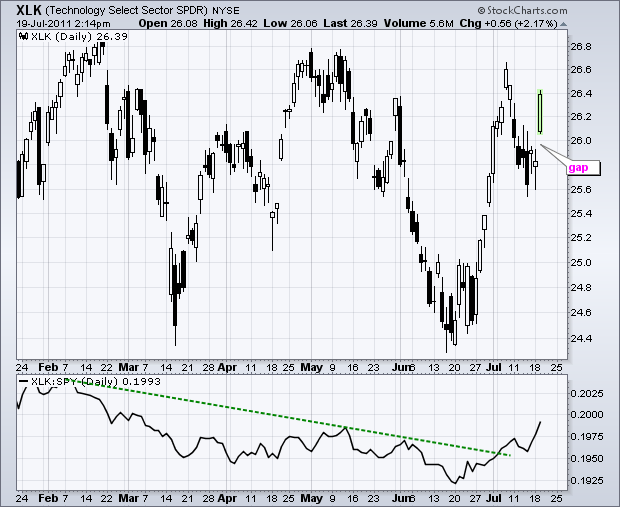
Tech SPDR Gaps Higher and Starts to Lead
by Arthur Hill,
Chief Technical Strategist, TrendInvestorPro.com
After firming for a few days, the Technology ETF (XLK) gapped higher on Wednesday with an open above 26. This is a big gap that is bullish as long as it holds. In the indicator window, the Price Relative turned up as XLK starts to outperform the S&P...
READ MORE
MEMBERS ONLY
QQQ Firms as Short-term Corrections Extend
by Arthur Hill,
Chief Technical Strategist, TrendInvestorPro.com
After a big surge from mid June to early July, stocks corrected with pullbacks over the last seven trading days. SPY and IWM were weighed down by weakness in money-center banks and regional banks on Monday, but DIA and QQQ held up relatively well. In fact, QQQ finished with...
READ MORE
MEMBERS ONLY
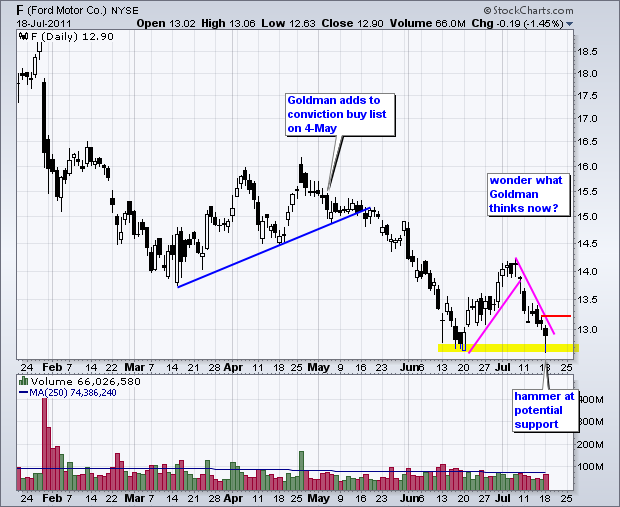
Chart of Interest: F, JPM, MOS, MRVL, SD
by Arthur Hill,
Chief Technical Strategist, TrendInvestorPro.com
F Forms Hammer Near Prior Low. JPM Establishes Clear Resistance Hurdle. SD Surges on Good Volume. Plus MOS and MRVL.
This commentary and charts-of-interest are designed to stimulate thinking. This analysis is not a recommendation to buy, sell, hold or sell short any security (stock ETF or otherwise)...
READ MORE
MEMBERS ONLY
French CAC 40 Index Breaks March Low
by Arthur Hill,
Chief Technical Strategist, TrendInvestorPro.com
With a plunge over the last seven days, the French CAC Index ($CAC) broke below its March low and reached its lowest point of the year. Also notice that the index formed lower highs in May and early July. The breakdown reflects the current debt problems in the Euro zone....
READ MORE
MEMBERS ONLY
Upgrades Strengthen Indicator Summary
by Arthur Hill,
Chief Technical Strategist, TrendInvestorPro.com
With several more upgrades, the indicator summary moved from +2 to +9 over the last two weeks. Nine of the ten indicator groups are positive or bullish. The AD Lines remain neutral because of a split decision. The Nasdaq AD Line is still in a downtrend, while the NYSE AD...
READ MORE
MEMBERS ONLY
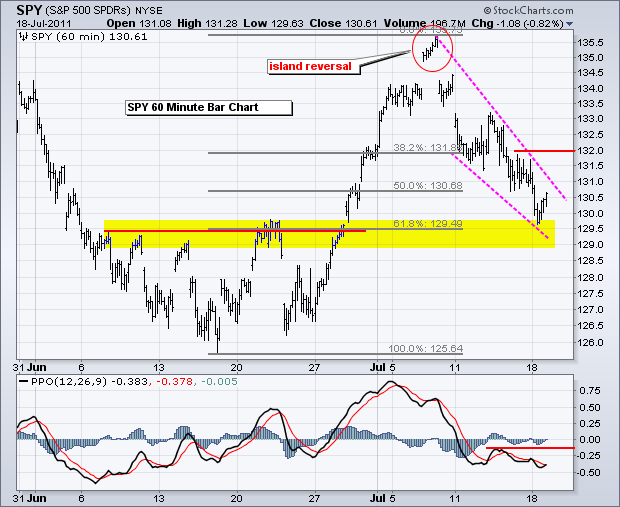
SPY Corrects to Retracement Zone after Big Surge
by Arthur Hill,
Chief Technical Strategist, TrendInvestorPro.com
The decline in stocks over the last six days looks like a correction after a sharp advance. The major index ETFs moved sharply higher from mid June to early July. From the June 15th low to the July 7th high, SPY was up over 6%, while QQQ and IWM were...
READ MORE
MEMBERS ONLY
Revisiting the 2000 S&P 500 Reversal
by Arthur Hill,
Chief Technical Strategist, TrendInvestorPro.com
The 2000 market top evolved over a 12 month period as the S&P 500 traded between 1325 and 1550. The index broke this range at the end of 2000 and continued lower in early 2001. Notice that broken support turned into resistance and the throwback bounce retraced 50%...
READ MORE
MEMBERS ONLY
Revisiting the 2007 S&P 500 Reversal
by Arthur Hill,
Chief Technical Strategist, TrendInvestorPro.com
Although no two market tops are the same, we can get an idea of what a major reversal looks like by examining past reversals. The 2007 top evolved over a 9 month period. There were clear support breaks at 1425 and 1375. RSI broke its bull zone (40 to 80)...
READ MORE
MEMBERS ONLY
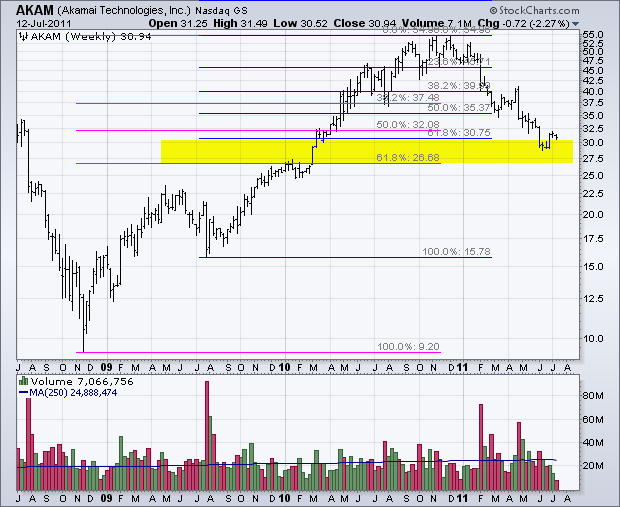
AKAM Hits Fibonacci Cluster Zone
by Arthur Hill,
Chief Technical Strategist, TrendInvestorPro.com
The Fibonacci Retracements Tool can be used to identify Fibonacci levels to estimate support, resistance or turning points. When there is more than one advance, chartists can apply this tool to both moves and look for a cluster zone. The chart for Akamai shows the Fibonacci Retracements Tool extending from...
READ MORE
MEMBERS ONLY
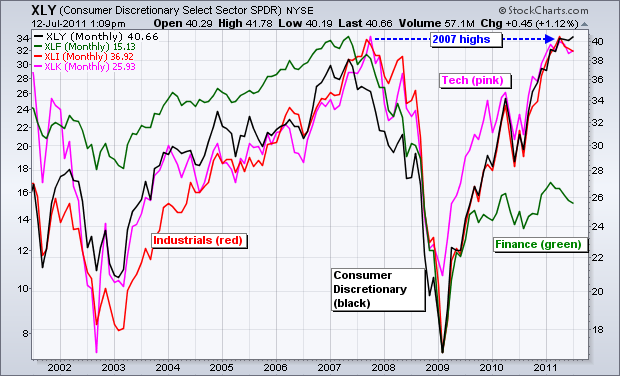
Finance Sector is the Big Drag
by Arthur Hill,
Chief Technical Strategist, TrendInvestorPro.com
The advance since the March lows has been enough to power the Consumer Discretionary SPDR (XLY) past its 2007 high. The Industrials SPDR (XLI) and the Technology ETF (XLK) both met resistance at their 2007 highs over the last few months. The Finance SPDR (XLF) remains the big laggard as...
READ MORE
MEMBERS ONLY
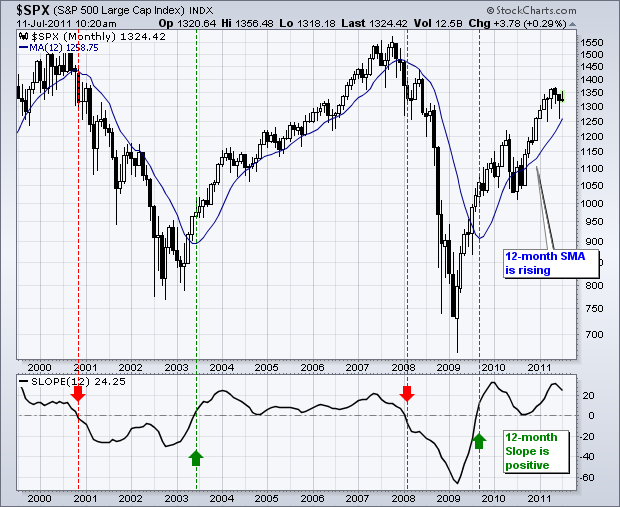
12 month Slope Indicator remains Positive for S&P 500
by Arthur Hill,
Chief Technical Strategist, TrendInvestorPro.com
Taking a big step back to look at the big picture, the 12-month Slope indicator for the S&P 500 turned positive in September 2009 and remains positive. While this indicator does not pick exact tops or bottoms, it gives us a good idea of the long-term...
READ MORE
MEMBERS ONLY
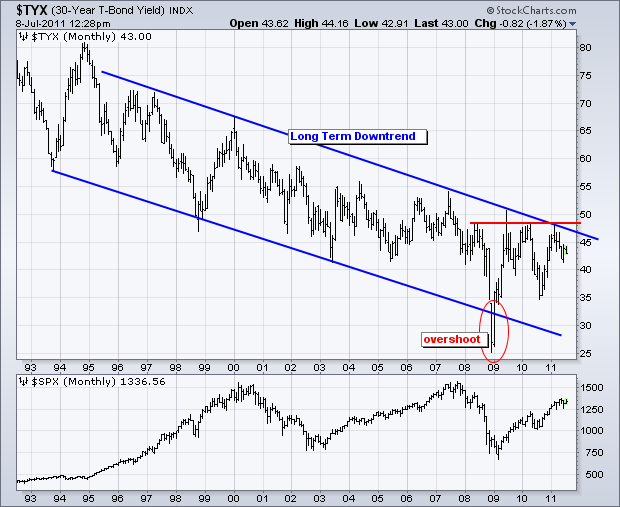
10-year Treasury Yield Backs off Long-term Resistance
by Arthur Hill,
Chief Technical Strategist, TrendInvestorPro.com
The 10-year Treasury Yield ($TNX) remains in a long-term downtrend that is dominated by a falling channel. The upper trendline has been touched at least four times since the mid 90s. More recently, the 10-year Treasury Yield hit resistance around 48.50 at least three times since...
READ MORE
MEMBERS ONLY
A Massive Triangle Takes Shape for the Home Construction iShares
by Arthur Hill,
Chief Technical Strategist, TrendInvestorPro.com
The Home Construction iShares (ITB) has gone nowhere since August 2009. After first crossing back above 12.75 in early August 2009, the ETF has meandered above/below this level the last 23 months. On the right half of the range, a large Symmetrical Triangle is taking shape. A break...
READ MORE
MEMBERS ONLY
Spanish IBEX Index Hits Major Resistance Zone
by Arthur Hill,
Chief Technical Strategist, TrendInvestorPro.com
The Spain Bolsa de Madrid IBEX 35 Index ($IBEX) hit a major resistance zone around 11000. Notice that the index has been turned back near this level since July 2010 (one year). A breakout is needed to revive the bulls here and build confidence in Europe. RSI confirms resistance as...
READ MORE
MEMBERS ONLY
Dow Industrials Remains Well below 2007 High
by Arthur Hill,
Chief Technical Strategist, TrendInvestorPro.com
The chart below shows the 23-day SMA for the Dow Industrials. There are around 23 trading days per month and this represents a rolling monthly average. It also smooths daily volatility. The March 2009 low was around 10% below the March 2003 low and the July 2011 high was...
READ MORE
MEMBERS ONLY
Dollar and S&P 500 Continue Negative Correlation
by Arthur Hill,
Chief Technical Strategist, TrendInvestorPro.com
The Dollar and the S&P 500 have been negatively correlated since April 2010. The chart below shows three big swings with the Dollar and S&P 500 moving in opposite directions. After a long advance in stocks and decline in the Dollar, stocks peaked and the Dollar...
READ MORE
MEMBERS ONLY
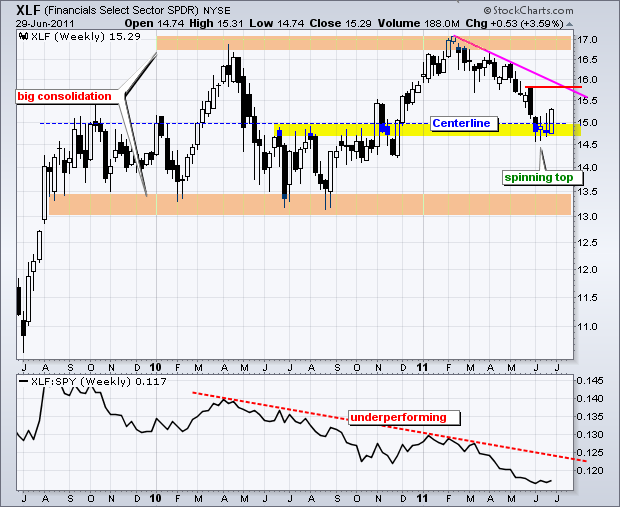
XLF Finds Support in Middle of a Big Consolidation
by Arthur Hill,
Chief Technical Strategist, TrendInvestorPro.com
The Finance SPDR (XLF) has been on a road to nowhere for almost two years now. After first moving above 15 in September 2009, the ETF embarked on a long trading range with support near 13 and resistance near 17. XLF has crossed the mid point (15) at least 10...
READ MORE
MEMBERS ONLY
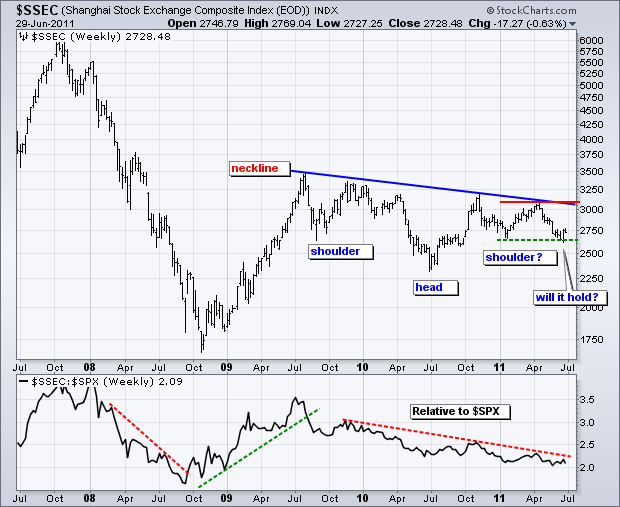
Shanghai Composite Forms Large Inverse Head-and-Shoulders
by Arthur Hill,
Chief Technical Strategist, TrendInvestorPro.com
The Shanghai Composite ($SSEC) has been drifting lower since July 2009, with a decline that looks like an inverse Head-and-Shoulders pattern. The neckline is sloping down, which affirms the current downtrend. A break above the neckline and the 2011 high is needed to complete the pattern and reverse...
READ MORE
MEMBERS ONLY
Programming Note: Upcoming Vacation
by Arthur Hill,
Chief Technical Strategist, TrendInvestorPro.com
It is family vacation time. This is the pause that refreshes. I will be taking a two week vacation starting Friday, July 1st. The next updates will be on Monday, July 18th. Have a happy 4th....
READ MORE
MEMBERS ONLY
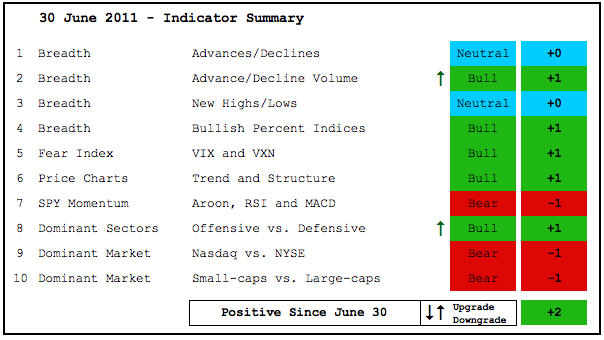
AD Volume Lines Surge as Consumer Discretionary Leads
by Arthur Hill,
Chief Technical Strategist, TrendInvestorPro.com
It's a choppy time for the indicator summary as the total flipped from -2 to +2 this week as the AD Volume Lines and Sector Performance were upgraded. The AD Volume Lines broke their March lows two weeks ago, but recovered with a strong breadth surge this week....
READ MORE
MEMBERS ONLY
Chart of Interest: ANF, AKAM, AKS, CCI, INTC, NTAP
by Arthur Hill,
Chief Technical Strategist, TrendInvestorPro.com
ANF Stalls at Trendline Support.
AKS Gaps up from Support.
INTC shows Relative weakness the Last Two Weeks.
Plus AKAM, CCI, NTAP.
This commentary and charts-of-interest are designed to stimulate thinking. This analysis is not a recommendation to buy, sell, hold or sell short any security (stock ETF...
READ MORE