MEMBERS ONLY
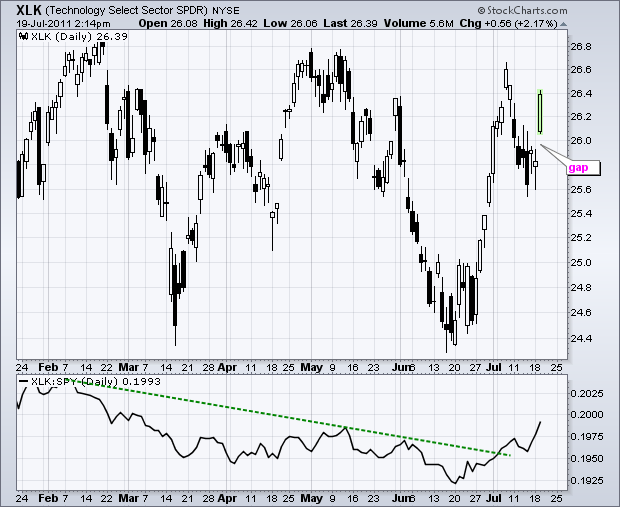
Tech SPDR Gaps Higher and Starts to Lead
by Arthur Hill,
Chief Technical Strategist, TrendInvestorPro.com
After firming for a few days, the Technology ETF (XLK) gapped higher on Wednesday with an open above 26. This is a big gap that is bullish as long as it holds. In the indicator window, the Price Relative turned up as XLK starts to outperform the S&P...
READ MORE
MEMBERS ONLY
QQQ Firms as Short-term Corrections Extend
by Arthur Hill,
Chief Technical Strategist, TrendInvestorPro.com
After a big surge from mid June to early July, stocks corrected with pullbacks over the last seven trading days. SPY and IWM were weighed down by weakness in money-center banks and regional banks on Monday, but DIA and QQQ held up relatively well. In fact, QQQ finished with a...
READ MORE
MEMBERS ONLY
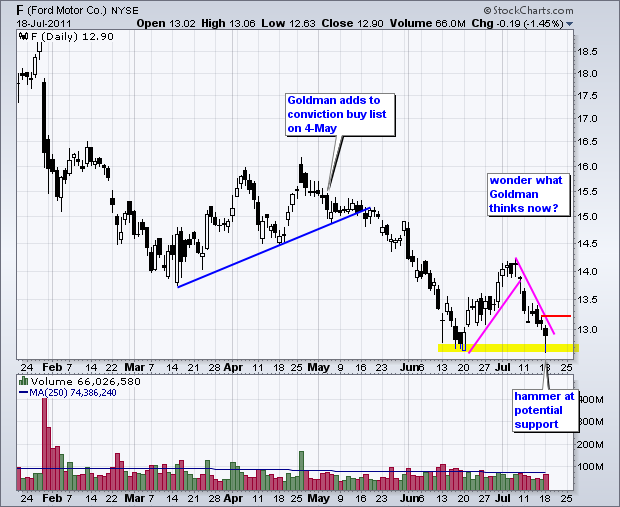
Chart of Interest: F, JPM, MOS, MRVL, SD
by Arthur Hill,
Chief Technical Strategist, TrendInvestorPro.com
F Forms Hammer Near Prior Low. JPM Establishes Clear Resistance Hurdle. SD Surges on Good Volume. Plus MOS and MRVL.
This commentary and charts-of-interest are designed to stimulate thinking. This analysis is not a recommendation to buy, sell, hold or sell short any security (stock ETF or otherwise). We all...
READ MORE
MEMBERS ONLY
French CAC 40 Index Breaks March Low
by Arthur Hill,
Chief Technical Strategist, TrendInvestorPro.com
With a plunge over the last seven days, the French CAC Index ($CAC) broke below its March low and reached its lowest point of the year. Also notice that the index formed lower highs in May and early July. The breakdown reflects the current debt problems in the Euro zone....
READ MORE
MEMBERS ONLY
Upgrades Strengthen Indicator Summary
by Arthur Hill,
Chief Technical Strategist, TrendInvestorPro.com
With several more upgrades, the indicator summary moved from +2 to +9 over the last two weeks. Nine of the ten indicator groups are positive or bullish. The AD Lines remain neutral because of a split decision. The Nasdaq AD Line is still in a downtrend, while the NYSE AD...
READ MORE
MEMBERS ONLY
SPY Corrects to Retracement Zone after Big Surge
by Arthur Hill,
Chief Technical Strategist, TrendInvestorPro.com
The decline in stocks over the last six days looks like a correction after a sharp advance. The major index ETFs moved sharply higher from mid June to early July. From the June 15th low to the July 7th high, SPY was up over 6%, while QQQ and IWM were...
READ MORE
MEMBERS ONLY
Revisiting the 2000 S&P 500 Reversal
by Arthur Hill,
Chief Technical Strategist, TrendInvestorPro.com
The 2000 market top evolved over a 12 month period as the S&P 500 traded between 1325 and 1550. The index broke this range at the end of 2000 and continued lower in early 2001. Notice that broken support turned into resistance and the throwback bounce retraced 50%...
READ MORE
MEMBERS ONLY
Revisiting the 2007 S&P 500 Reversal
by Arthur Hill,
Chief Technical Strategist, TrendInvestorPro.com
Although no two market tops are the same, we can get an idea of what a major reversal looks like by examining past reversals. The 2007 top evolved over a 9 month period. There were clear support breaks at 1425 and 1375. RSI broke its bull zone (40 to 80)...
READ MORE
MEMBERS ONLY
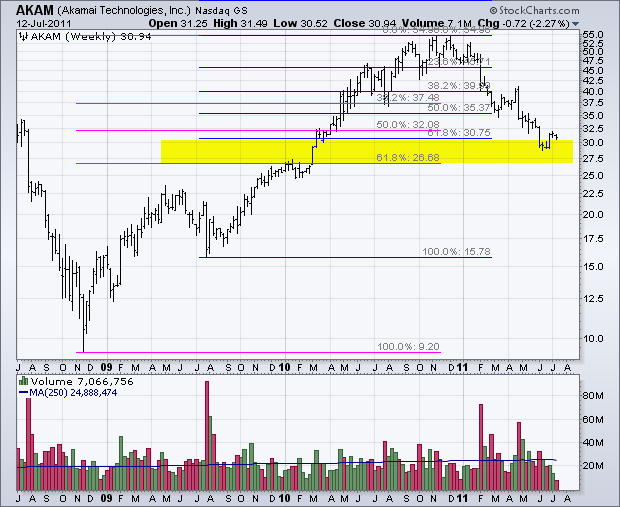
AKAM Hits Fibonacci Cluster Zone
by Arthur Hill,
Chief Technical Strategist, TrendInvestorPro.com
The Fibonacci Retracements Tool can be used to identify Fibonacci levels to estimate support, resistance or turning points. When there is more than one advance, chartists can apply this tool to both moves and look for a cluster zone. The chart for Akamai shows the Fibonacci Retracements Tool extending from...
READ MORE
MEMBERS ONLY
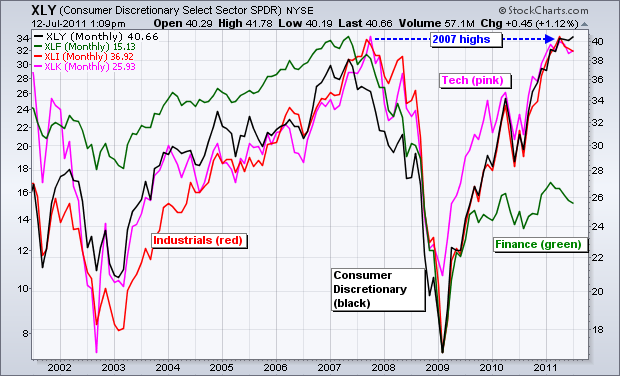
Finance Sector is the Big Drag
by Arthur Hill,
Chief Technical Strategist, TrendInvestorPro.com
The advance since the March lows has been enough to power the Consumer Discretionary SPDR (XLY) past its 2007 high. The Industrials SPDR (XLI) and the Technology ETF (XLK) both met resistance at their 2007 highs over the last few months. The Finance SPDR (XLF) remains the big laggard as...
READ MORE
MEMBERS ONLY
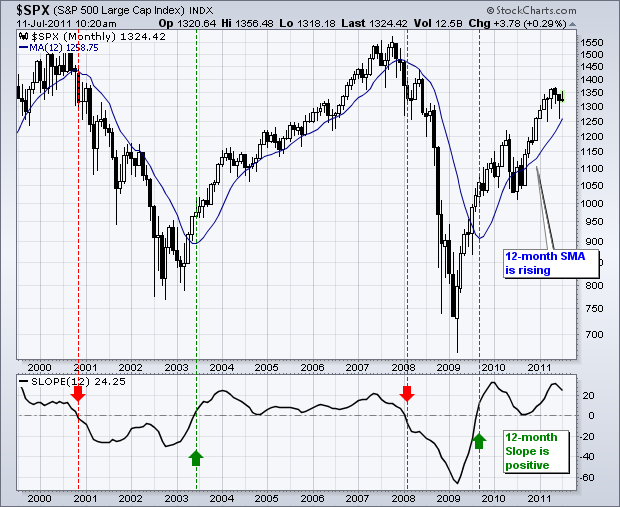
12 month Slope Indicator remains Positive for S&P 500
by Arthur Hill,
Chief Technical Strategist, TrendInvestorPro.com
Taking a big step back to look at the big picture, the 12-month Slope indicator for the S&P 500 turned positive in September 2009 and remains positive. While this indicator does not pick exact tops or bottoms, it gives us a good idea of the long-term trend. Note...
READ MORE
MEMBERS ONLY
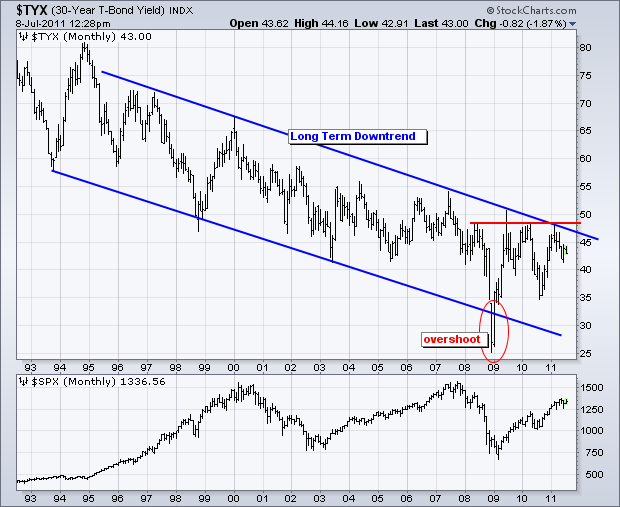
10-year Treasury Yield Backs off Long-term Resistance
by Arthur Hill,
Chief Technical Strategist, TrendInvestorPro.com
The 10-year Treasury Yield ($TNX) remains in a long-term downtrend that is dominated by a falling channel. The upper trendline has been touched at least four times since the mid 90s. More recently, the 10-year Treasury Yield hit resistance around 48.50 at least three times since May 2008. A...
READ MORE
MEMBERS ONLY
A Massive Triangle Takes Shape for the Home Construction iShares
by Arthur Hill,
Chief Technical Strategist, TrendInvestorPro.com
The Home Construction iShares (ITB) has gone nowhere since August 2009. After first crossing back above 12.75 in early August 2009, the ETF has meandered above/below this level the last 23 months. On the right half of the range, a large Symmetrical Triangle is taking shape. A break...
READ MORE
MEMBERS ONLY
Spanish IBEX Index Hits Major Resistance Zone
by Arthur Hill,
Chief Technical Strategist, TrendInvestorPro.com
The Spain Bolsa de Madrid IBEX 35 Index ($IBEX) hit a major resistance zone around 11000. Notice that the index has been turned back near this level since July 2010 (one year). A breakout is needed to revive the bulls here and build confidence in Europe. RSI confirms resistance as...
READ MORE
MEMBERS ONLY
Dow Industrials Remains Well below 2007 High
by Arthur Hill,
Chief Technical Strategist, TrendInvestorPro.com
The chart below shows the 23-day SMA for the Dow Industrials. There are around 23 trading days per month and this represents a rolling monthly average. It also smooths daily volatility. The March 2009 low was around 10% below the March 2003 low and the July 2011 high was around...
READ MORE
MEMBERS ONLY
Dollar and S&P 500 Continue Negative Correlation
by Arthur Hill,
Chief Technical Strategist, TrendInvestorPro.com
The Dollar and the S&P 500 have been negatively correlated since April 2010. The chart below shows three big swings with the Dollar and S&P 500 moving in opposite directions. After a long advance in stocks and decline in the Dollar, stocks peaked and the Dollar...
READ MORE
MEMBERS ONLY
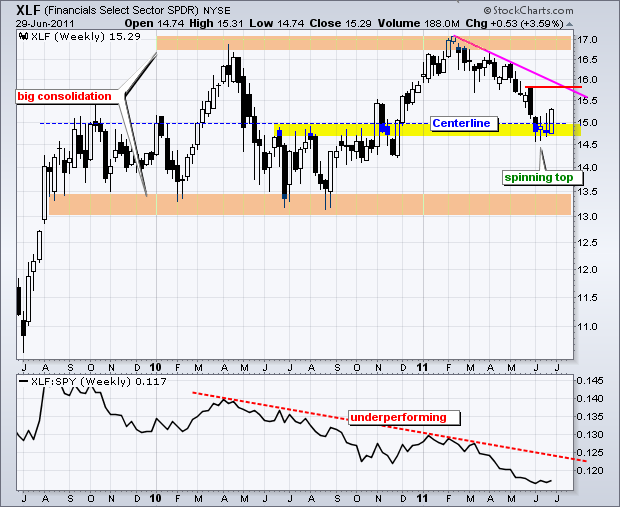
XLF Finds Support in Middle of a Big Consolidation
by Arthur Hill,
Chief Technical Strategist, TrendInvestorPro.com
The Finance SPDR (XLF) has been on a road to nowhere for almost two years now. After first moving above 15 in September 2009, the ETF embarked on a long trading range with support near 13 and resistance near 17. XLF has crossed the mid point (15) at least 10...
READ MORE
MEMBERS ONLY
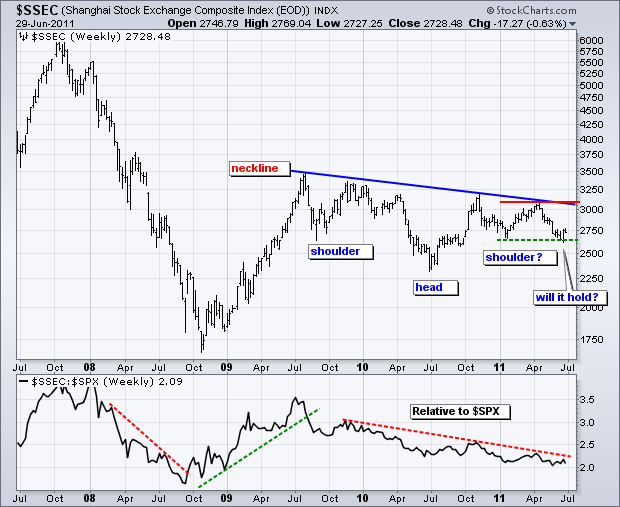
Shanghai Composite Forms Large Inverse Head-and-Shoulders
by Arthur Hill,
Chief Technical Strategist, TrendInvestorPro.com
The Shanghai Composite ($SSEC) has been drifting lower since July 2009, with a decline that looks like an inverse Head-and-Shoulders pattern. The neckline is sloping down, which affirms the current downtrend. A break above the neckline and the 2011 high is needed to complete the pattern and reverse the two...
READ MORE
MEMBERS ONLY
Programming Note: Upcoming Vacation
by Arthur Hill,
Chief Technical Strategist, TrendInvestorPro.com
It is family vacation time. This is the pause that refreshes. I will be taking a two week vacation starting Friday, July 1st. The next updates will be on Monday, July 18th. Have a happy 4th....
READ MORE
MEMBERS ONLY
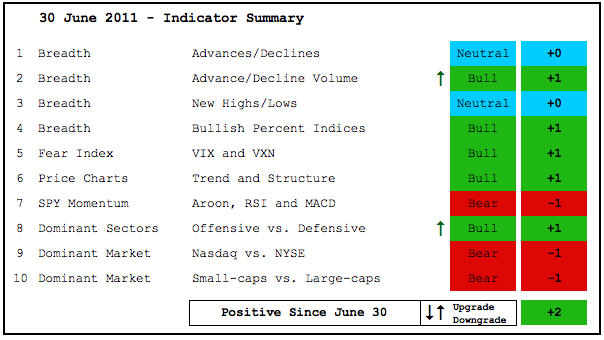
AD Volume Lines Surge as Consumer Discretionary Leads
by Arthur Hill,
Chief Technical Strategist, TrendInvestorPro.com
It's a choppy time for the indicator summary as the total flipped from -2 to +2 this week as the AD Volume Lines and Sector Performance were upgraded. The AD Volume Lines broke their March lows two weeks ago, but recovered with a strong breadth surge this week....
READ MORE
MEMBERS ONLY
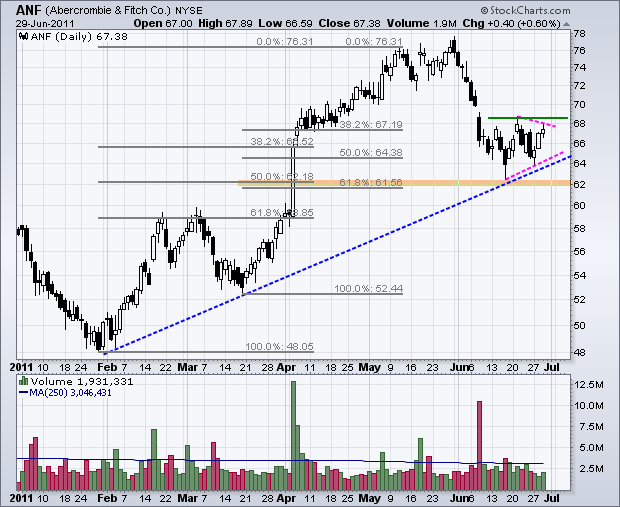
Chart of Interest: ANF, AKAM, AKS, CCI, INTC, NTAP
by Arthur Hill,
Chief Technical Strategist, TrendInvestorPro.com
ANF Stalls at Trendline Support.
AKS Gaps up from Support.
INTC shows Relative weakness the Last Two Weeks.
Plus AKAM, CCI, NTAP.
This commentary and charts-of-interest are designed to stimulate thinking. This analysis is not a recommendation to buy, sell, hold or sell short any security (stock ETF or otherwise)...
READ MORE
MEMBERS ONLY
SPY Follows Through with Breakout as IWM Leads Overall
by Arthur Hill,
Chief Technical Strategist, TrendInvestorPro.com
Stocks extended their gains on Wednesday with the S&P 500 ETF taking the lead. The day's gain was relatively modest (+.86%), but it was enough to comfortably clear resistance extending back to June 6th. I was impressed with Wednesday's price action in the Finance...
READ MORE
MEMBERS ONLY
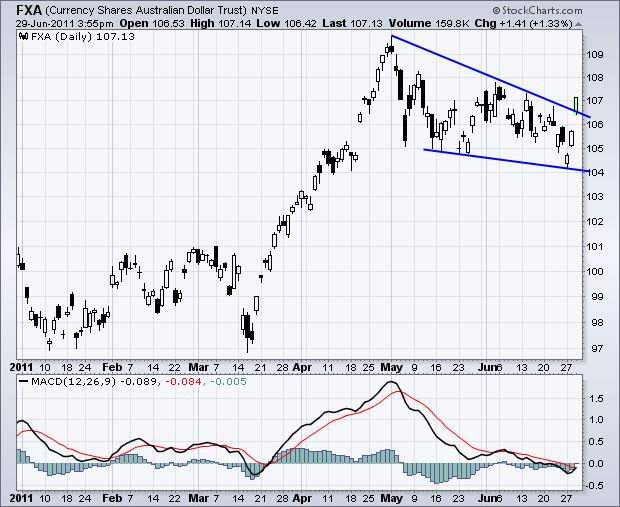
Aussie Dollar Breaks Wedge Trendline
by Arthur Hill,
Chief Technical Strategist, TrendInvestorPro.com
With commodities on the rebound this week, the Australian Dollar Trust (FXA) surged over the last two days and broke the upper trendline of a falling wedge. The Aussie Dollar, Canadian Dollar, New Zealand Dollar and S. African Rand are considered commodity currencies because their economies are dependent on raw...
READ MORE
MEMBERS ONLY
SPY Closes above mid June High and GLD Gets Oversold
by Arthur Hill,
Chief Technical Strategist, TrendInvestorPro.com
Small-caps and large-techs continue to lead the rebound off the March lows. The S&P 500 ETF (SPY) got into the action yesterday with a break above its mid June highs and the highest close since June 3rd. SPY is late to the breakout party, but better late than...
READ MORE
MEMBERS ONLY
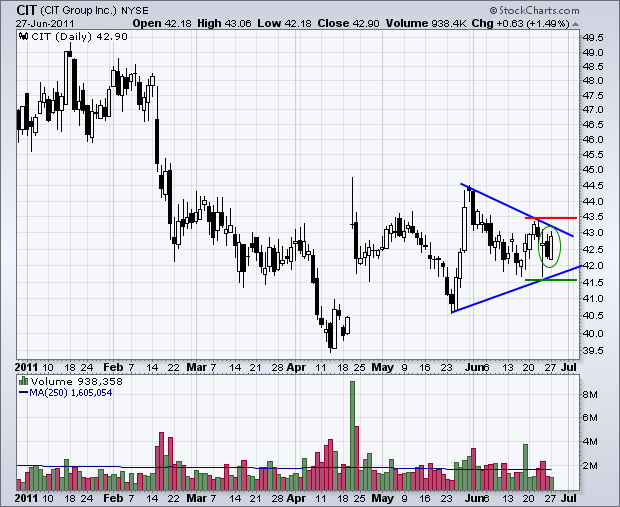
CIT Group Forms Bullish Engulfing Pattern
by Arthur Hill,
Chief Technical Strategist, TrendInvestorPro.com
With a weak open and strong close in the stock market, quite a few stocks made the Bullish Engulfing and Piercing Pattern scans. In particular, CIT Group (CIT) formed a bullish engulfing within a triangle pattern. A follow through breakout would confirm this bullish candlestick reversal.
Click this image for...
READ MORE
MEMBERS ONLY
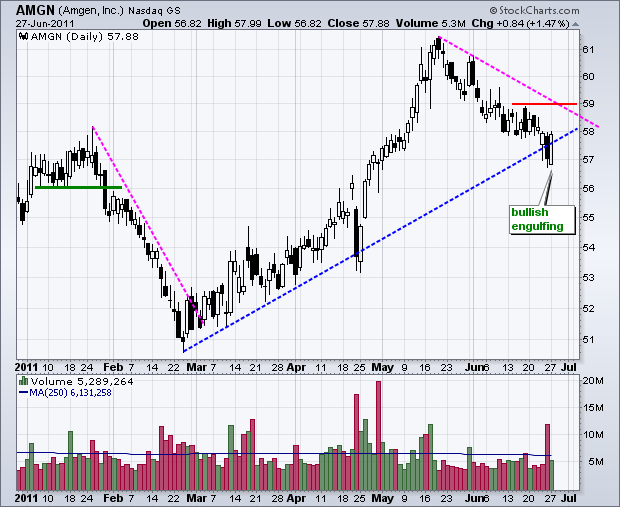
Chart of Interest: AMGN, ALTR, EMC, GILD, ISRG, NYT
by Arthur Hill,
Chief Technical Strategist, TrendInvestorPro.com
AMGN Forms Bullish Engulfing Pattern.
EMC Bounces off Support with Good Volume.
NYT Outperforms the S&P 500.
Plus ALTR, GILD, ISRG
This commentary and charts-of-interest are designed to stimulate thinking. This analysis is not a recommendation to buy, sell, hold or sell short any security (stock ETF or...
READ MORE
MEMBERS ONLY
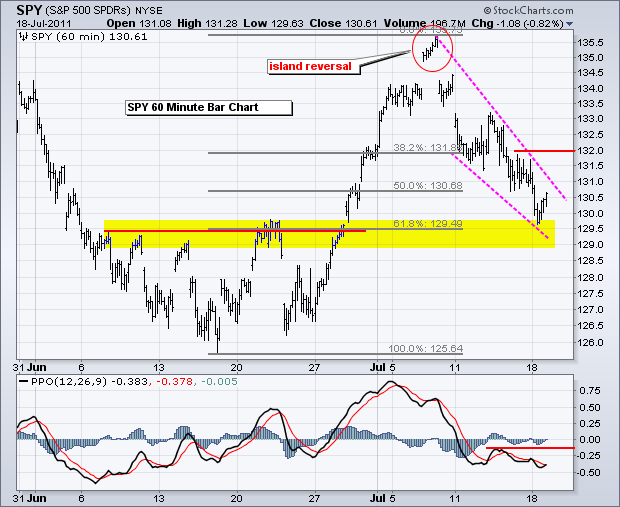
SPY Continues to Lag IWM and QQQ
by Arthur Hill,
Chief Technical Strategist, TrendInvestorPro.com
The Russell 2000 ETF (IWM) and Nasdaq 100 ETF (QQQ) exceeded their mid June highs over the last few days, but the S&P 500 ETF (SPY) remains a clear laggard as it failed to exceed its corresponding high. On the 60-minute chart, SPY remains with the gap down...
READ MORE
MEMBERS ONLY
Intrepid Potash Traces out Volatile Triangle
by Arthur Hill,
Chief Technical Strategist, TrendInvestorPro.com
Intrepid Potash (IPI) formed a volatile triangle within a downtrend. The trendline extending down from the February high and the upper trendline of the triangle converge to mark resistance. There could very well be a failure here. Alternatively, watch this level for a breakout.
Click this image for a live...
READ MORE
MEMBERS ONLY
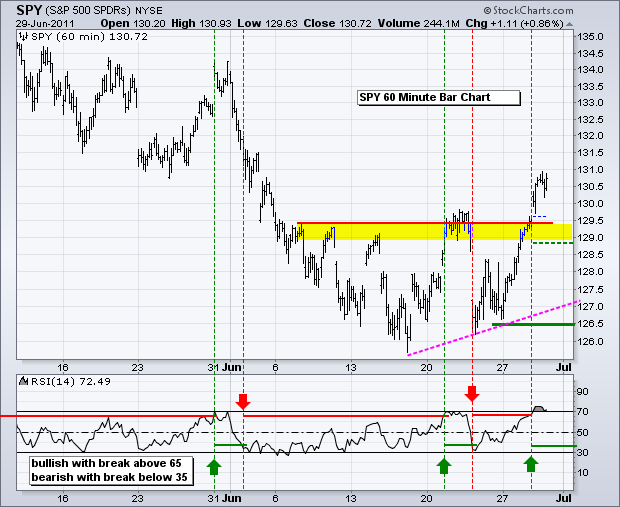
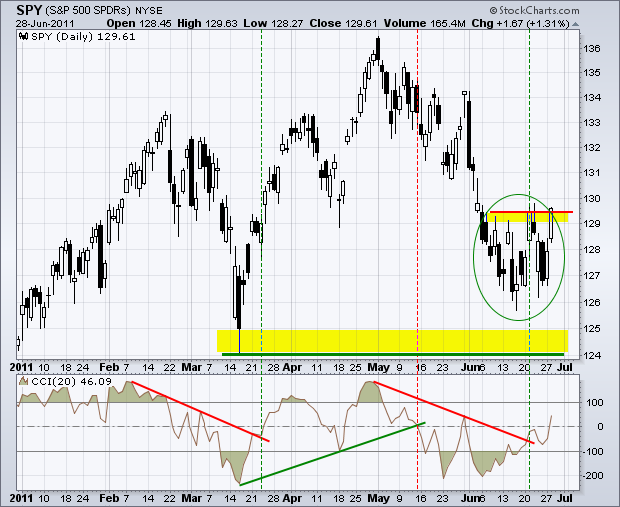
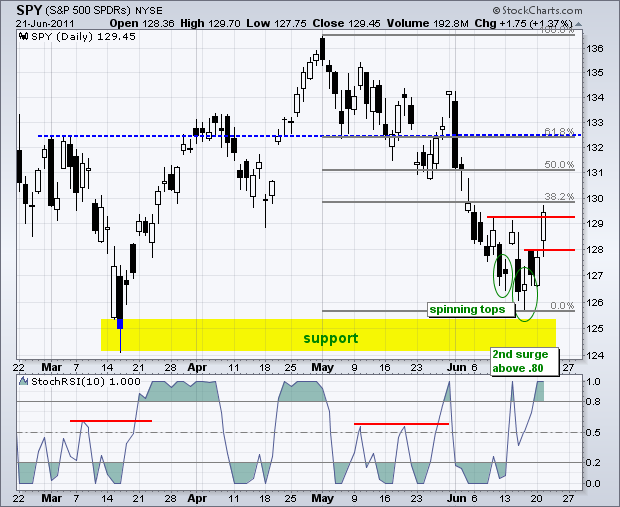
SPY Fails at Reistance as GLD Breaks Support
by Arthur Hill,
Chief Technical Strategist, TrendInvestorPro.com
Trading was quite volatile last week as the S&P 500 ETF (SPY) failed to hold Tuesday's gap and finished the week with a small loss. SPY gapped up and closed above 129 on Tuesday, stalled on Wednesday and then gapped down on Thursday. Despite this sharp...
READ MORE
MEMBERS ONLY
AD Volume Lines Rebound as Index ETFs Hold Support
by Arthur Hill,
Chief Technical Strategist, TrendInvestorPro.com
The major index ETFs are holding their March lows and there is no change in the indicator summary. The AD Volume Lines are also testing support from the March lows. In fact, both bounced sharply this week and are now back above their March lows. Even so, I will wait...
READ MORE
MEMBERS ONLY
SPY Battles Support as TLT Breaks Resistance
by Arthur Hill,
Chief Technical Strategist, TrendInvestorPro.com
The battle for support from the March lows continues to rage. Stocks opened sharply lower on Thursday, remained weak and then mounted a strong afternoon rally. This rebound pushed QQQ and IWM into positive territory by the close and cut most of the losses in SPY. On the 60-minute chart,...
READ MORE
MEMBERS ONLY
Big Techs Turn Green with Long White Candlestick
by Arthur Hill,
Chief Technical Strategist, TrendInvestorPro.com
With a weak open and strong close, the Nasdaq 100 ETF (QQQ) formed a long white candlestick that is just as long as Tuesday's candlestick. Volume surged to its highest level since mid March. The lows of these two candlesticks now mark an important short-term support level.
Click...
READ MORE
MEMBERS ONLY
Stocks Start Backing and Filling for First Test
by Arthur Hill,
Chief Technical Strategist, TrendInvestorPro.com
Stocks extended their gains early Wednesday, but selling pressure hit the market in the afternoon and the major index ETFs closed weak. Some backing and filling can be expected after a sharp surge, such as that seen on Tuesday. At this point, it is important that the first support zones...
READ MORE
MEMBERS ONLY
Chart of Interest: BSX, CAKE, IPG, ITUB, KGC, PLCE
by Arthur Hill,
Chief Technical Strategist, TrendInvestorPro.com
CAKE Forms Triangle after Trendline Break. KGV Breaks Bull Flag Trendline. PLCE Forms Bear Flag within Downtrend. Plus BSX, IPG, ITUB.
This commentary and charts-of-interest are designed to stimulate thinking. This analysis is not a recommendation to buy, sell, hold or sell short any security (stock ETF or otherwise). We...
READ MORE
MEMBERS ONLY
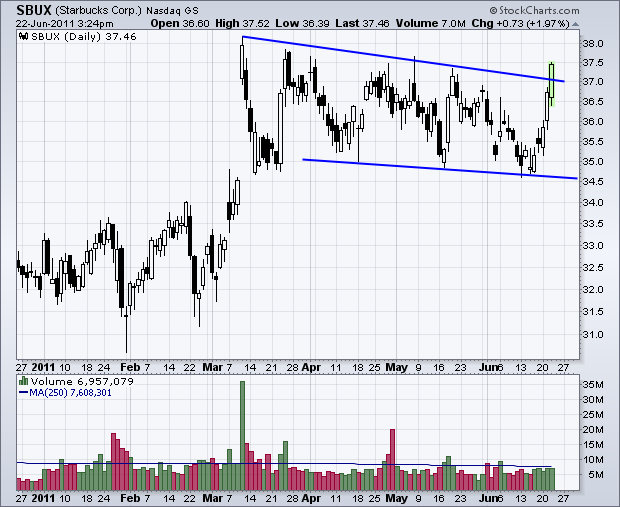
Starbucks Breaks Channel Trendline with Big Surge
by Arthur Hill,
Chief Technical Strategist, TrendInvestorPro.com
Starbucks (SBUX) got a jolt over the last five days with a surge above the upper trendline of a falling channel. Maybe it has something to the grand opening in the Brussels train station! Taking a step back, this pattern looks like a massive flag and the breakout signals a...
READ MORE
MEMBERS ONLY
SPY Breaks Resistance as TLT Forms Bull Flag
by Arthur Hill,
Chief Technical Strategist, TrendInvestorPro.com
Techs and small-caps led the market higher as the S&P 500 ETF (SPY) broke above short-term resistance with a big surge. Breadth was also big with the Net Advances Ratios and Net Advancing Volume Ratios exceeding .50 ($NYAD:$NYTOT,$NYUD:$NYTV,$NAAD:$NATOT,$NAUD:$NATV). I will feature...
READ MORE
MEMBERS ONLY
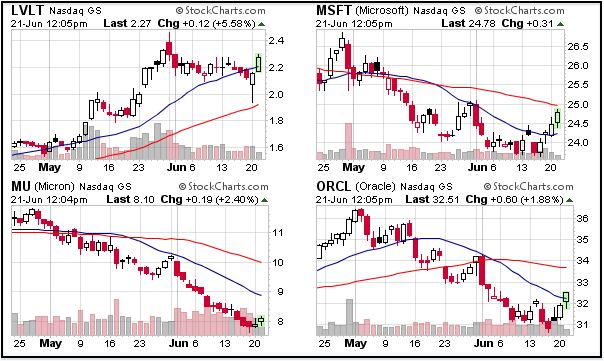
Most Active Techs Lead the Market Higher
by Arthur Hill,
Chief Technical Strategist, TrendInvestorPro.com
From the Free Charts page, we can see that the 10 most active Nasdaq and NYSE stocks are up in early trading on Tuesday. Gains are especially strong on the Nasdaq. The image below comes from the CandleGlance link just under the most active list. Microsoft has been moving higher...
READ MORE
MEMBERS ONLY
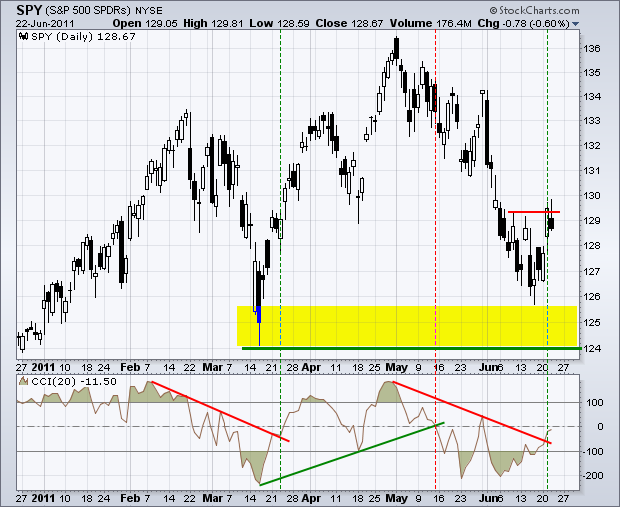
IWM Gets Momentum Breakout as SPY Challenges Resistance
by Arthur Hill,
Chief Technical Strategist, TrendInvestorPro.com
On the daily chart, the S&P 500 ETF (SPY) is making a stand at support from the March low. After two spinning tops last week, the ETF opened weak and closed pretty strong. Market breadth was not that strong though. Net Advances and Net Advancing Volume did not...
READ MORE
MEMBERS ONLY
Charts of Interest: A, BA, DELL, INTC, MMM, ORCL, SYMC
by Arthur Hill,
Chief Technical Strategist, TrendInvestorPro.com
A Shows Strong Upside Volume.
DELL Shows Relative Strength in June.
INTC Returns to the Monster Gap.
Plus BA, MMM, ORCL, SYMC.
This commentary and charts-of-interest are designed to stimulate thinking. This analysis is not a recommendation to buy, sell, hold or sell short any security (stock ETF or otherwise)...
READ MORE
MEMBERS ONLY
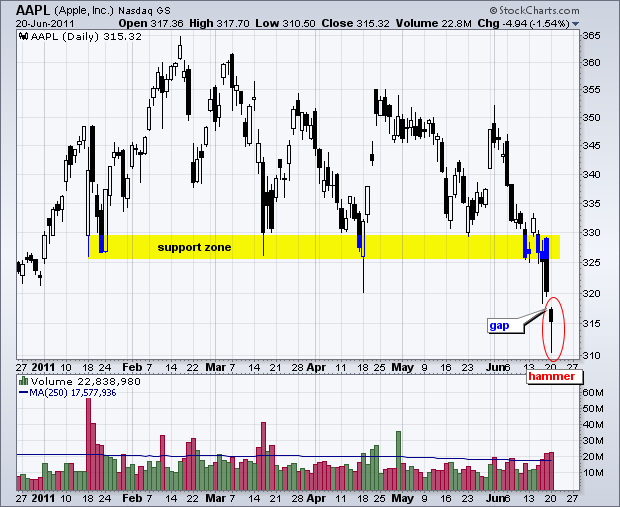
Apple Forms Hammer After Support Break
by Arthur Hill,
Chief Technical Strategist, TrendInvestorPro.com
After breaking support with rather high volume the last three days, Apple (AAPL) formed a hammer candlestick that dipped below 315 intraday. The stock still has a gap to contend with and needs to fill this gap to confirm the hammer. You can find more hammers on the predefined scan...
READ MORE