MEMBERS ONLY
SPY Follows Through on Piercing Pattern
by Arthur Hill,
Chief Technical Strategist, TrendInvestorPro.com
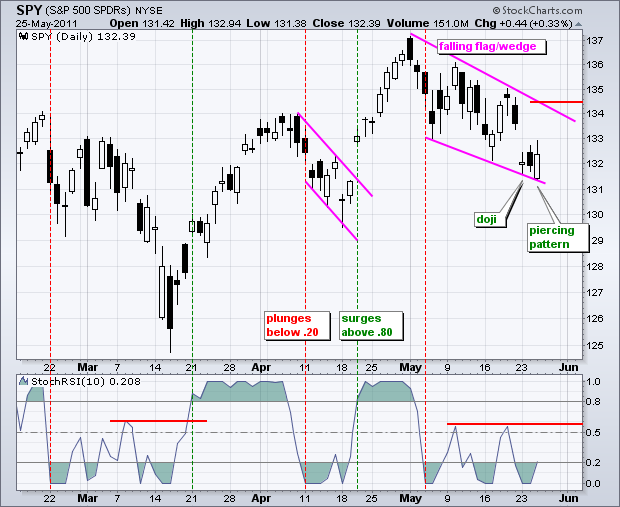
SPY followed through on the doji and piercing pattern with another modest gain on Thursday. The ETF closed up a mere .46%, but the white candlestick was once again rather long as SPY opened weak and closed fairly strong. So far, this looks like an oversold bounce within a downtrend...
READ MORE
MEMBERS ONLY
Microsoft Traces out an Island Reversal
by Arthur Hill,
Chief Technical Strategist, TrendInvestorPro.com
With a gap down, three day stall and gap up, Microsoft (MSFT) forged a bullish island reversal. Technically, the high of the 3-day consolidation is 24.31 and today's low is 24.32. The gap zone is one cent. Nevertheless, the essence of a island reversal is there....
READ MORE
MEMBERS ONLY
SPY Forms an Uninspiring Piercing Pattern
by Arthur Hill,
Chief Technical Strategist, TrendInvestorPro.com
There is no real change on the charts as SPY continues to firm after Monday's gap down. The ETF formed a doji on Monday, which indicates indecision. After a weak open on Wednesday, SPY recovered and closed above 132 to form a white candlestick that closed above the...
READ MORE
MEMBERS ONLY
Charts: AAPL,APA,APC,APOL, CCI,DNR,EXP,IPG,PLCE,SCMR
by Arthur Hill,
Chief Technical Strategist, TrendInvestorPro.com
AAPL Hits Support Zone.
APOL Breaks Support.
SCMR Forms Large Bullish Engulfing.
Plus APA,APC,CCI,DNR,EXP,IPG,PLCE,SCMR.
***********************************************
This commentary and charts-of-interest are designed to stimulate thinking. This analysis is not a recommendation to buy, sell, hold or sell short any security (stock ETF or otherwise). We...
READ MORE
MEMBERS ONLY
Renko Chart Shows a Clear Level to Beat for DIA
by Arthur Hill,
Chief Technical Strategist, TrendInvestorPro.com
Renko charts filter out the noise by requiring minimum price moves before the plot changes. This Renko chart shows the Dow Industrials SPDR (DIA) based on closing prices with 50 cents as the minimum move. A clear decline has taken shape in May with resistance at 125.
Click this image...
READ MORE
MEMBERS ONLY
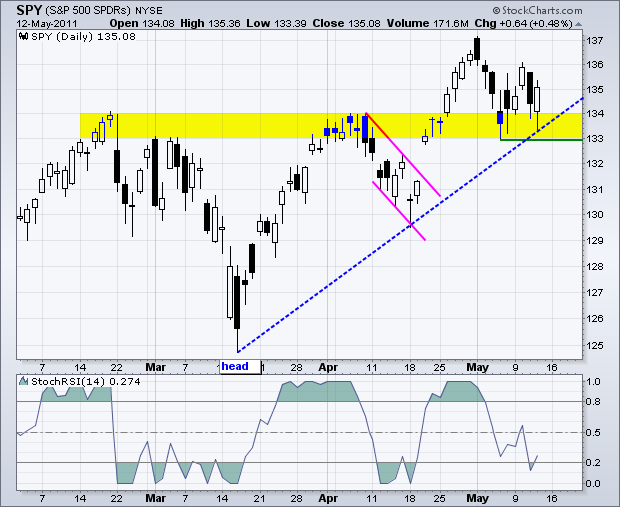
SPY Firms After Gap, But Remains within Falling Flag
by Arthur Hill,
Chief Technical Strategist, TrendInvestorPro.com
After recording a fresh 52-week high four weeks ago, SPY declined in May and formed a falling flag or wedge. First, 52-week highs occur in uptrends, not downtrends. Second, SPY remains above the mid April reaction low and has yet to forge a lower low. Downtrends require lower lows. Third,...
READ MORE
MEMBERS ONLY
F5 Networks Gets Sandwiched Between Two Key Moving Averages
by Arthur Hill,
Chief Technical Strategist, TrendInvestorPro.com
F5 Networks (FFIV) first broke below its 50-day SMA in January and then its 200-day moving average in March. The stock recovered with a break back above the 50-day in May, but has yet to reclaim the 200-day. The next moving average to break could hold the key to the...
READ MORE
MEMBERS ONLY
SPY Becomes Oversold in Short-term Downtrend
by Arthur Hill,
Chief Technical Strategist, TrendInvestorPro.com
With big gaps and sharp declines, the major index ETFs became oversold within short-term downtrends. This is a tricky situation because the medium-term trends (daily charts) remain up. The May decline, while sharp, is still viewed as a correction within a bigger uptrend. Picking the bottom for this correction is,...
READ MORE
MEMBERS ONLY
Charts: AKAM,FLEX,MON,PHM, QCOM,SLB,TEVA,$TNX,USL,WNR
by Arthur Hill,
Chief Technical Strategist, TrendInvestorPro.com
AKAM Forms Island Reversal.
MON Bucks the Market with a Breakout.
QCOM Consolidates above Breakout.
Plus FLEX,PHM,SLB,TEVA,$TNX,USL,WNR.
***********************************************
This commentary and charts-of-interest are designed to stimulate thinking. This analysis is not a recommendation to buy, sell, hold or sell short any security (stock ETF or...
READ MORE
MEMBERS ONLY
The Netherlands and Greece Show Relative weakness in Europe
by Arthur Hill,
Chief Technical Strategist, TrendInvestorPro.com
The PerfChart shows the year-to-date performance for six European stock indices. Surprisingly, the Italian Milan Index ($MIB) is the best performing. Germany is a close second though. It is also surprising to see the Netherlands Index ($AEX) down for the year and showing relative weakness.
Click this image for a...
READ MORE
MEMBERS ONLY
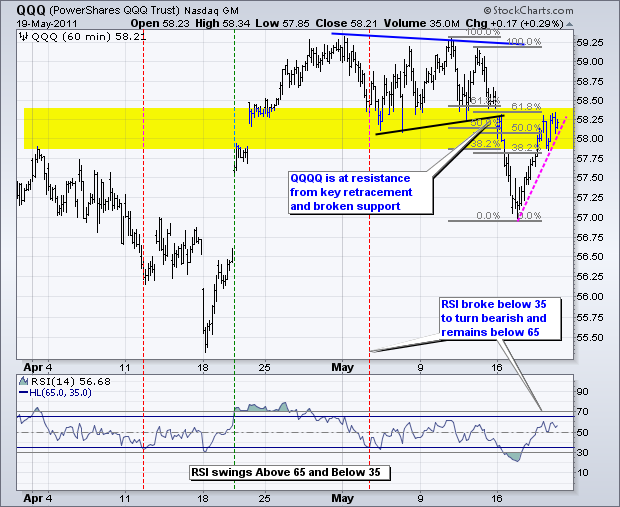
SPY, QQQ and IWM Affirm Resistance with Downturns
by Arthur Hill,
Chief Technical Strategist, TrendInvestorPro.com
The Nasdaq 100 ETF (QQQ) broke support with a sharp decline and broken support turned into resistance over the last few days. After hitting resistance last Thursday, the ETF turned lower on Friday. Even though Friday's decline was modest, a clear reaction high formed with resistance in the...
READ MORE
MEMBERS ONLY
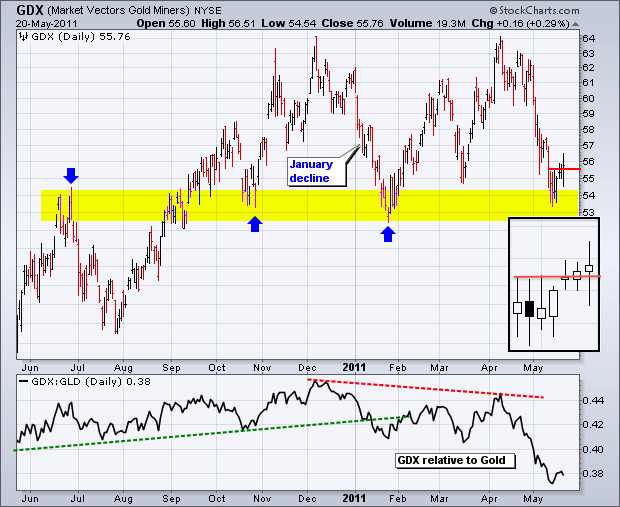
Gold Miners ETF Bounces off Major Support Level
by Arthur Hill,
Chief Technical Strategist, TrendInvestorPro.com
After getting slammed with a 10+ percent decline in May, the Gold Miners ETF (GDX) hit support and bounced over the last few days. As the chart below shows, this is no ordinary support level for GDX. Support in the 53 area stems from broken resistance and at least two...
READ MORE
MEMBERS ONLY
S&P Sector Carpet Shows Red in the Consumer Discretionary Sector
by Arthur Hill,
Chief Technical Strategist, TrendInvestorPro.com
The consumer discretionary sector is seeing serious red over the last two days. The S&P Sector Carpet shows 2-day price performance for various stocks in the nine sectors. Four of the five weakest stocks come from this most economically sensitive sector. Namely, retailers were weak the last two...
READ MORE
MEMBERS ONLY
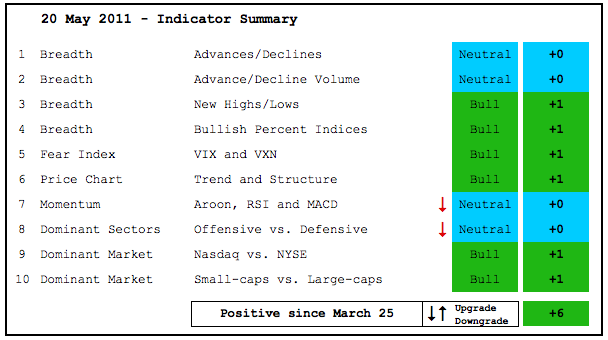
SPY Momentum and Nasdaq Breadth Are Concerns
by Arthur Hill,
Chief Technical Strategist, TrendInvestorPro.com
The indicator summary remains firmly positive, but downgrades in momentum and continued weakness in Nasdaq breadth are a concern. Even though SPY hit a 52-week high in April, RSI did not exceed 70 and failed to confirm strength. Also notice that 20-day Aroon for SPY dipped below -50 this week....
READ MORE
MEMBERS ONLY
QQQ, IWM and SPY Hit Short-Term Resistance Zones
by Arthur Hill,
Chief Technical Strategist, TrendInvestorPro.com
QQQ is at its make-or-break point for this oversold bounce. The ETF moved back into the broken support zone, which turns into resistance. There is also resistance in the 58.25 area from the 62% retracement cluster. The pink trendline marks the rate of ascent over the last two days....
READ MORE
MEMBERS ONLY
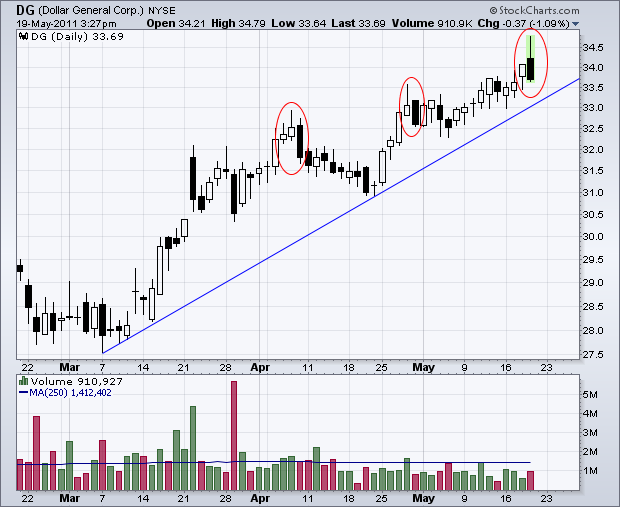
Dollar General Set to Appear on Bearish Engulfing Scan
by Arthur Hill,
Chief Technical Strategist, TrendInvestorPro.com
With a strong open and decline into the close, Dollar General (DG) is set form a bearish engulfing pattern with a long upper shadow. This is the third such pattern in the last two months. Watch the trendline extending up from the March low for a break to confirm this...
READ MORE
MEMBERS ONLY
RSI Forms A Bearish Failure Swing on SPY Chart
by Arthur Hill,
Chief Technical Strategist, TrendInvestorPro.com
Looking the daily chart for SPY, I am struck by the fact that 14-day RSI did not reach overbought levels in late April or early May. The surge from the mid March low to the early May high was quite strong. SPY advanced over 8% in 6-7 weeks. Despite such...
READ MORE
MEMBERS ONLY
Charts of Interest: AMAT, ETR, GOOG, PMCS, TKC, UBS
by Arthur Hill,
Chief Technical Strategist, TrendInvestorPro.com
Charts of Interest: AMAT Tests Key Support Level. ETR Forms Flag After Gap. GOOG Forms Large Bullish Engulfing. Plus PMCS, TKC and UBS.
***********************************************
This commentary and charts-of-interest are designed to stimulate thinking. This analysis is not a recommendation to buy, sell, hold or sell short any security (stock ETF or...
READ MORE
MEMBERS ONLY
Shanghai Composite Firms at Key Retracement
by Arthur Hill,
Chief Technical Strategist, TrendInvestorPro.com
With a 6.5% decline from its April high, the Shanghai Composite ($SSEC) has been one of the weaker world indices this spring. Despite relative weakness, the index is trying to firm in a support zone that centers around the 62% retracement. Last week's high marks the first...
READ MORE
MEMBERS ONLY
Gold and Euro Firm at Support as SPY HIts Key Retracement
by Arthur Hill,
Chief Technical Strategist, TrendInvestorPro.com
The Gold SPDR (GLD) is at support and looks ripe for an oversold bounce. The mid April trendline, broken resistance and the early May spike low mark support in the 144 area. A falling channel defines the short-term downtrend. Look for a surge off support for the first bullish sign....
READ MORE
MEMBERS ONLY
A Cluster of Long White Candlesticks for ASEI
by Arthur Hill,
Chief Technical Strategist, TrendInvestorPro.com
American Science and Engineering ($ASEI) broke support at the beginning of May, but the bulls are not giving up easily as the stock formed at least four really long white candlesticks since then. A long white or hollow candlestick indicates that the close is above the open. These candlesticks reflect...
READ MORE
MEMBERS ONLY
QQQ and IWM Lead Market Lower with Support Breaks
by Arthur Hill,
Chief Technical Strategist, TrendInvestorPro.com
Most of the action on Monday took place outside of the S&P 500 ETF (SPY). In particular, the Nasdaq 100 ETF (QQQ) broke support with a sharp decline led by large-cap tech stocks. Apple (AAPL) and Google were down over 2% and Amazon (AMZN) was down almost 5%...
READ MORE
MEMBERS ONLY
Charts of Interest: ANF, FAST, HD, MAS, SBUX, STT
by Arthur Hill,
Chief Technical Strategist, TrendInvestorPro.com
FAST Forms Tight Triangle. HD Nears Support Zone. STT Stalls at Key Retracement. Plus ANF, MAS, SBUX
This commentary and charts-of-interest are designed to stimulate thinking. This analysis is not a recommendation to buy, sell, hold or sell short any security (stock ETF or otherwise). We all need to think...
READ MORE
MEMBERS ONLY
Steel ETF Tests Double Top Low
by Arthur Hill,
Chief Technical Strategist, TrendInvestorPro.com
The Steel ETF (SLX) traced out a double top with two relatively equal highs this year. The intermittent low formed in March to mark key support for this pattern. SLX closed right at this low on Friday for an important test. A break below this level would confirm the double...
READ MORE
MEMBERS ONLY
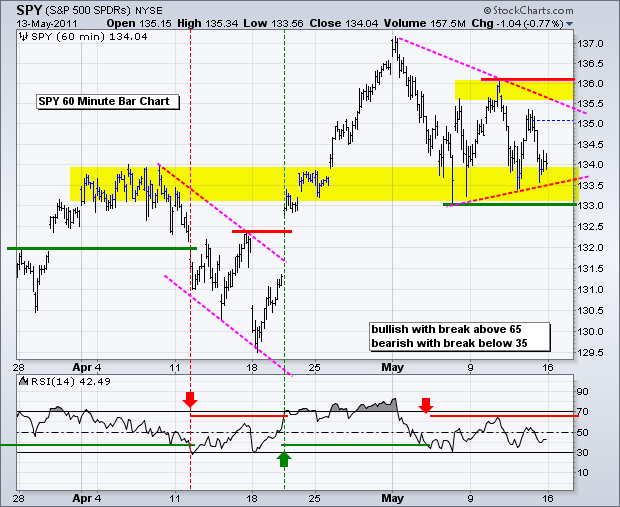
Battle of the Consolidations for SPY IWM and QQQ
by Arthur Hill,
Chief Technical Strategist, TrendInvestorPro.com
Today we will just go straight to the 60-minute charts to review the current consolidations in the Nasdaq 100 ETF (QQQ), Russell 2000 ETF (IWM) and S&P 500 ETF (SPY). Stocks became overbought after surging from mid April to early May. These overbought conditions were worked off with...
READ MORE
MEMBERS ONLY
Energy Sector Weighs on Amex in May
by Arthur Hill,
Chief Technical Strategist, TrendInvestorPro.com
Of the five broad market indices, the Amex is the weakest due to declines in energy related shares this month. The Amex is heavily weighted towards the energy sector. The NY Composite ($NYA) is the second weakest index. $NYA is heavily weighted towards the finance sector, which has also been...
READ MORE
MEMBERS ONLY
Fewer Net New Highs Could Foreshadow a Correction
by Arthur Hill,
Chief Technical Strategist, TrendInvestorPro.com
Some signs of weakness are creeping into the market, but the bulk of the evidence remains bullish at this point. The major index ETFs recorded 52-week highs in April, the NYSE AD Line hit a 52-week high this week and the Nasdaq AD Volume Line is challenging its February high....
READ MORE
MEMBERS ONLY
SPY Forms Triangle Just Above Support Zone
by Arthur Hill,
Chief Technical Strategist, TrendInvestorPro.com
There is no change on the daily chart, which remains in an uptrend overall. SPY broke a resistance zone and this zone turned into a short-term support zone. So far, the support zone is holding as the ETF bounced off the 133-134 area twice in the last two weeks. Clearly,...
READ MORE
MEMBERS ONLY
Parallel Aroon Indicators Reflect Consolidation in LMT
by Arthur Hill,
Chief Technical Strategist, TrendInvestorPro.com
Even though Lockheed Martin (LMT) edged higher the last few weeks, both Aroon Up (green) and Aroon (down) moved lower. Also notice that they are parallel and relatively close together. This affirms the consolidation in LMT. The first indicator to move above 50 will trigger the next signal. You can...
READ MORE
MEMBERS ONLY
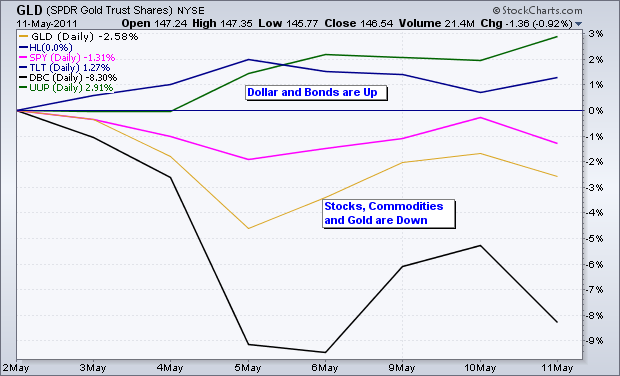
Risk Off Trade Returns as SPY Fails after Short Bounce
by Arthur Hill,
Chief Technical Strategist, TrendInvestorPro.com
Stocks are moving in sync with the Euro and commodities, both of which have been falling this month. The Euro is under pressure with concerns over Greek debt. Oil is under pressure because the Dollar is rising and stocks have weakened this month. US Treasuries are attracting money as a...
READ MORE
MEMBERS ONLY
Charts of Interest: AN, CVX, GE, JPM, LEN, LMT, RTN, TIF
by Arthur Hill,
Chief Technical Strategist, TrendInvestorPro.com
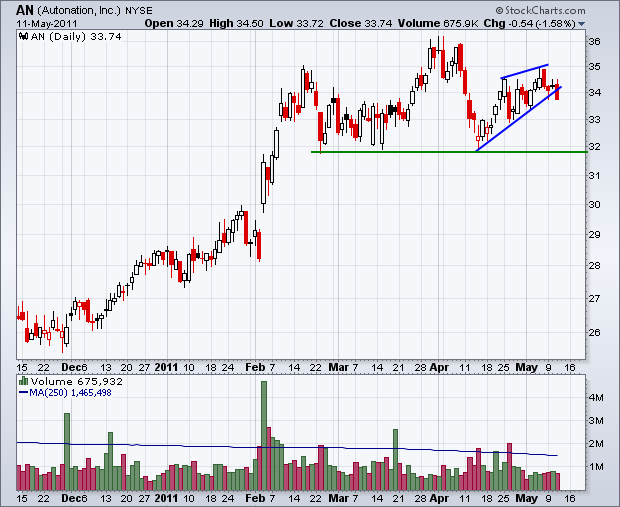
AN Breaks Wedge Support.
JPM Breaks Pennant Support.
RTN Consolidates after Support Break.
Plus CVX, GE,LEN, LMT, TIF
See ChartSchool article on Aroon for more details.
***********************************************
This commentary and charts-of-interest are designed to stimulate thinking. This analysis is not a recommendation to buy, sell, hold or sell short any...
READ MORE
MEMBERS ONLY
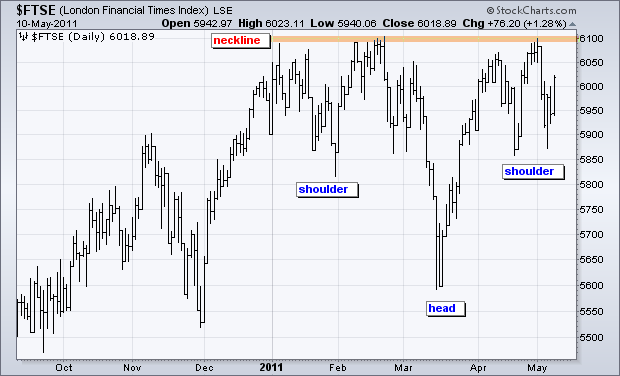
FTSE Forms Inverse Head-and-shoulders Pattern
by Arthur Hill,
Chief Technical Strategist, TrendInvestorPro.com
The London FTSE 100 ($FTSE) found support near its January-February lows over the last few weeks. With a deeper dip in March, an inverse head-and-shoulders pattern is taking shape in 2011. A break above 6100 (neckline) would signal a continuation higher.
Click this image for a live chart...
READ MORE
MEMBERS ONLY
SPY Gets Bounce off Broken Resistance
by Arthur Hill,
Chief Technical Strategist, TrendInvestorPro.com
There is no change on the daily chart as SPY affirmed support at 133 with a bounce over the last few days. On the 60-minute chart, SPY pulled back rather sharply after the breakout surge last week, but ultimately held support and moved above 135.5 today. The short-term trend...
READ MORE
MEMBERS ONLY
Commodity ETF Gets Oversold Bounce off Support $DBC
by Arthur Hill,
Chief Technical Strategist, TrendInvestorPro.com
After becoming oversold last week, the DB Commodity Index Fund ($DBC) bounced off support with a long white candlestick. Notice that an inverted hammer formed on Friday as RSI dipped below 30 (oversold). Broken support turns into the first resistance area around 30.50.
Click this image for a live...
READ MORE
MEMBERS ONLY
Charts: AAPL, ADBE, AMKR, CPWR, FISV, JBL, SSP, SYK, TIN
by Arthur Hill,
Chief Technical Strategist, TrendInvestorPro.com
ADBE Breaks Wedge Trendline. CPWR Consolidates after Gap. FISV Forms Pennant after Sharp Decline. AAPL, AMKR, FISV, JBL, SSP, SYK, TIN
***********************************************
This commentary and charts-of-interest are designed to stimulate thinking. This analysis is not a recommendation to buy, sell, hold or sell short any security (stock ETF or otherwise). We...
READ MORE
MEMBERS ONLY
SPY Gets Small Bounce off Broken Resistance
by Arthur Hill,
Chief Technical Strategist, TrendInvestorPro.com
There is no real change on the daily chart as SPY continues to firm at broken resistance, which turns into support. The ETF formed two spinning tops on Thursday-Friday and a small white candlestick on Monday. The bounce was rather feeble, but support is holding nonetheless. So far the breakout...
READ MORE
MEMBERS ONLY
Energy Goes from Leader to Laggard $XLE
by Arthur Hill,
Chief Technical Strategist, TrendInvestorPro.com
The Energy SPDR (XLE) is still one of the leading sectors in 2011, but the ETF has started showing relative weakness over the last 30 trading days. The PerfChart below shows XLE as the weakest of the nine sectors since March 25th. All sectors are up, but XLE is down...
READ MORE
MEMBERS ONLY
SPY Firms with Two Spinning Tops at Support
by Arthur Hill,
Chief Technical Strategist, TrendInvestorPro.com
SPY declined to support and firmed with two spinning tops at the end of the week. These candlesticks have relatively long shadows with a small body. The shadows represent the high and low, while the body represents the open and close. Even though SPY firmed with these spinning tops, we...
READ MORE
MEMBERS ONLY
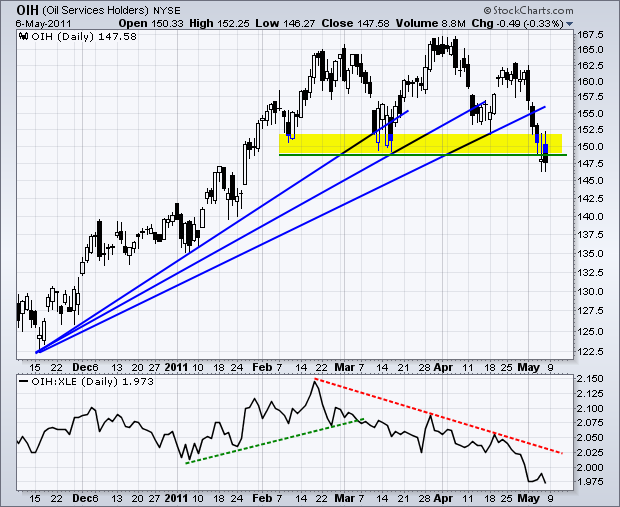
OIH Breaks Support as it Leads XLE Lower
by Arthur Hill,
Chief Technical Strategist, TrendInvestorPro.com
The Oil Service HOLDRS (OIH) is leading the energy sector lower with a break below the March lows. There are two bearish patterns working on the OIH price chart. First, OIH hit resistance in the 162.5-167.5 area with three reaction highs and then broke below support with a...
READ MORE
MEMBERS ONLY
Indicator Summary Remains Positive Despite Concerns
by Arthur Hill,
Chief Technical Strategist, TrendInvestorPro.com
The bulk of the evidence remains bullish, but there are signs of dissent brewing out there. The bulls control the trends as the major index ETFs hit new highs in April. The AD Volume Lines are also strong and the Net New Highs Lines have yet to break down. Relative...
READ MORE