MEMBERS ONLY
Weak Closes Continue to Weigh on Stocks
by Arthur Hill,
Chief Technical Strategist, TrendInvestorPro.com
When it rains, it pours. Stocks were hovering in positive territory on Tuesday afternoon, but got hit with selling pressure in the final hour. Blame is on the economic outlook from Bernanke. After edging above 130 just after 3PM, the S&P 500 ETF (SPY) plunged and closed below...
READ MORE
MEMBERS ONLY
QQQ Breaks Ichimoku Cloud
by Arthur Hill,
Chief Technical Strategist, TrendInvestorPro.com
With the decline over the last several weeks, the Nasdaq 100 ETF (QQQ) broke below the Ichimoku Cloud for the third time since March. The ETF recovered quickly after the first two breaks. Also notice that the cloud is poised to turn red, which happens when the red line is...
READ MORE
MEMBERS ONLY
Finance Sector Pushes SPY Below April Low
by Arthur Hill,
Chief Technical Strategist, TrendInvestorPro.com
The April lows are starting to break. The Russell 2000 ETF (IWM), S&P MidCap 400 SPDR (MDY) and S&P 500 ETF (SPY) broke their April lows. The Dow Industrials SPDR (DIA) and the Nasdaq 100 ETF (QQQ) remain just above their April lows. Weakness in the...
READ MORE
MEMBERS ONLY
Charts: ATMI, BIDU, CHRW, PNRA, PMCS, SBUX
by Arthur Hill,
Chief Technical Strategist, TrendInvestorPro.com
ATMI Firms at Key Retracement.
CHRW Breaks Support.
SBUX Forms Extended Triangle.
Plus BIDU, PNRA, PMCS
This commentary and charts-of-interest are designed to stimulate thinking. This analysis is not a recommendation to buy, sell, hold or sell short any security (stock ETF or otherwise). We all need to...
READ MORE
MEMBERS ONLY
SPY Tests Key Retracement and Important Low
by Arthur Hill,
Chief Technical Strategist, TrendInvestorPro.com
Stocks remain in corrective mode, but the bigger trends are still up. With a move below 131 on Friday, the S&P 500 ETF (SPY) has retraced around 62% of the March-May advance. Keep in mind that this advance forged a 52-week high, which affirms the larger...
READ MORE
MEMBERS ONLY
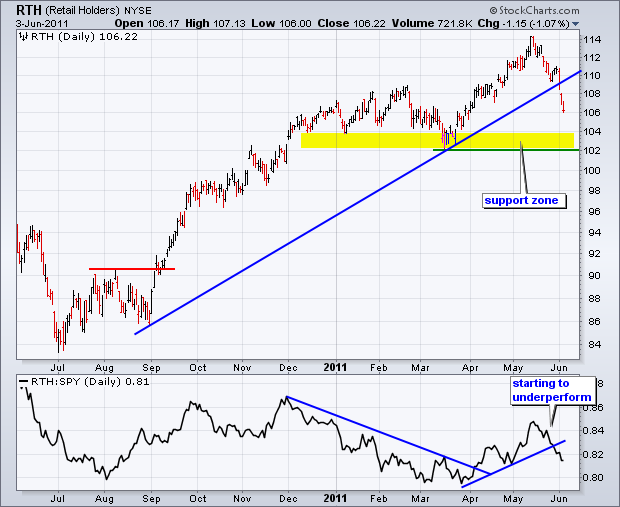
RETAILERS BEAR BRUNT OF SELLING PRESSURE
by Arthur Hill,
Chief Technical Strategist, TrendInvestorPro.com
With economic indicators and employment statistics coming up short this week, retail stocks came under considerable selling pressure. Led by weakness in Wal-Mart and Home Depot, the **Retail HOLDRS (RTH)** is down some 7% the last few weeks. Chart 7 shows RTH breaking the trendline extending up from early...
READ MORE
MEMBERS ONLY
Auto Nation Traces out Possible Head-and-Shoulders Reversal
by Arthur Hill,
Chief Technical Strategist, TrendInvestorPro.com
Auto Nation (AN) is tracing out a clear Head-and-Shoulders pattern, but remains short of a confirming support break. The most recent signal was a triangle breakout last week. AN has since moved back into triangle support. A move below 32.5 would break support and argue for a...
READ MORE
MEMBERS ONLY
NYSE AD Line Hits New High as Evidence Remains Bullish
by Arthur Hill,
Chief Technical Strategist, TrendInvestorPro.com
When does a short-term decline extend far enough to have medium-term or long-term consequences? That is the big question right now. As far as I can tell, the May decline has yet to do enough technical damage to change the medium-term outlook (2-6 months). As...
READ MORE
MEMBERS ONLY
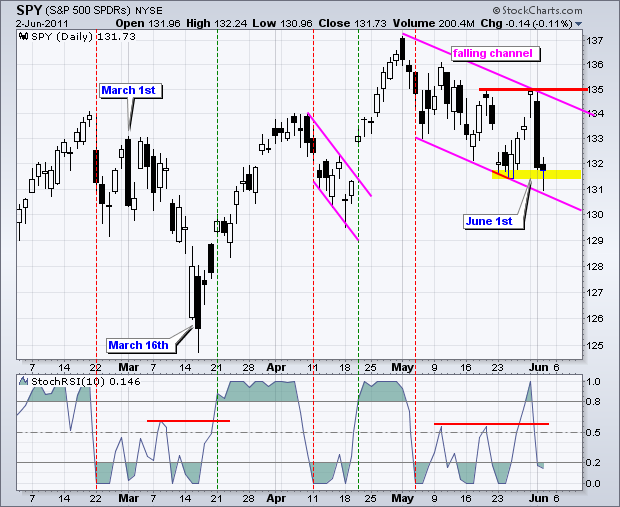
SPY Firms Within Short Term Downtrend
by Arthur Hill,
Chief Technical Strategist, TrendInvestorPro.com
And now for the employment report... There is not much to do but wait for the market's reaction to the jobs number. On the daily chart, SPY is trading within a falling channel. The last reaction high formed with a hanging man and long black candlestick. This is...
READ MORE
MEMBERS ONLY
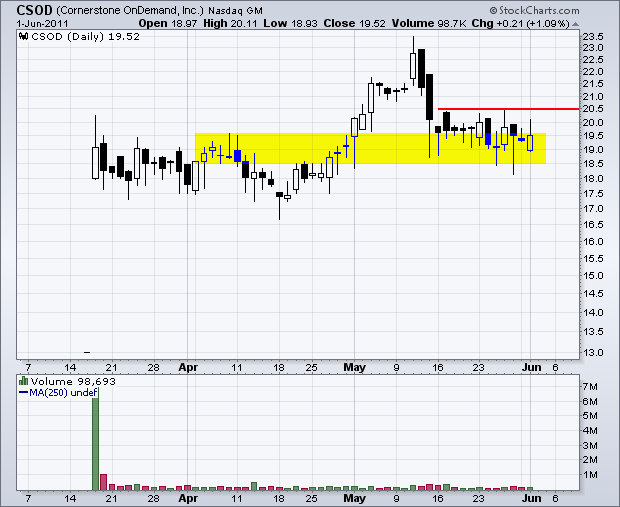
Cornerstone OnDemand Bucks the Market with a Bullish Engulfing
by Arthur Hill,
Chief Technical Strategist, TrendInvestorPro.com
Despite yesterday's sharp decline, a number of stocks bucked the selling pressure by gaining on the day or forming bullish candlestick patterns. Cornerstone OnDemand ($CSOD), which debuted on March 17th, formed a bullish engulfing and gained on Wednesday. Follow through above resistance would confirm this pattern.
Click this...
READ MORE
MEMBERS ONLY
Charts of Interest: ADSK, CVX, ILMN, INTU, NVLS, STX, XOM
by Arthur Hill,
Chief Technical Strategist, TrendInvestorPro.com
CVX Forms Bearish Wedge.
ILMN Bucks the Selling Pressure.
NVSL Forms Shooting Star.
Plus ADSK, INTU, STX, XOM
***********************************************
This commentary and charts-of-interest are designed to stimulate thinking. This analysis is not a recommendation to buy, sell, hold or sell short any security (stock ETF or otherwise). We all...
READ MORE
MEMBERS ONLY
SPY Fails to Hold Breakout and Fills Gap
by Arthur Hill,
Chief Technical Strategist, TrendInvestorPro.com
The S&P 500 ETF (SPY) surged above the wedge trendline with a four day advance and then gave it all back in one day. Wednesday's decline was broad-based with the most negative breadth since March. This decline signals the start of an extended decline or...
READ MORE
MEMBERS ONLY
Bearish Engulfing Scan Fills up as Stocks Decline Sharply
by Arthur Hill,
Chief Technical Strategist, TrendInvestorPro.com
There are over 200 stocks across the various exchanges on Wednesday's bearish engulfing scan. From the NYSE, FedEx (FDX) formed a bearish engulfing on the first day of the month in both May and June. Wednesday's big bearish engulfing occurred on expanding volume.
Click this image...
READ MORE
MEMBERS ONLY
SPY Breaks Wedge Trendline with a Hanging Man
by Arthur Hill,
Chief Technical Strategist, TrendInvestorPro.com
The S&P 500 ETF (SPY) made it four in a row with a surge and trendline breakout on Tuesday. SPY opened strong, dipped intraday and surged at the close. A hanging man candlestick formed with a small body and long lower shadow. These are potentially bearish candlestick reversal...
READ MORE
MEMBERS ONLY
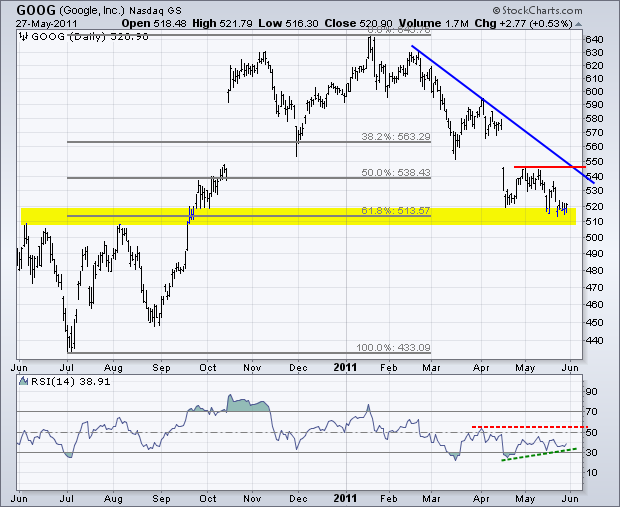
Google Hits Key Retracement with RSI Divergence
by Arthur Hill,
Chief Technical Strategist, TrendInvestorPro.com
Google ($GOOG) has been trending lower since mid January, but support may be at hand in the 515 area. Broken resistance and the 62% retracement combine to mark support here. Also notice that RSI has a bullish divergence working the last few weeks.
Click this image for a live chart...
READ MORE
MEMBERS ONLY
Charts: BBT, EXPD, GOOG, JBLU, LINTA, NWSA, UAL
by Arthur Hill,
Chief Technical Strategist, TrendInvestorPro.com
GOOG Hits Retracement Support.
JBLU Forms Higher Low.
NWSA Challenges Resistance with Ascending Triangle.
Plus BBT, EXPD, LINTA, UAL.
***********************************************
This commentary and charts-of-interest are designed to stimulate thinking. This analysis is not a recommendation to buy, sell, hold or sell short any security (stock ETF or otherwise). We...
READ MORE
MEMBERS ONLY
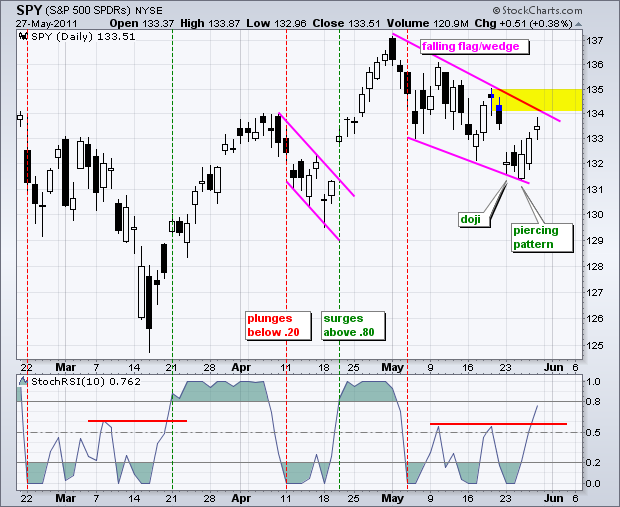
SPY Challenges Wedge Trendline
by Arthur Hill,
Chief Technical Strategist, TrendInvestorPro.com
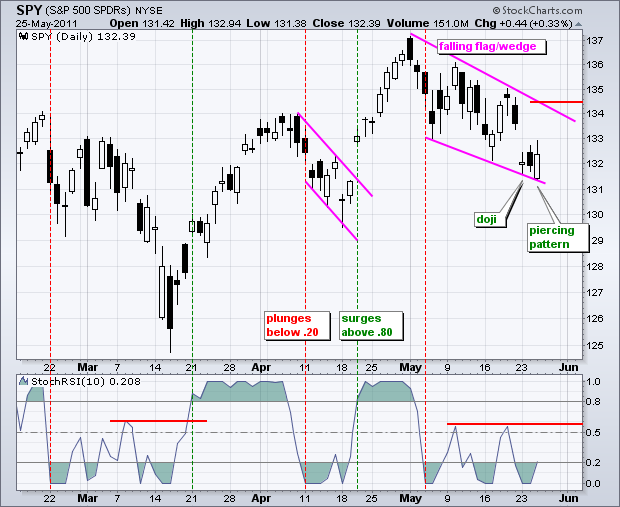
With a three day bounce last week, the S&P 500 ETF (SPY) is poised to challenge the upper trendline of the falling flag/wedge. The ETF opened strong on Friday and then stalled the rest of the day to form a doji type candlestick denoting indecision. A little...
READ MORE
MEMBERS ONLY
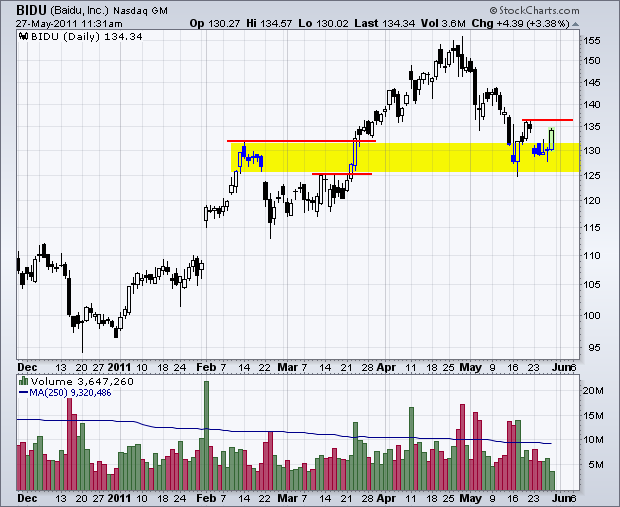
Baidu Firms at Broken Resistance Zone
by Arthur Hill,
Chief Technical Strategist, TrendInvestorPro.com
A basic tenet of technical analysis is that broken resistance turns into support. Biadu broke two resistance levels and these combine to form a support zone. With the stock firming the last two week, watch for a bounce above the mid May high to reverse the May slide.
Click this...
READ MORE
MEMBERS ONLY
Spots of Weakness, but Bulk of Evidence Remains Bullish
by Arthur Hill,
Chief Technical Strategist, TrendInvestorPro.com
There are areas of weakness in the stock market, but the bulk of the evidence remains bullish. The Nasdaq AD Line broke below its April low, but the NYSE AD Line remains in a clear uptrend. SPY momentum was downgraded to bearish as MACD(5,35,5) moved into negative...
READ MORE
MEMBERS ONLY
SPY Follows Through on Piercing Pattern
by Arthur Hill,
Chief Technical Strategist, TrendInvestorPro.com
SPY followed through on the doji and piercing pattern with another modest gain on Thursday. The ETF closed up a mere .46%, but the white candlestick was once again rather long as SPY opened weak and closed fairly strong. So far, this looks like an oversold bounce within a downtrend...
READ MORE
MEMBERS ONLY
Microsoft Traces out an Island Reversal
by Arthur Hill,
Chief Technical Strategist, TrendInvestorPro.com
With a gap down, three day stall and gap up, Microsoft (MSFT) forged a bullish island reversal. Technically, the high of the 3-day consolidation is 24.31 and today's low is 24.32. The gap zone is one cent. Nevertheless, the essence of a island reversal is...
READ MORE
MEMBERS ONLY
SPY Forms an Uninspiring Piercing Pattern
by Arthur Hill,
Chief Technical Strategist, TrendInvestorPro.com
There is no real change on the charts as SPY continues to firm after Monday's gap down. The ETF formed a doji on Monday, which indicates indecision. After a weak open on Wednesday, SPY recovered and closed above 132 to form a white candlestick that closed above the...
READ MORE
MEMBERS ONLY
Charts: AAPL,APA,APC,APOL, CCI,DNR,EXP,IPG,PLCE,SCMR
by Arthur Hill,
Chief Technical Strategist, TrendInvestorPro.com
AAPL Hits Support Zone.
APOL Breaks Support.
SCMR Forms Large Bullish Engulfing.
Plus APA,APC,CCI,DNR,EXP,IPG,PLCE,SCMR.
***********************************************
This commentary and charts-of-interest are designed to stimulate thinking. This analysis is not a recommendation to buy, sell, hold or sell short any security (stock ETF or...
READ MORE
MEMBERS ONLY
Renko Chart Shows a Clear Level to Beat for DIA
by Arthur Hill,
Chief Technical Strategist, TrendInvestorPro.com
Renko charts filter out the noise by requiring minimum price moves before the plot changes. This Renko chart shows the Dow Industrials SPDR (DIA) based on closing prices with 50 cents as the minimum move. A clear decline has taken shape in May with resistance at 125.
Click this image...
READ MORE
MEMBERS ONLY
SPY Firms After Gap, But Remains within Falling Flag
by Arthur Hill,
Chief Technical Strategist, TrendInvestorPro.com
After recording a fresh 52-week high four weeks ago, SPY declined in May and formed a falling flag or wedge. First, 52-week highs occur in uptrends, not downtrends. Second, SPY remains above the mid April reaction low and has yet to forge a lower low. Downtrends require lower...
READ MORE
MEMBERS ONLY
F5 Networks Gets Sandwiched Between Two Key Moving Averages
by Arthur Hill,
Chief Technical Strategist, TrendInvestorPro.com
F5 Networks (FFIV) first broke below its 50-day SMA in January and then its 200-day moving average in March. The stock recovered with a break back above the 50-day in May, but has yet to reclaim the 200-day. The next moving average to break could hold...
READ MORE
MEMBERS ONLY
SPY Becomes Oversold in Short-term Downtrend
by Arthur Hill,
Chief Technical Strategist, TrendInvestorPro.com
With big gaps and sharp declines, the major index ETFs became oversold within short-term downtrends. This is a tricky situation because the medium-term trends (daily charts) remain up. The May decline, while sharp, is still viewed as a correction within a bigger uptrend. Picking the bottom for this...
READ MORE
MEMBERS ONLY
Charts: AKAM,FLEX,MON,PHM, QCOM,SLB,TEVA,$TNX,USL,WNR
by Arthur Hill,
Chief Technical Strategist, TrendInvestorPro.com
AKAM Forms Island Reversal.
MON Bucks the Market with a Breakout.
QCOM Consolidates above Breakout.
Plus FLEX,PHM,SLB,TEVA,$TNX,USL,WNR.
***********************************************
This commentary and charts-of-interest are designed to stimulate thinking. This analysis is not a recommendation to buy, sell, hold or sell short any security (stock...
READ MORE
MEMBERS ONLY
The Netherlands and Greece Show Relative weakness in Europe
by Arthur Hill,
Chief Technical Strategist, TrendInvestorPro.com
The PerfChart shows the year-to-date performance for six European stock indices. Surprisingly, the Italian Milan Index ($MIB) is the best performing. Germany is a close second though. It is also surprising to see the Netherlands Index ($AEX) down for the year and showing relative weakness.
Click this image...
READ MORE
MEMBERS ONLY
SPY, QQQ and IWM Affirm Resistance with Downturns
by Arthur Hill,
Chief Technical Strategist, TrendInvestorPro.com
The Nasdaq 100 ETF (QQQ) broke support with a sharp decline and broken support turned into resistance over the last few days. After hitting resistance last Thursday, the ETF turned lower on Friday. Even though Friday's decline was modest, a clear reaction high formed with resistance in the...
READ MORE
MEMBERS ONLY
Gold Miners ETF Bounces off Major Support Level
by Arthur Hill,
Chief Technical Strategist, TrendInvestorPro.com
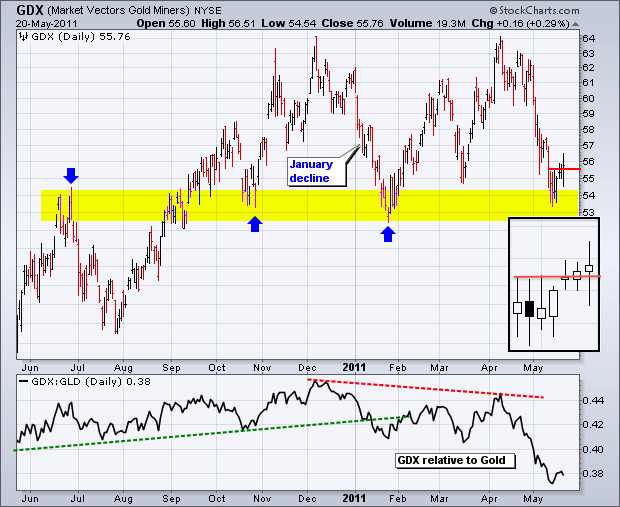
After getting slammed with a 10+ percent decline in May, the Gold Miners ETF (GDX) hit support and bounced over the last few days. As the chart below shows, this is no ordinary support level for GDX. Support in the 53 area stems from broken resistance and at least two...
READ MORE
MEMBERS ONLY
S&P Sector Carpet Shows Red in the Consumer Discretionary Sector
by Arthur Hill,
Chief Technical Strategist, TrendInvestorPro.com
The consumer discretionary sector is seeing serious red over the last two days. The S&P Sector Carpet shows 2-day price performance for various stocks in the nine sectors. Four of the five weakest stocks come from this most economically sensitive sector. Namely, retailers were weak the last...
READ MORE
MEMBERS ONLY
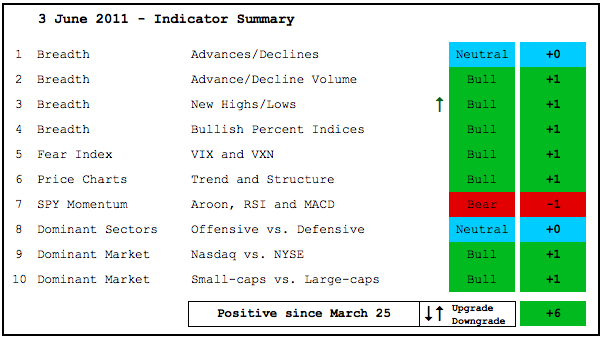
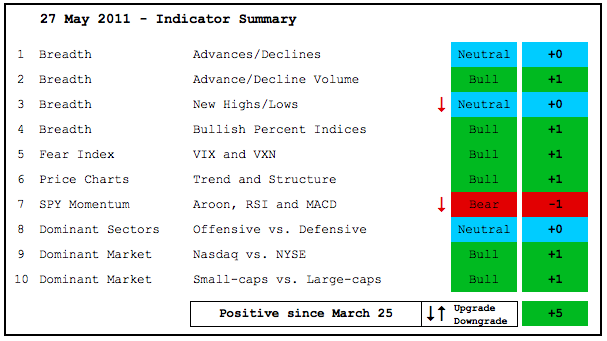
SPY Momentum and Nasdaq Breadth Are Concerns
by Arthur Hill,
Chief Technical Strategist, TrendInvestorPro.com
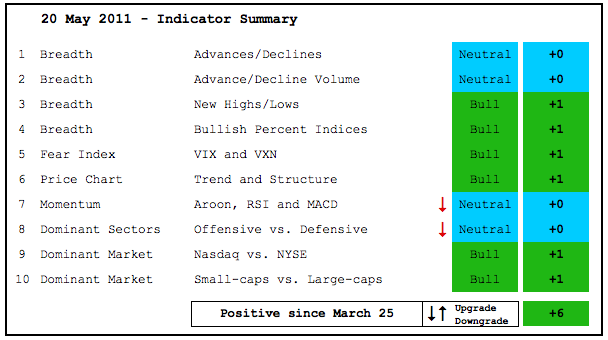
The indicator summary remains firmly positive, but downgrades in momentum and continued weakness in Nasdaq breadth are a concern. Even though SPY hit a 52-week high in April, RSI did not exceed 70 and failed to confirm strength. Also notice that 20-day Aroon for SPY dipped below -50...
READ MORE
MEMBERS ONLY
QQQ, IWM and SPY Hit Short-Term Resistance Zones
by Arthur Hill,
Chief Technical Strategist, TrendInvestorPro.com
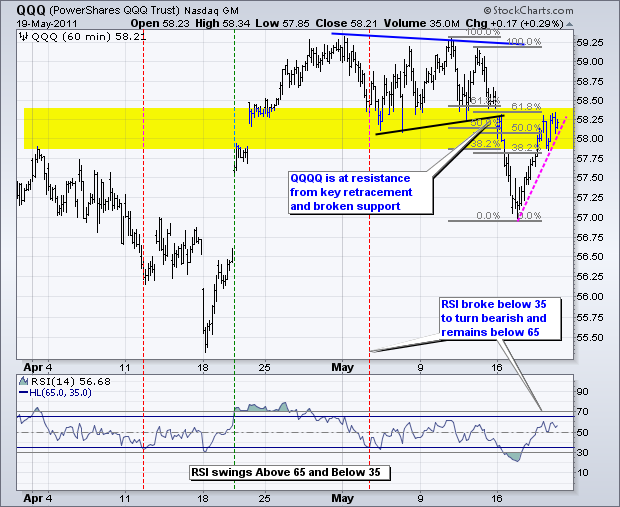
QQQ is at its make-or-break point for this oversold bounce. The ETF moved back into the broken support zone, which turns into resistance. There is also resistance in the 58.25 area from the 62% retracement cluster. The pink trendline marks the rate of ascent over the last...
READ MORE
MEMBERS ONLY
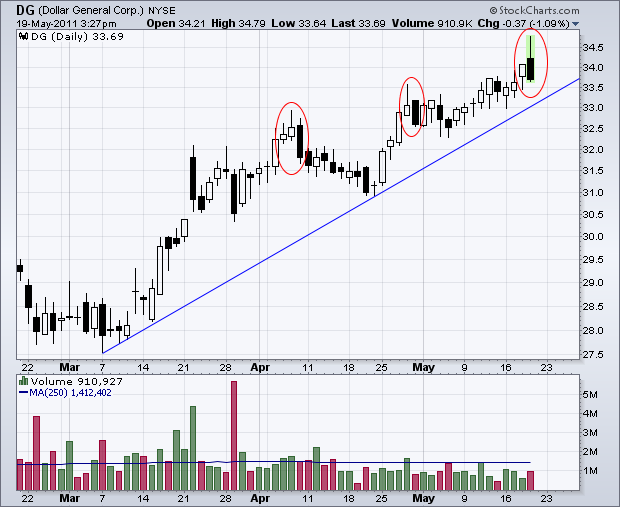
Dollar General Set to Appear on Bearish Engulfing Scan
by Arthur Hill,
Chief Technical Strategist, TrendInvestorPro.com
With a strong open and decline into the close, Dollar General (DG) is set form a bearish engulfing pattern with a long upper shadow. This is the third such pattern in the last two months. Watch the trendline extending up from the March low for a break to confirm this...
READ MORE
MEMBERS ONLY
RSI Forms A Bearish Failure Swing on SPY Chart
by Arthur Hill,
Chief Technical Strategist, TrendInvestorPro.com
Looking the daily chart for SPY, I am struck by the fact that 14-day RSI did not reach overbought levels in late April or early May. The surge from the mid March low to the early May high was quite strong. SPY advanced over 8% in 6-7 weeks....
READ MORE
MEMBERS ONLY
Charts of Interest: AMAT, ETR, GOOG, PMCS, TKC, UBS
by Arthur Hill,
Chief Technical Strategist, TrendInvestorPro.com
Charts of Interest: AMAT Tests Key Support Level. ETR Forms Flag After Gap. GOOG Forms Large Bullish Engulfing. Plus PMCS, TKC and UBS.
***********************************************
This commentary and charts-of-interest are designed to stimulate thinking. This analysis is not a recommendation to buy, sell, hold or sell short any security (stock...
READ MORE
MEMBERS ONLY
Shanghai Composite Firms at Key Retracement
by Arthur Hill,
Chief Technical Strategist, TrendInvestorPro.com
With a 6.5% decline from its April high, the Shanghai Composite ($SSEC) has been one of the weaker world indices this spring. Despite relative weakness, the index is trying to firm in a support zone that centers around the 62% retracement. Last week's high marks the first...
READ MORE
MEMBERS ONLY
Gold and Euro Firm at Support as SPY HIts Key Retracement
by Arthur Hill,
Chief Technical Strategist, TrendInvestorPro.com
The Gold SPDR (GLD) is at support and looks ripe for an oversold bounce. The mid April trendline, broken resistance and the early May spike low mark support in the 144 area. A falling channel defines the short-term downtrend. Look for a surge off support for the first bullish...
READ MORE
MEMBERS ONLY
A Cluster of Long White Candlesticks for ASEI
by Arthur Hill,
Chief Technical Strategist, TrendInvestorPro.com
American Science and Engineering ($ASEI) broke support at the beginning of May, but the bulls are not giving up easily as the stock formed at least four really long white candlesticks since then. A long white or hollow candlestick indicates that the close is above the open. These candlesticks reflect...
READ MORE