MEMBERS ONLY
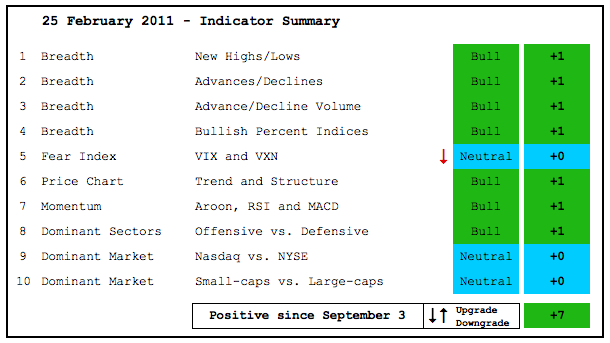
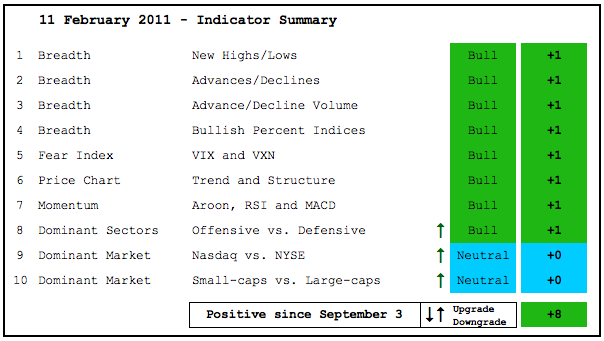
Indicator Summary Starts Seventh Positive Month
by Arthur Hill,
Chief Technical Strategist, TrendInvestorPro.com
Even though stocks may seem overbought and ripe for a correction, there are simply no signs of concerted selling pressure in the market right now. We saw a 3-4 day decline last week and a one day decline on Monday, but both were followed by sharp advances. As such, the...
READ MORE
MEMBERS ONLY
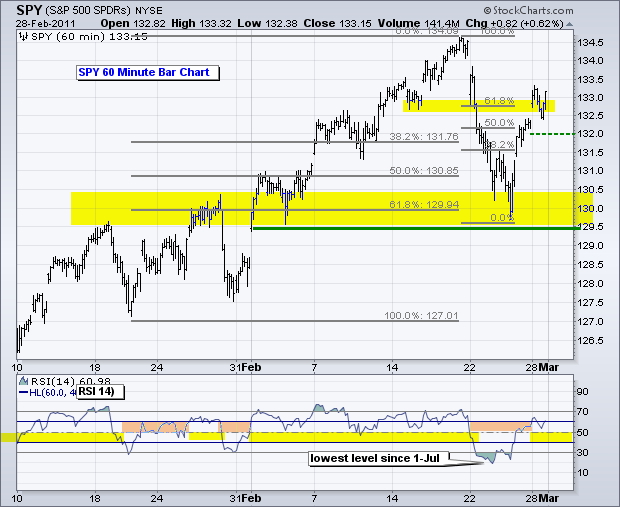
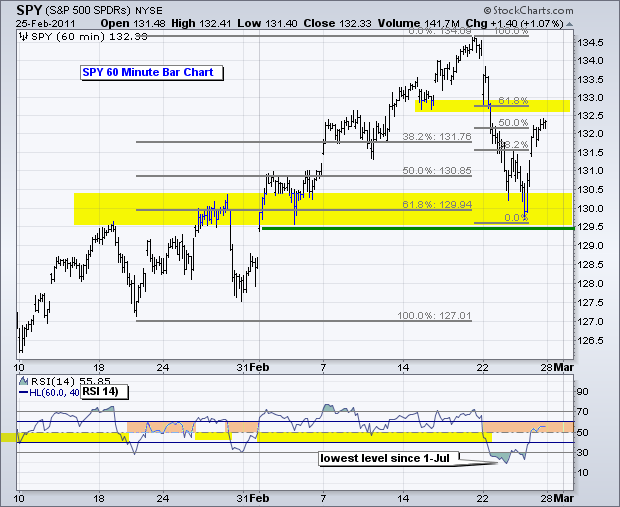
SPY Surges off Support as RSI Breaks Consolidation
by Arthur Hill,
Chief Technical Strategist, TrendInvestorPro.com
The bulls are simply not to be denied. Despite a gap down and sharp decline last week as well as a bearish engulfing on Monday, stocks firmed above last week's low and SPY surged above 133 on Thursday. This is why I look at an array of indicators...
READ MORE
MEMBERS ONLY
Industrials Lead the Way by Lighting up the Market Carpet
by Arthur Hill,
Chief Technical Strategist, TrendInvestorPro.com
The S&P Sector Market Carpet provides an easy visual to identify the leaders and laggards over a given timeframe. Clicking on the sector name puts the focus on that sector. Hover over the squares to see the name, ticker and percent change. Robert Half (RHI), a new-school industrial...
READ MORE
MEMBERS ONLY
SPY and RSI Coil to Form Tentative Triangles
by Arthur Hill,
Chief Technical Strategist, TrendInvestorPro.com
With a little firmness on Wednesday, we can draw a tentative trendline extending up from last week's low to form a volatile triangle over the last 8 trading days. Technically, the short-term trend is still up. SPY had a huge run the first three weeks of February and...
READ MORE
MEMBERS ONLY
Charts of Interest: ACI,AEO, GILD,HAS,IGT,LOGI
by Arthur Hill,
Chief Technical Strategist, TrendInvestorPro.com
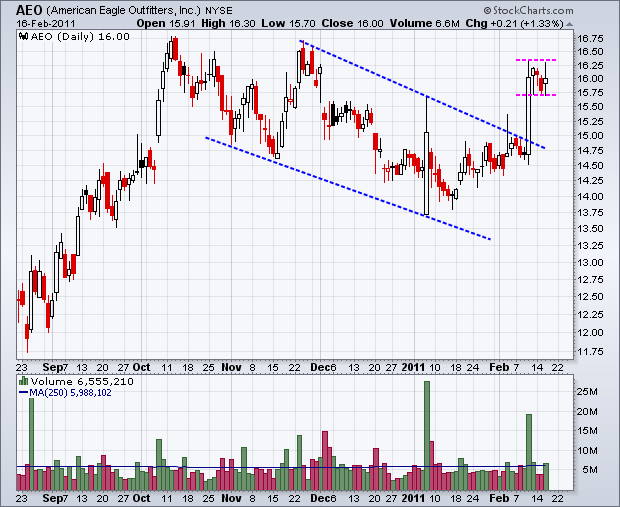
ACI Forms Triangle. AEO Firms at Key Retracement. LOGI Consolidates After Breakout. Plus GILD,HAS,IGT
-----------------------------------------------------------------------------
This commentary and charts-of-interest are designed to stimulate thinking. This analysis is not a recommendation to buy, sell, hold or sell short any security (stock ETF or otherwise). We all need to think...
READ MORE
MEMBERS ONLY
Costco Forms Bearish Engulfing Near Prior High
by Arthur Hill,
Chief Technical Strategist, TrendInvestorPro.com
A bearish engulfing forms when a long black candlestick engulfs the body of the prior white candlestick. This means the open is above the prior close and the close is below the prior open. It is a reversal day that can foreshadow lower prices. Costco formed such a pattern on...
READ MORE
MEMBERS ONLY
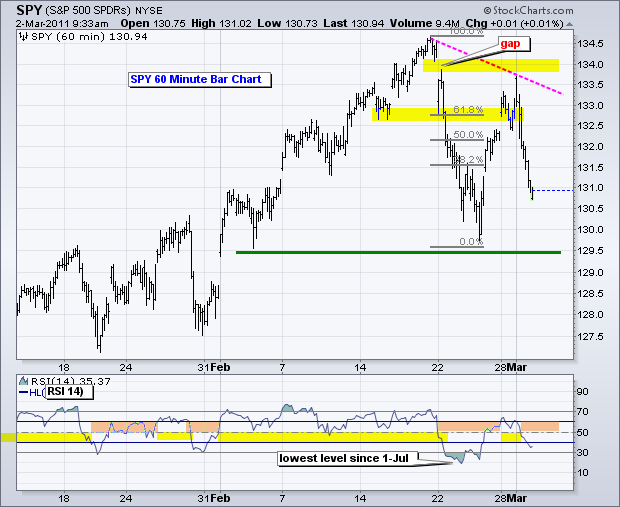
SPY Fails at Gap and Forms Big Bearish Engulfing
by Arthur Hill,
Chief Technical Strategist, TrendInvestorPro.com
The 7-month streak of first day-of-month gains was broken on March 1st as stocks declined rather sharply. SPY surged to resistance around 132.5-133 on Monday and opened above 133.5 on Tuesday. This early gap did not hold as the ETF quickly reversed and moved sharply lower. Last week&...
READ MORE
MEMBERS ONLY
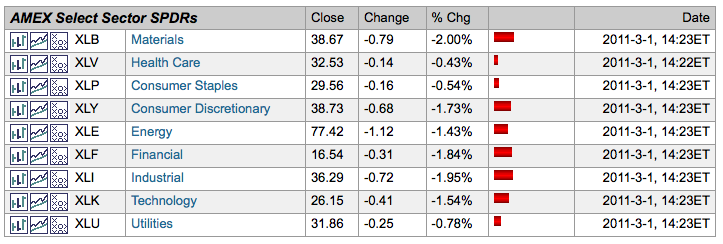
Sector Action Turns Defensive on Market Summary Page
by Arthur Hill,
Chief Technical Strategist, TrendInvestorPro.com
All sectors were down in afternoon trading on Tuesday, but some were down less than others. In particular, the Utilities SPDR (XLU), Consumer Staples SPDR (XLP) and Healthcare SPDR (XLV) were holding up relatively well with modest losses. Money can be seen moving out materials, consumer discretionary, finance, industrials and...
READ MORE
MEMBERS ONLY
SPY Attempts to Extend Streak of Gains on First Day of Month
by Arthur Hill,
Chief Technical Strategist, TrendInvestorPro.com
The magical first day of the month is upon us. Among others, bespokeinvest.com notes that the S&P 500 has gained 14 of the last 16 times on the first day of the month. The last two down days were the first days of June and July 2010....
READ MORE
MEMBERS ONLY
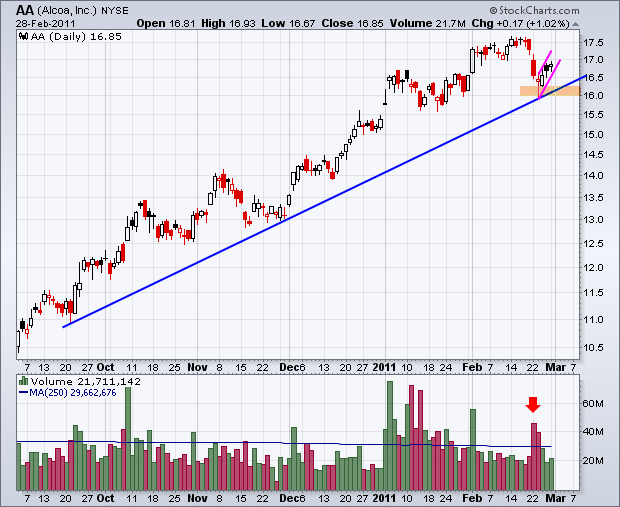
Charts of Interest: AA,AKS,F, GOOG,GS,ROL,RTN
by Arthur Hill,
Chief Technical Strategist, TrendInvestorPro.com
AA bounces on low volume. GOOG trades flat for 4 months. GS holds gap down. Plus AKS,F,ROL,RTN
-----------------------------------------------------------------------------
This commentary and charts-of-interest are designed to stimulate thinking. This analysis is not a recommendation to buy, sell, hold or sell short any security (stock ETF or otherwise). We...
READ MORE
MEMBERS ONLY
Dollar Cannot Hold a Bid as it Eyes October-November Lows $USD
by Arthur Hill,
Chief Technical Strategist, TrendInvestorPro.com
The US Dollar Index ($USD) extended its losses on Monday with a decline below 77. After a two week fall, the index is near its early February low. This level may offer support, but the trend is clearly down after the failure at 79 and wedge break. The next real...
READ MORE
MEMBERS ONLY
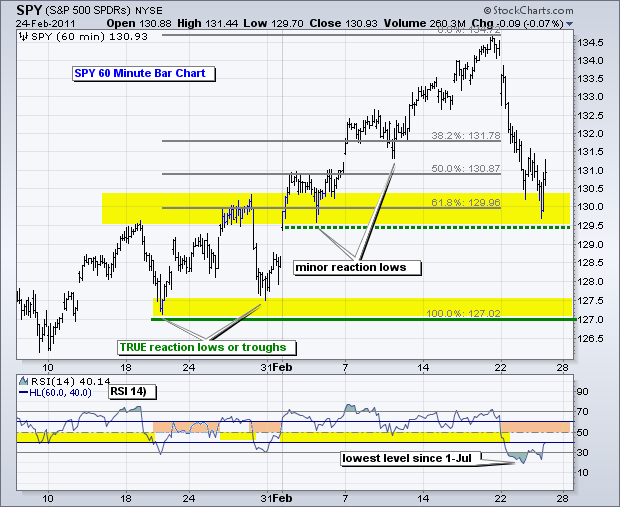
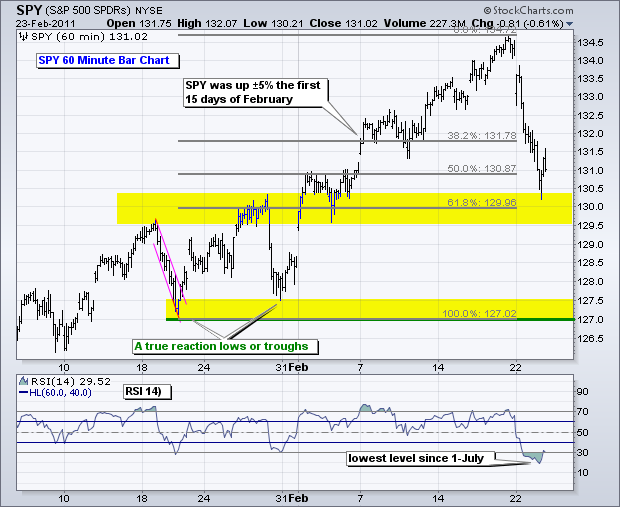
SPY Bounces from one Retracement to Another
by Arthur Hill,
Chief Technical Strategist, TrendInvestorPro.com
On the 60-minute chart, the S&P 500 ETF (SPY) firmed at support around 130 mid-week and bounced back above 132 on Friday. The 62% retracement and broken resistance marked this support zone. In addition, SPY was oversold and overbought $VIX suggested that stocks were ripe for a mean-reversion...
READ MORE
MEMBERS ONLY
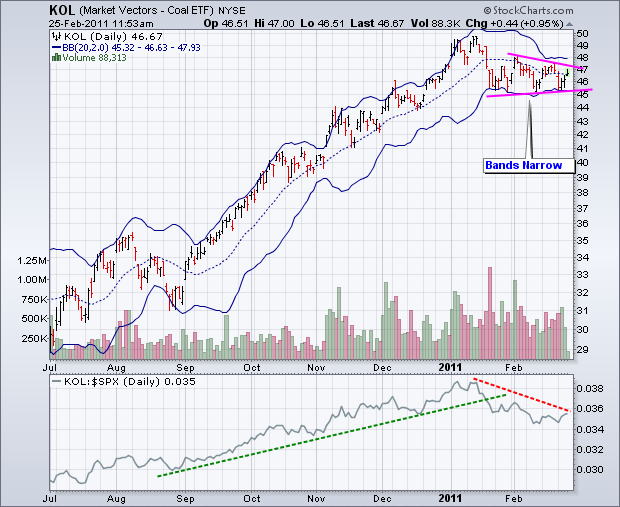
Bollinger Bands Narrows as Coal Vectors ETF Consolidates
by Arthur Hill,
Chief Technical Strategist, TrendInvestorPro.com
The Coal Vectors ETF (KOL) has been stuck in a tightening trading range the last five weeks. After the sharp January decline, the ETF formed a triangle in February. As volatility decreased, the Bollinger Bands contracted to their narrowest range since early November, seen of a triangle breakout. Watch the...
READ MORE
MEMBERS ONLY
Indicator Summary Remains Firmly Positive
by Arthur Hill,
Chief Technical Strategist, TrendInvestorPro.com
Despite a sharp decline in stocks this week, the indicator summary remains firmly positive. Don't forget that the major index ETFs, most sector SPDRs, the AD Lines and the AD Volume Lines all recorded new 52-week highs just last week. Such highs occur in big uptrends, not big...
READ MORE
MEMBERS ONLY
SPY Firms at Short-term Support
by Arthur Hill,
Chief Technical Strategist, TrendInvestorPro.com
On the 60-minute chart, SPY continues to firm at support around 130. This support zone stems from broken resistance levels and a 62% retracement of the advance from the late January lows to the mid February highs. There have been a couple of bounce attempts in the last two days,...
READ MORE
MEMBERS ONLY
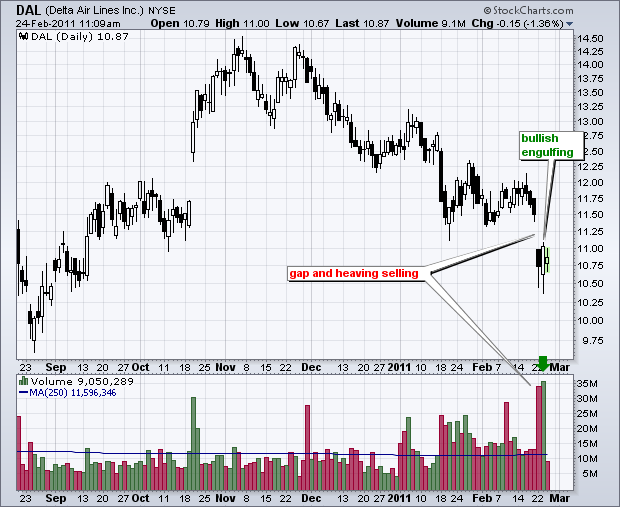
Delta Airlines Forms Big Bullish Engulfing after Gap
by Arthur Hill,
Chief Technical Strategist, TrendInvestorPro.com
Delta Airlines (DAL) came across the bullish engulfing scan on the predefined scans page. The stock gapped lower and declined with heaving volume on Tuesday. This decline was countered with a bullish engulfing on Wednesday with even higher volume. The stock is stalling Thursday and needs to break the Wednesday&...
READ MORE
MEMBERS ONLY
Breadth Turns Mixed as SPY Bounces at Key Retracement
by Arthur Hill,
Chief Technical Strategist, TrendInvestorPro.com
On the 60-minute chart, the S&P 500 ETF (SPY) hit the main support zone around 130 on Wednesday afternoon and bounced. This bounce does not look that strong though as stocks sold off in the final 30 minutes of trading. A strong bounce would have finished strong. With...
READ MORE
MEMBERS ONLY
Charts of Interest: BBY, CL, IMN, MHS, RTN, T
by Arthur Hill,
Chief Technical Strategist, TrendInvestorPro.com
BBY Hits Long-term Support Zone. CL Forms Triangle Consolidation. IMB Forms Bull Wedge. Plus MHS, RTH and T.
This commentary and charts-of-interest are designed to stimulate thinking. This analysis is not a recommendation to buy, sell, hold or sell short any security (stock ETF or otherwise). We all need to...
READ MORE
MEMBERS ONLY
Positive Relationship between the Nikkei and the US 10-year T-Note Yield
by Arthur Hill,
Chief Technical Strategist, TrendInvestorPro.com
It may seem a rather strange relationship, but the Nikkei 225 ($NIKK) and the 10-year Treasury Yield ($TNX) have a positive relationship working. The chart below shows both rising and falling together since November 2009. Despite a setback over the last few days, both remain in uptrends overall. John Murphy...
READ MORE
MEMBERS ONLY
SPY Hits First Support Zone as Euro Challenges Resistance
by Arthur Hill,
Chief Technical Strategist, TrendInvestorPro.com
On the 60-minute chart, the S&P 500 ETF (SPY) hit its first support zone in the 131.5 area. This zone stems from the consolidation the second week of February. It is important to note that the gap down held and the ETF continued lower after the first...
READ MORE
MEMBERS ONLY
A Double Top Point & Figure Breakout for H&R Block
by Arthur Hill,
Chief Technical Strategist, TrendInvestorPro.com
A 25-cent daily Point & Figure chart for HR Block ($HRB) captures price action all the way back to July 2009. These X's and O's show the stock moving lower throughout 2010 and firming towards yearend. 2011 has been better with a double top breakout last...
READ MORE
MEMBERS ONLY
Stocks Brace for Big Hit as Flight-to-Safety Trade Takes Over
by Arthur Hill,
Chief Technical Strategist, TrendInvestorPro.com
Unrest in Libya is sparking the flight to safety trade in a big way. Libya produces around 1.8 million barrels of oil per day and accounts for a 2% of global output. Even though Saudia Arabia has around 3 million barrels of spare capacity, the market is concerned that...
READ MORE
MEMBERS ONLY
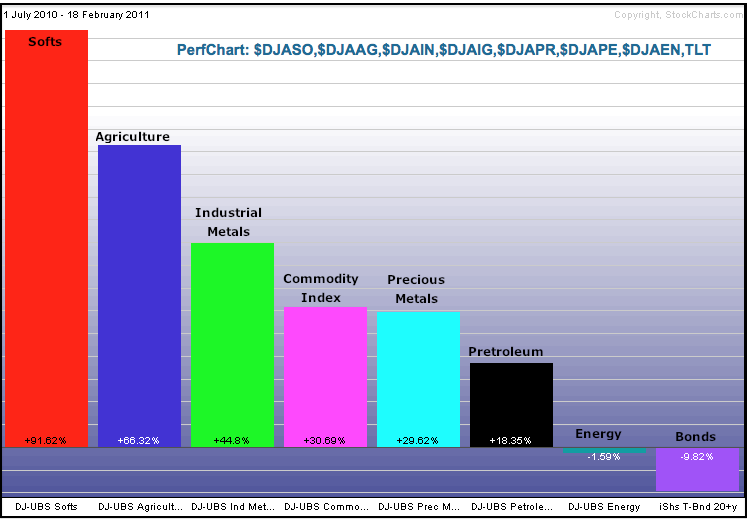
AGRICULTURAL COMMODITIES LEAD BROAD COMMODITY RALLY
by Arthur Hill,
Chief Technical Strategist, TrendInvestorPro.com
Except for natural gas, most major commodities and commodity groups are up sharply over the last 6-8 months. Stockcharts.com provides a broad range of Dow Jones-UBS commodity related indices. The PerfChart below shows seven commodity related indices and the 20+ year Bond ETF (TLT). Five represent major commodity groups....
READ MORE
MEMBERS ONLY
Candlestick Charts for the Most Active List in One Click
by Arthur Hill,
Chief Technical Strategist, TrendInvestorPro.com
The NYSE and Nasdaq most active lists are displayed on the Free Charts page and updated throughout the day. Seven of the ten most active on the NYSE were down in early trading on Friday. Seven of ten were up on the Nasdaq. Chartists can see charts for all ten...
READ MORE
MEMBERS ONLY
Indicator Summary Remains Firmly Positive
by Arthur Hill,
Chief Technical Strategist, TrendInvestorPro.com
There is no change in the indicator summary. The AD Lines and AD Volume Line both surged to new 52-week highs this week. Major bearish reversals in the stock market are often preceded by bearish divergence in one or more of these indicators. With fresh 52-week highs, bearish divergences are...
READ MORE
MEMBERS ONLY
Bulls Continue to Run up the Score/SPY
by Arthur Hill,
Chief Technical Strategist, TrendInvestorPro.com
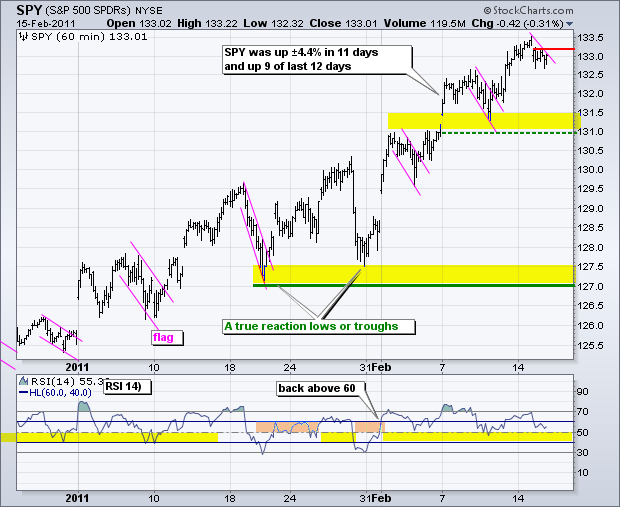
As you might expect, there is no change in the medium-term trend (daily chart) or short-term trend (60-minute chart). SPY is now up over 5% this month with gains on 11 of the last 14 days. In January, the index zigzagged higher with a choppy advance from ±125.5 to...
READ MORE
MEMBERS ONLY
Dow Transports Finally Confirm Dow Industrials
by Arthur Hill,
Chief Technical Strategist, TrendInvestorPro.com
Dow Theory is built on the concept of confirmation. The Dow Transports should confirm a higher high in the Dow Industrials and visa versa. Failure to confirm signals that something might amiss. The Dow Industrials has been forging new highs throughout the month and the Dow Transports just made it...
READ MORE
MEMBERS ONLY
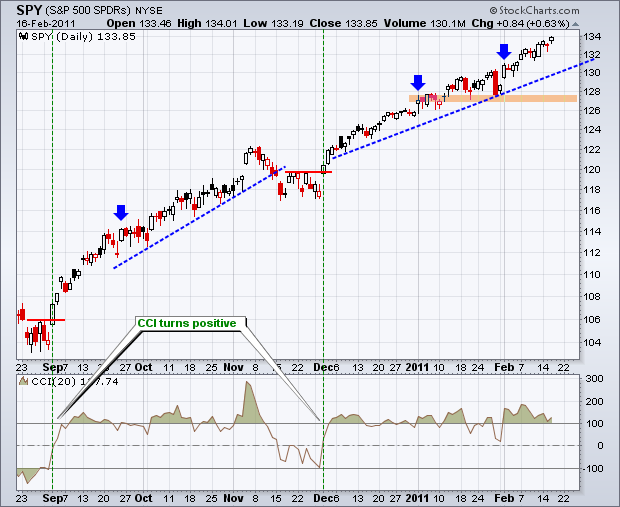
Watching Trendline Support as SPY Grinds Higher
by Arthur Hill,
Chief Technical Strategist, TrendInvestorPro.com
On the daily chart SPY surged on 1-Feb with a gap and long white candlestick that closed above 130. The advance continued after this surge with a grind higher. We can see bigger surge-grind patterns starting with the early September surge and the early December surge (green dotted lines). There...
READ MORE
MEMBERS ONLY
Charts of interest: AEO,CHRW, NEM,INTC,KSS,LUB,QLGC,T
by Arthur Hill,
Chief Technical Strategist, TrendInvestorPro.com
CHRW consolidates at support. NEM breaks short-term resistance. KSS breaks wedge resistance with volume. Plus AEO, INTC, LUB, QLGC and T
-----------------------------------------------------------------------------
This commentary and charts-of-interest are designed to stimulate thinking. This analysis is not a recommendation to buy, sell, hold or sell short any security (stock ETF or otherwise)...
READ MORE
MEMBERS ONLY
Lumber and Homebuilder ETF Continues their Uptrends
by Arthur Hill,
Chief Technical Strategist, TrendInvestorPro.com
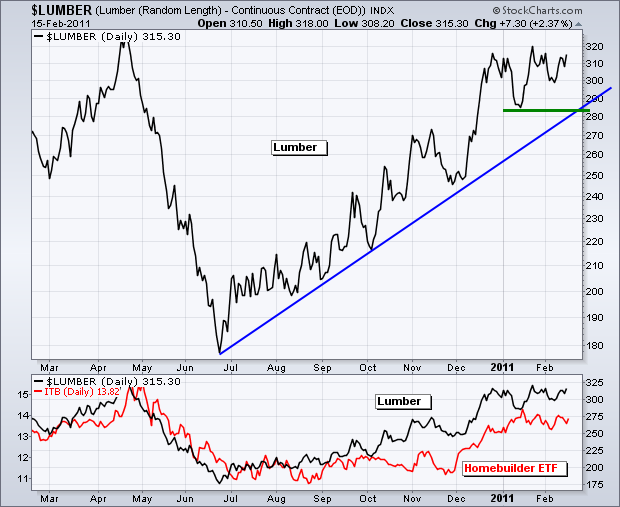
The Lumber Continuous Futures ($LUMBER) remains in a clear uptrend with a series of higher highs and higher lows since late June. This advance (roughly) corresponds with an advance in the Home Construction iShares (ITB). ITB was a little shakey in October-November, but the etf has been moving higher since...
READ MORE
MEMBERS ONLY
SPY: No Change and No Significant Selling Pressure
by Arthur Hill,
Chief Technical Strategist, TrendInvestorPro.com
There is no change in the analysis for the 60-minute chart and daily chart. SPY gapped up the last two Monday's and both gaps held. The advance appears to be accelerating in February. Notice the sharp advances followed by short pullbacks this month. Yesterday's pullback stopped...
READ MORE
MEMBERS ONLY
Intel Forms Bearish Harami Near Resistance
by Arthur Hill,
Chief Technical Strategist, TrendInvestorPro.com
Intel is meeting some pretty stiff resistance around 22, but the overall trend remains up. The stock formed a big bearish engulfing in early December and a harami on Thursday-Friday. Even though harami are potentially bearish candlestick patterns, confirmation is required with some downside. Namely, look for a break below...
READ MORE
MEMBERS ONLY
Dueling Wedges for the Euro and Gold - Stocks Remain Strong
by Arthur Hill,
Chief Technical Strategist, TrendInvestorPro.com
There are dueling wedges for the Euro Currency Trust (FXE) and the Gold SPDR (GLD). FXE remains in a downtrend with a falling wedge, while GLD remains in an uptrend with a rising wedge. FXE broke support the first week of February, formed a lower high last week and moved...
READ MORE
MEMBERS ONLY
Charts:ANF,BBBY,BRCM, BSX,CME,GILD,INTC,SWY
by Arthur Hill,
Chief Technical Strategist, TrendInvestorPro.com
ANF stalls near key retracement. BRCM shows relative weakness. INTC forms harami near resistance.
Plus BBBY, BSX, CME, GILD and SWY
-----------------------------------------------------------------------------
This commentary and charts-of-interest are designed to stimulate thinking. This analysis is not a recommendation to buy, sell, hold or sell short any security (stock ETF or otherwise)...
READ MORE
MEMBERS ONLY
Networking ETF Leads Tech Related ETFs Since Late August
by Arthur Hill,
Chief Technical Strategist, TrendInvestorPro.com
The PerfChart below shows five tech-relate ETFs along with the S&P 500 and the Nasdaq 100 ETF (QQQQ). All are up sharply since late August, but three are up more than 40%. The Networking iShares (IGN) is up some 48.4%, the Semiconductor HOLDRS (SMH) is up 45....
READ MORE
MEMBERS ONLY
SPY Defies Low Volume to Maintain Uptrend
by Arthur Hill,
Chief Technical Strategist, TrendInvestorPro.com
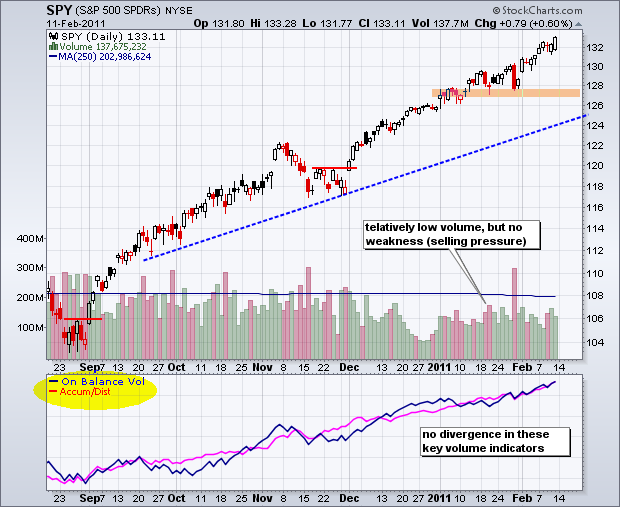
Despite low volume the last few months, the stock market continues to move higher. Let this be a lesson. Volume is an indicator that comes second to price action. In addition, overall volume is not as important as the balance of volume. Total volume may be low, but stocks can...
READ MORE
MEMBERS ONLY
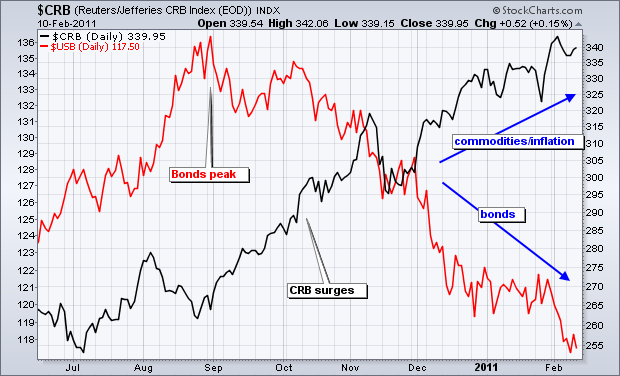
Bonds Spooked as 30% CRB Surge Points to Inflation
by Arthur Hill,
Chief Technical Strategist, TrendInvestorPro.com
Something has clearly spooked the bond market over the last five months. Looking at the CRB Index, that something appears to be inflationary pressures. The CRB Index bottomed in early July and advanced over 30% the last seven months. Bonds peaked two months after the CRB Index bottomed and declined...
READ MORE
MEMBERS ONLY
AD Volume Lines Hit Fresh 52-week Highs
by Arthur Hill,
Chief Technical Strategist, TrendInvestorPro.com
Three indicators were upgraded this week. With the three of the four key offensive sectors recording 52-week highs this week, I can hardly be bearish on this indicator. XLY, XLI and XLK hit new highs, while XLF remains close to its April high. Even though the Nasdaq has been underperforming...
READ MORE
MEMBERS ONLY
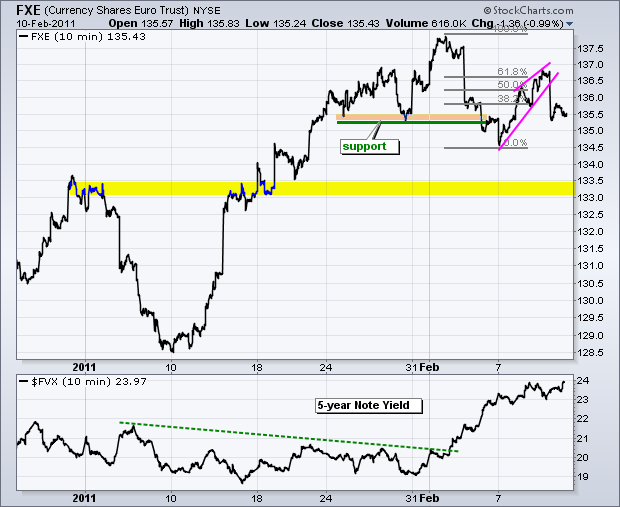
Euro Breaks Down, Gold Holds Breakout and Stocks Stall
by Arthur Hill,
Chief Technical Strategist, TrendInvestorPro.com
The Euro Currency Trust (FXE) broke down with a sharp decline, but the Gold SPDR (GLD) bounced after early weakness to hold well above support. I suspect that the Dollar is strengthening for a number of reasons. First, US interest rates surged in February. Second, turmoil in Egypt and the...
READ MORE
MEMBERS ONLY
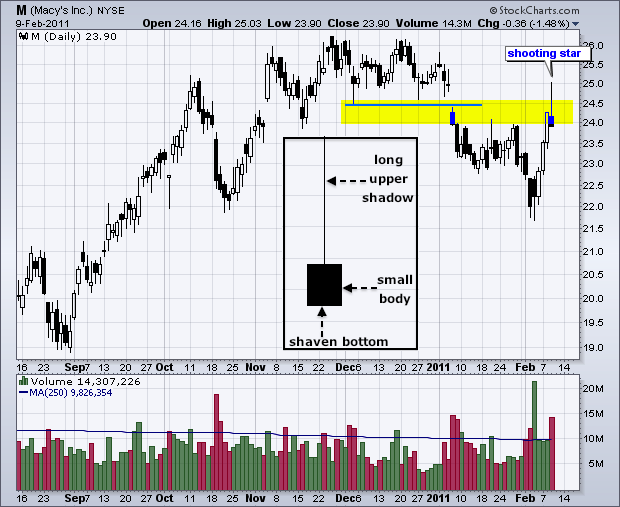
A Shooting Star for Macy's on the Predefined Stock Scans
by Arthur Hill,
Chief Technical Strategist, TrendInvestorPro.com
Macy's (M) was one of ten NYSE stocks showing up on the Shooting Star scan on the Predefined Scans page. After surging the prior three days, the stock hit resistance from broken support and formed a large shooting star on Wednesday. Note the small body, the long upper...
READ MORE