MEMBERS ONLY
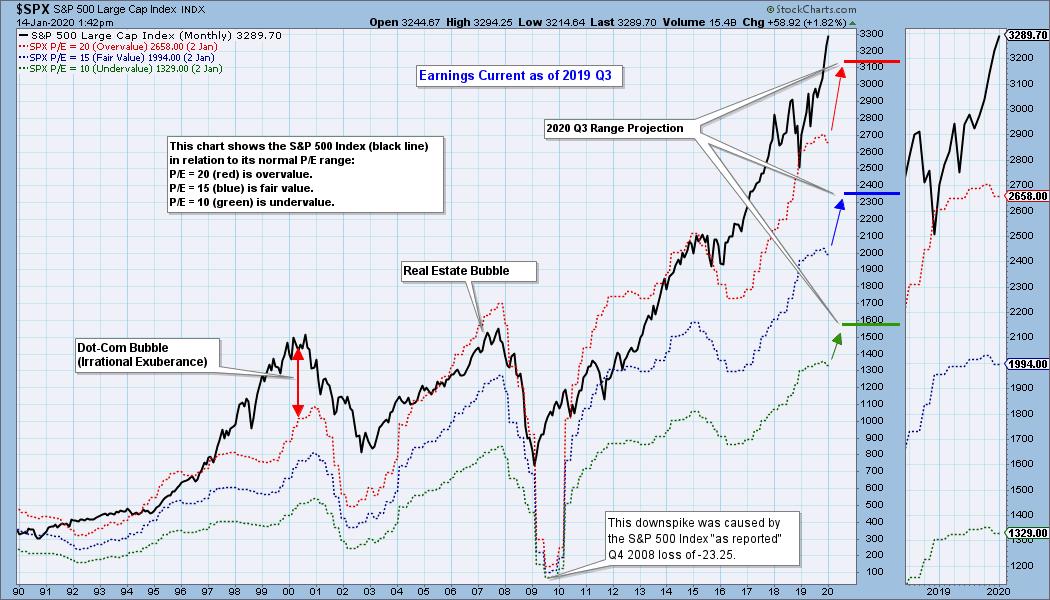
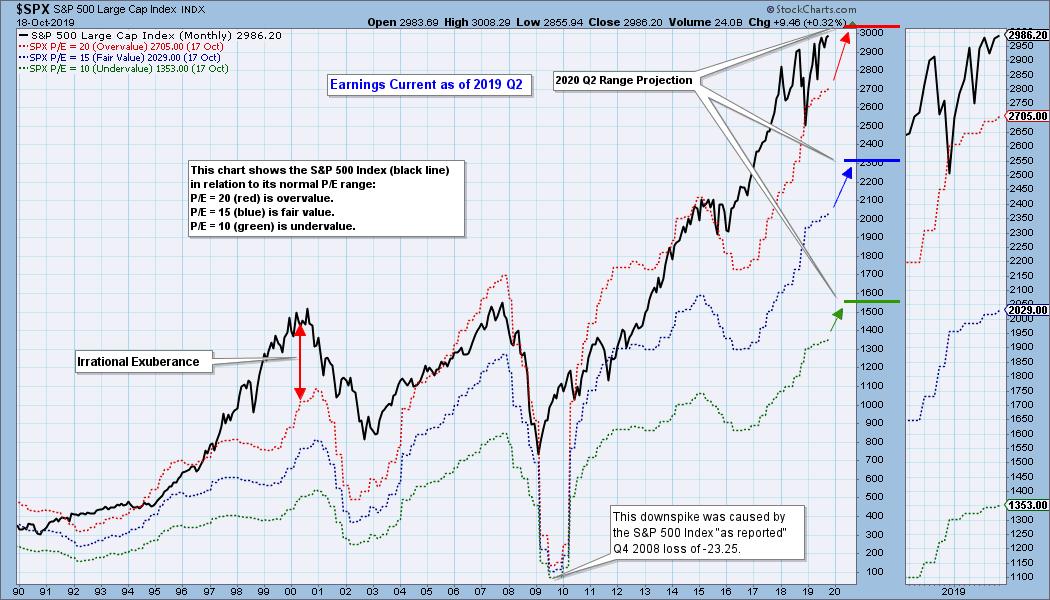
S&P 500 2019 Q3 EARNINGS: Market Is Way Overvalued
by Carl Swenlin,
President and Founder, DecisionPoint.com
The S&P 500 preliminary earnings for 2019 Q3 are available, and based upon GAAP (Generally Accepted Accounting Principals) earnings, the S&P 500 is beyond overvalued. The following chart shows us the normal value range of the S&P 500 Index, indicating where the S&...
READ MORE
MEMBERS ONLY
ETF Indexing, Carl's Scan and New ChartLists on DecisionPoint.com
by Erin Swenlin,
Vice President, DecisionPoint.com
by Carl Swenlin,
President and Founder, DecisionPoint.com
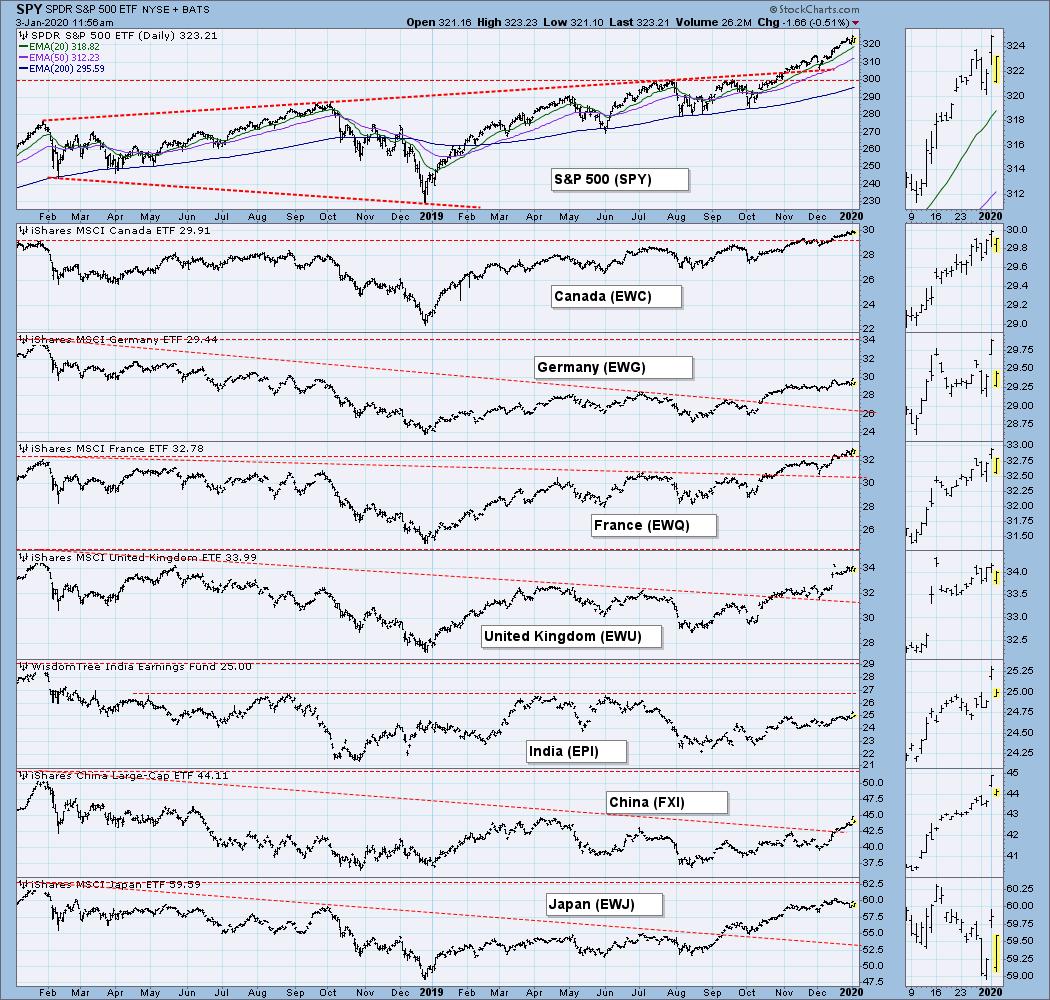
In this episode of DecisionPoint, Erin and Carl present their thoughts on the current market environment and the problems we should be aware of. Stocks above their 20/50/200-EMAs have negative divergences with the SPY price chart. Could ETF indexing be the next "bubble"? It seems the...
READ MORE
MEMBERS ONLY
DP Show: In the News - Oil Poised to Outperform? + GRAND OPENING of DecisionPoint.com
by Erin Swenlin,
Vice President, DecisionPoint.com
by Carl Swenlin,
President and Founder, DecisionPoint.com
DecisionPoint.comis live! In this episode ofDecisionPoint, Erin unveils the new DecisionPoint website and its features, including the new home of the DecisionPoint Alert and Daily Diamonds features and exclusive Sector ChartLists. In addition, Carl and Erin discuss the effect of rising instability in the Middle East on Oil prices,...
READ MORE
MEMBERS ONLY
DP ALERT WRAP: DecisionPoint.com -- Everything Old Is New Again!
by Carl Swenlin,
President and Founder, DecisionPoint.com
This will be the last free issue of the DecisionPoint ALERT. Last fall StockCharts.com changed its business model regarding our free content, and Erin and I need to embrace the subscription model if we are to continue doing what we do. Our new DecisionPoint.com website launched yesterday, and...
READ MORE
MEMBERS ONLY
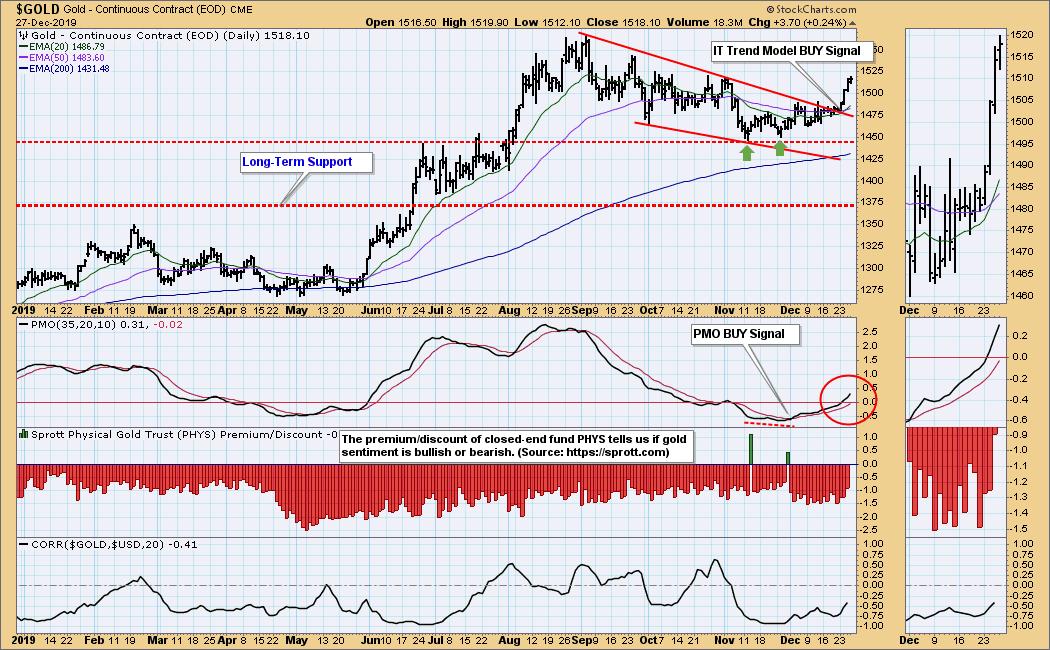
DP ALERT WEEKLY WRAP: Monthly Chart Review; New Gold BUY Signal
by Carl Swenlin,
President and Founder, DecisionPoint.com
On Thursday the gold 20EMA crossed up through the 50EMA, generating an IT Trend Model BUY signal. Notice also, that we had other indications alerting us that gold's price action was about to turn positive. There was a double bottom, followed immediately by the PMO crossing up through...
READ MORE
MEMBERS ONLY
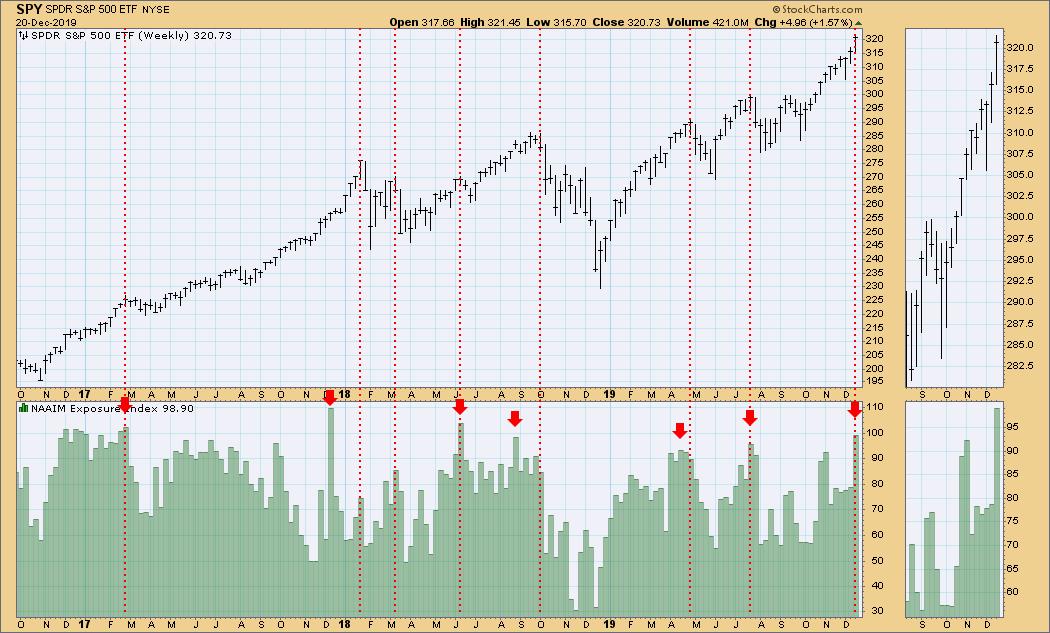
DP ALERT WEEKLY WRAP: Sentiment Getting Wildly Bullish
by Carl Swenlin,
President and Founder, DecisionPoint.com
I have been noticing on the business channels that analysts have become quite complacent regarding their market outlook. They remind me of the line from an old favorite song, "Nothing but blue skies do I see." Yesterday I posted the latest *NAAIM Exposure Index number and snapped to...
READ MORE
MEMBERS ONLY
DP Show: Market "Melting Up" - Drill Down Into XLE, XLU, XLV & XLK
by Erin Swenlin,
Vice President, DecisionPoint.com
by Carl Swenlin,
President and Founder, DecisionPoint.com
Is the market in the process of melting down - or melting up? In this episode of DecisionPoint, Carl and Erin discuss the implications they've made about the state of the market from the DecisionPoint indicators, including the new Golden and Silver Cross Indexes. Erin also demonstrates how...
READ MORE
MEMBERS ONLY
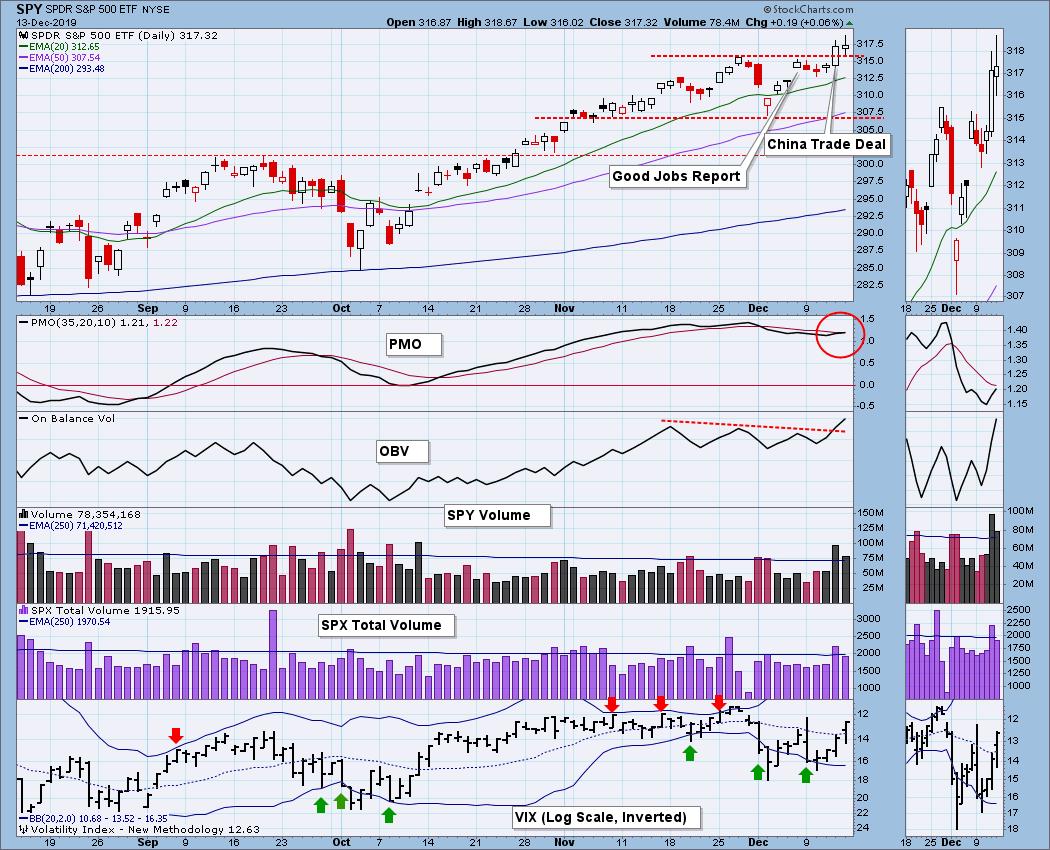
DP WEEKLY WRAP: Buy the News, Sell the Quibble
by Carl Swenlin,
President and Founder, DecisionPoint.com
In the last two weeks the S&P 500 has advanced about +3.75% from its low, and about 1.5% of that move was due to two days of news-generated rallies -- the favorable jobs report last week, and apparent successful completion if Phase I of the China...
READ MORE
MEMBERS ONLY
DP Show: NEW Sector ChartList + Carl Reviews Most-Active Stocks (AUD, MU and More)
by Erin Swenlin,
Vice President, DecisionPoint.com
by Carl Swenlin,
President and Founder, DecisionPoint.com
In this episode of DecisionPoint, Erin unveils the new DecisionPoint Sector ChartList, which combines the Golden and Silver Cross Indexes, Stocks Above 20/50-EMAs and the SCTR! She then studies XLE, XLU, XLRE and XLK in detail. Meanwhile, Carl gives the lowdown on DP Indicator action, before analyzing some of...
READ MORE
MEMBERS ONLY
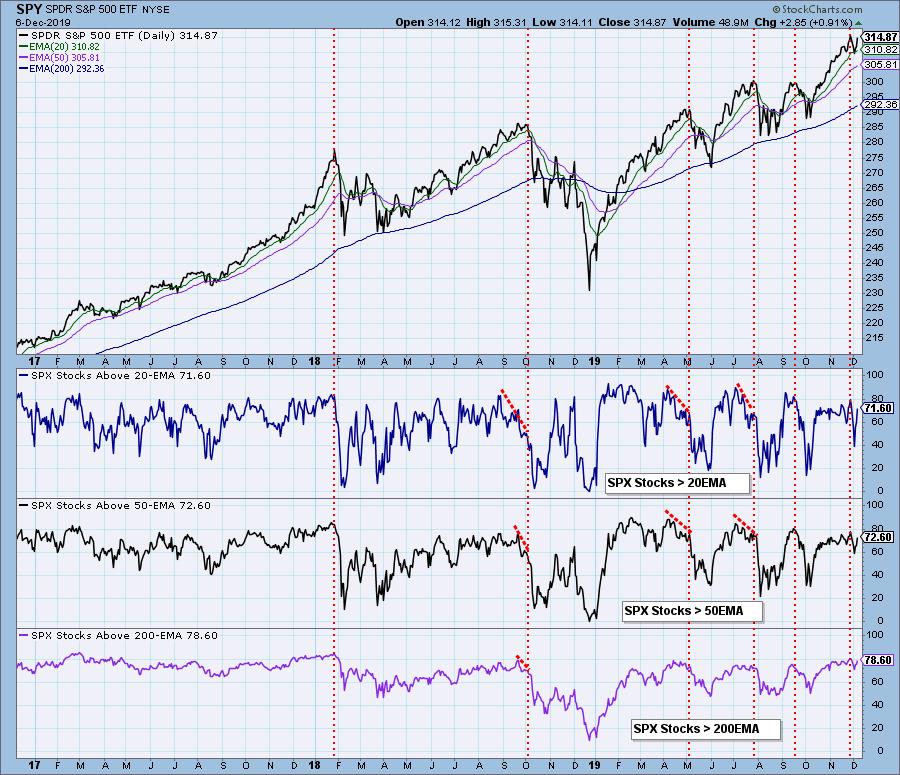
DP WEEKLY WRAP: Participation Not Robust but Adequate for the Moment
by Carl Swenlin,
President and Founder, DecisionPoint.com
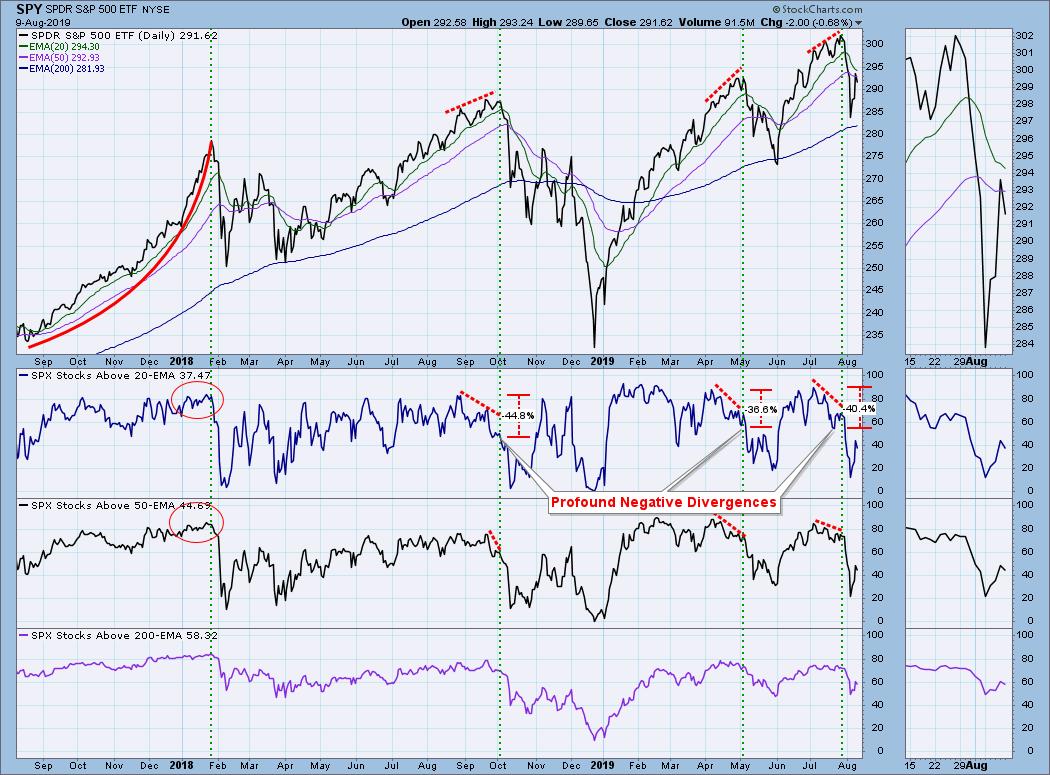
A good way to gauge participation in a particular market move is to check the percentage of stocks that are above their 20/50/200EMAs. The 20EMA indicator is short-term and most responsive, and we can see the deterioration that took place prior to some of the important price tops...
READ MORE
MEMBERS ONLY
DP Show: Humble Beginnings - Amazon (AMZN) & Google (GOOGL)
by Erin Swenlin,
Vice President, DecisionPoint.com
by Carl Swenlin,
President and Founder, DecisionPoint.com
In this episode of DecisionPoint, Carl and Erin look at a few recent DP Diamonds and present a review of other "in the news" stocks, including DIS, NHI, GE, AMZN and GOOGL. Additionally, the two analyze climactic readings on Advance/Declines and the VIX. This video originally aired...
READ MORE
MEMBERS ONLY
DP WEEKLY WRAP: Santa Keeps Rocking; Monthly Chart Time
by Carl Swenlin,
President and Founder, DecisionPoint.com
The current rally was launched off the early-October low. Since then, the market has entered a period of very low volatility, characterized by a reluctance to decline, and a penchant for small, daily advances. There was a high volume spike on Tuesday that I will attribute to traders going flat...
READ MORE
MEMBERS ONLY
DP Show: Sector Golden Cross/Silver Cross Indexes - Watch for Parabolic Moves
by Erin Swenlin,
Vice President, DecisionPoint.com
by Carl Swenlin,
President and Founder, DecisionPoint.com
In this episode of DecisionPoint, Carl and Erin kick off with a review of the broad markets and DecisionPoint indicators, before following up with an in-depth look at the new Golden and Silver Cross Indexes for each of the sectors. Carl takes a close look at the parabolic price move...
READ MORE
MEMBERS ONLY
DP ALERT WEEKLY WRAP: New Highs/Lows Moving In Wrong Direction
by Carl Swenlin,
President and Founder, DecisionPoint.com
When the market goes up, we normally expect new highs to expand and new lows to contract. So far this month, for Nasdaq Composite stocks, the opposite is happening, and that is a negative signat, at least for the short term. We should also note that an expansion of new...
READ MORE
MEMBERS ONLY
DP Show: Introducing the Golden Cross and Silver Cross Indexes
by Erin Swenlin,
Vice President, DecisionPoint.com
by Carl Swenlin,
President and Founder, DecisionPoint.com
In this episode of DecisionPoint, Carl and Erin introduce the new Golden Cross and Silver Cross Indexes. The new ChartList in the DecisionPoint Market Indicators ChartPack includes the indexes for not only the major markets, but ask those of the S&P sectors, along with a special "Gold...
READ MORE
MEMBERS ONLY
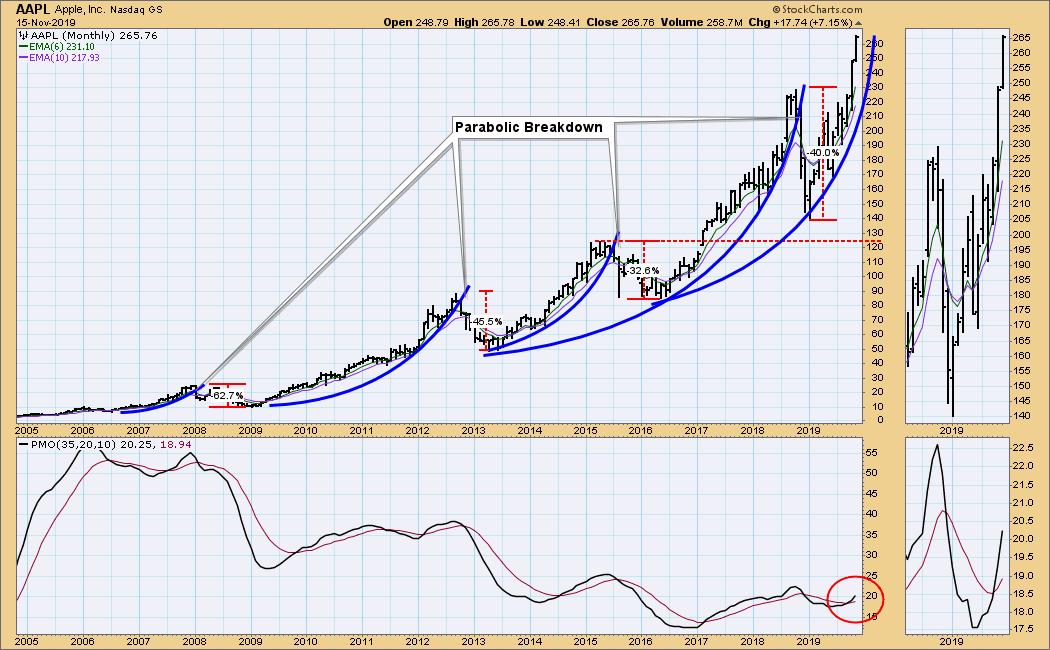
DP WEEKLY WRAP: Apple Going Vertical Again
by Carl Swenlin,
President and Founder, DecisionPoint.com
Late last year I wrote about Apple (AAPL) when it had broken down from a parabolic advance, a break which ultimately resulted in a total decline of about -40%. To see it on a chart just boggles my mind. I mean, here is a company with over $200 billion in...
READ MORE
MEMBERS ONLY
DP Show: Put/Call Ratios - Breadth - Swenlin Trading Oscillators Still Warn
by Erin Swenlin,
Vice President, DecisionPoint.com
by Carl Swenlin,
President and Founder, DecisionPoint.com
In this episode of DecisionPoint, Carl and Erin review the action of the S&P 500 in depth, covering the climactic and short-term indicator divergences as the market climbs. (There are problems that cannot be ignored, but they are more subtle.) Carl presents his Yield Array and sees activity...
READ MORE
MEMBERS ONLY
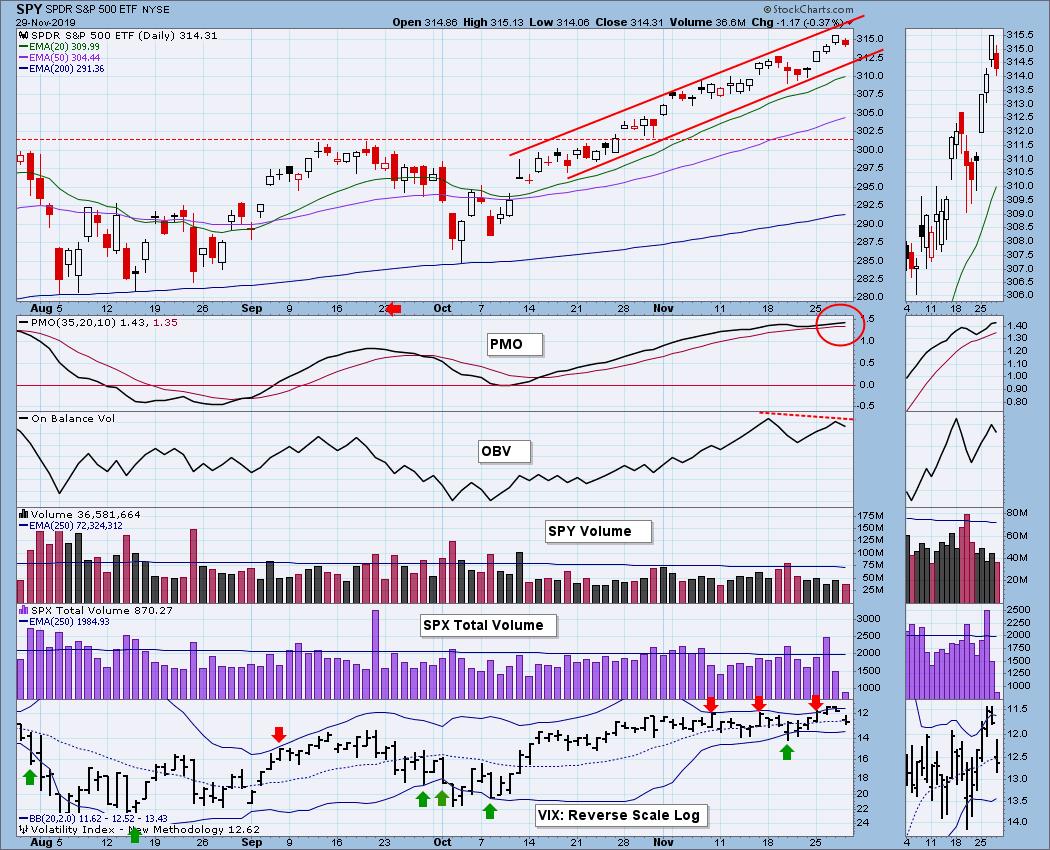
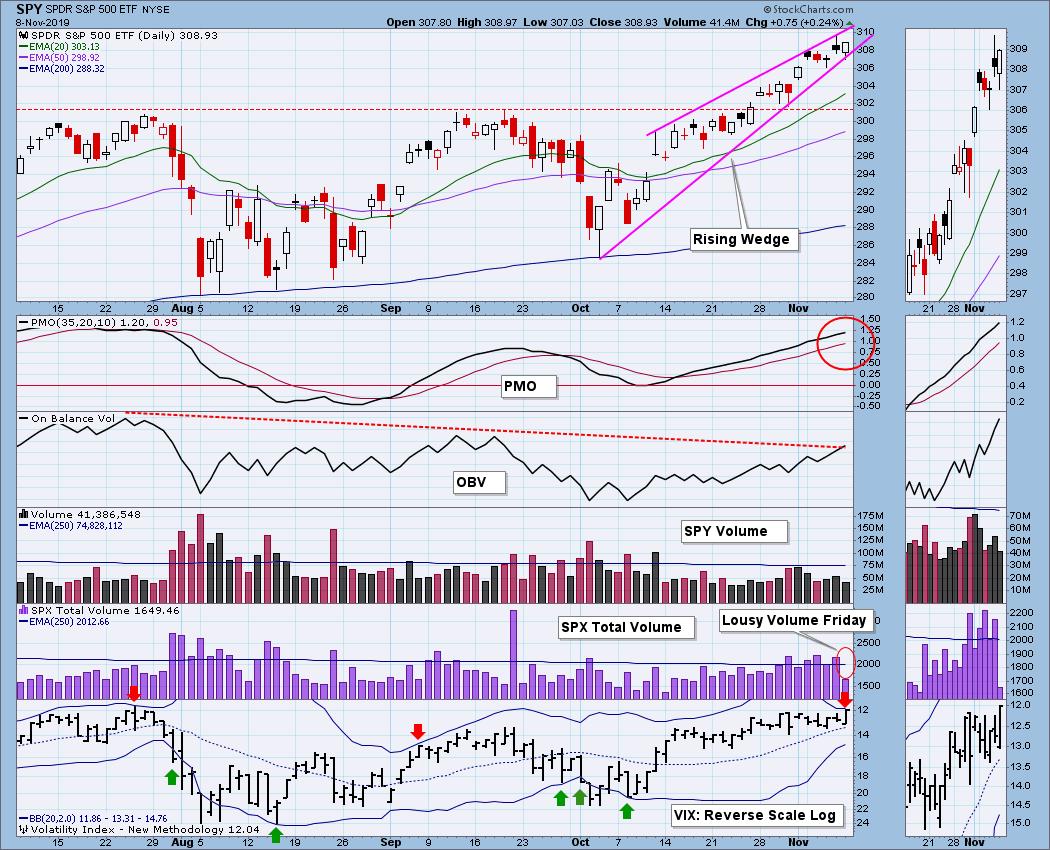
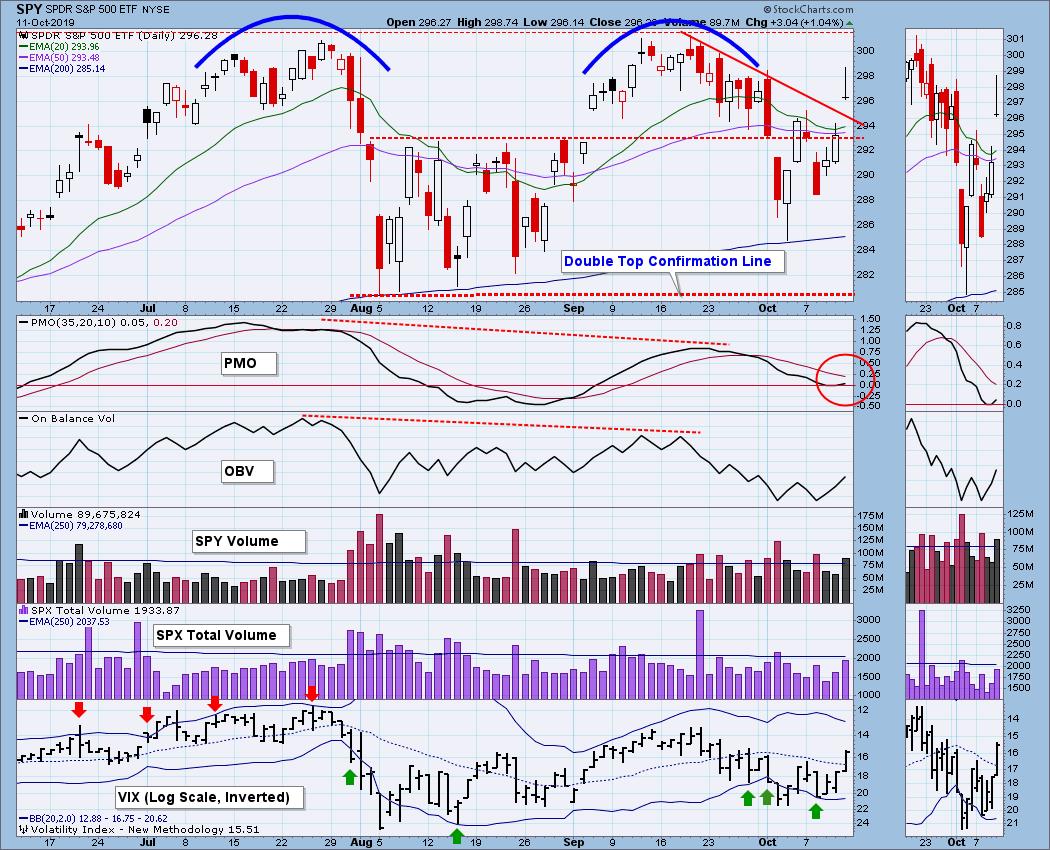
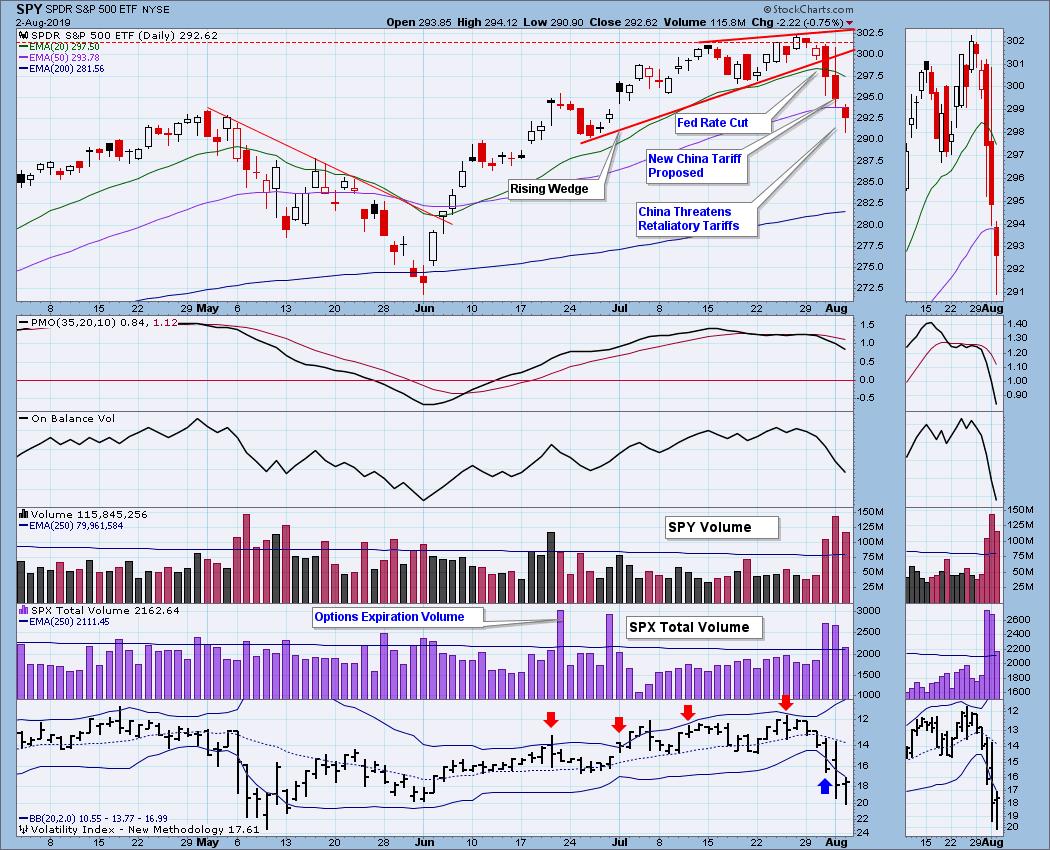
DP WEEKLY WRAP: Three Problems with SPY Chart
by Carl Swenlin,
President and Founder, DecisionPoint.com
These are not huge problems, but they do have negative implications for the short term. First, there is the rising wedge formation, a formation that will most often resolve to the downside -- not always, but most often. Next the VIX is very close to the upper Bollinger Band, which...
READ MORE
MEMBERS ONLY
DP Show: The Passive Investment Bubble
by Erin Swenlin,
Vice President, DecisionPoint.com
by Carl Swenlin,
President and Founder, DecisionPoint.com
In this episode of DecisionPoint, Carl and Erin talk about the negative divergences on the Swenlin Trading Oscillators. Afterwards, they dig into what the believe could be the next "bubble" - ETFs. Despite being excellent vehicles for trading, indexed ETFs could be pushing the stock market toward the...
READ MORE
MEMBERS ONLY
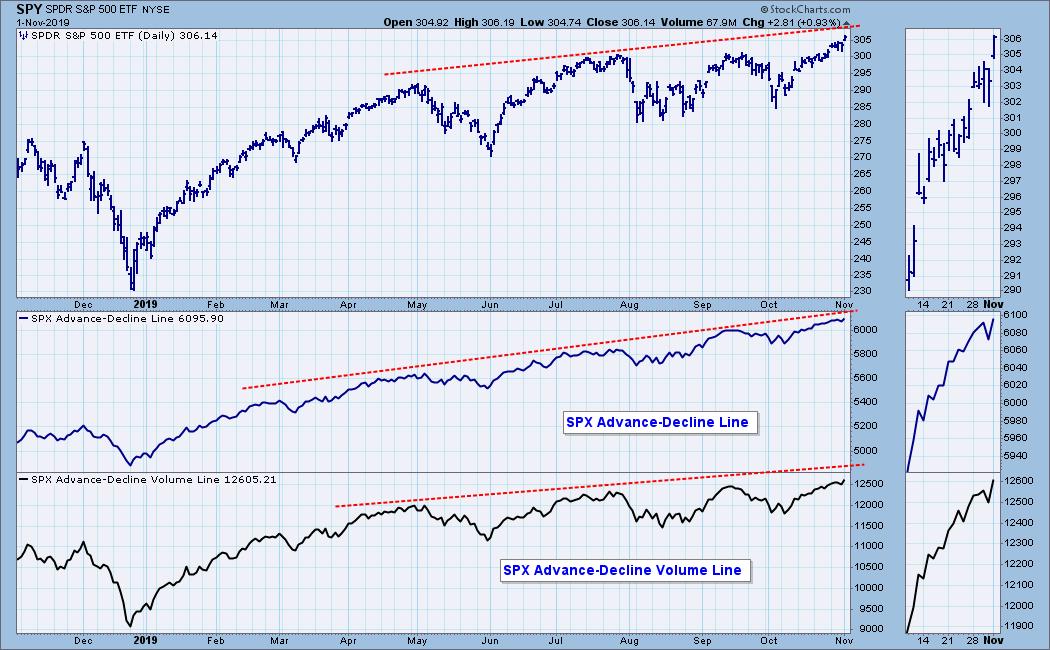
DP WEEKLY WRAP: Choosing Between Conflicting Breadth Indicators
by Carl Swenlin,
President and Founder, DecisionPoint.com
The venerable Advance-Decline and Advance-Decline Volume Lines are confirming the rising price tops over the last ten months, which is reassuring for the bulls. Unfortunately, some other breadth indicators disagree.
Specifically, neither the SPX Silver Cross Index (percent of SPX stocks with 20EMA higher than 50EMA) or the SPX Golden...
READ MORE
MEMBERS ONLY
DP Show: All-Time Highs - Where's the Breadth?
by Erin Swenlin,
Vice President, DecisionPoint.com
by Carl Swenlin,
President and Founder, DecisionPoint.com
In this episode of DecisionPoint, Carl and Erin discussed the new all-time highs that broad markets accomplished today, but found that breadth was wanting. Volume was also suspect; a look at DP Short-Term indicators revealed serious negative divergences. Carl discussed wildfires and Generac Holdings (GNRC) and why it is prospering....
READ MORE
MEMBERS ONLY
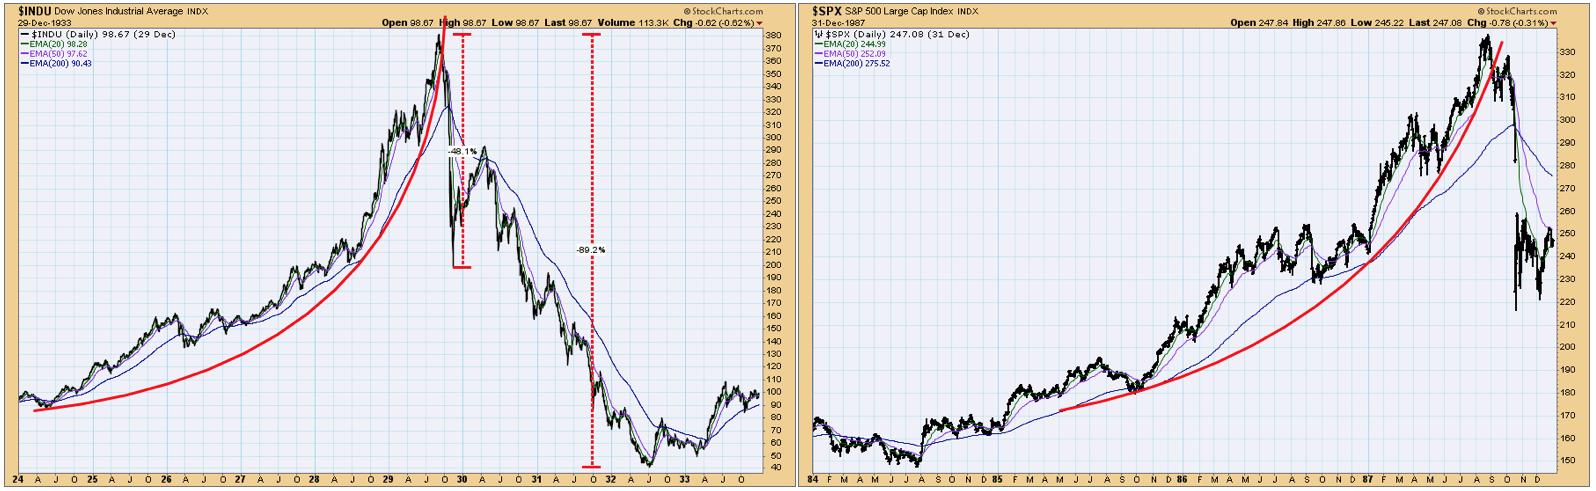
DP WEEKLY WRAP: Crash Coming?
by Carl Swenlin,
President and Founder, DecisionPoint.com
Because of some recent articles I have seen, I decided to discuss the crashes in 1929 and 1987 on Monday's regular DecisionPoint show on StockCharts TV.
What I didn't cover during the show was how the chart patterns of those two iconic events compare to the...
READ MORE
MEMBERS ONLY
DP Show: Anniversary of 1929 and 1987 Crashes - Does History Tell Us to Expect the Same?
by Erin Swenlin,
Vice President, DecisionPoint.com
by Carl Swenlin,
President and Founder, DecisionPoint.com
In this episode of DecisionPoint, Erin covered the major indexes and DP indicators, taking a deeper look at the Rydex Ratio (which is showing very bearish sentiment in place). Meanwhile, with this week marking the anniversary of both the 1929 and 1987 market crashes, Carl took us back in time...
READ MORE
MEMBERS ONLY
DP WEEKLY WRAP: Triple Top Now?
by Carl Swenlin,
President and Founder, DecisionPoint.com
The breakout above the short declining tops line last week was extended upward this week, and that has kind of messed up my double top scenario. Now it appears that a triple top may be in progress, and the expected outcome for that is really no different than for a...
READ MORE
MEMBERS ONLY
EARNINGS: 2019 Q2 Finalized; S&P 500 Still Overvalued
by Carl Swenlin,
President and Founder, DecisionPoint.com
The S&P 500 earnings for 2019 Q2 were finalized a few weeks ago. The following chart shows us the normal value range of the S&P 500 Index, indicating where the S&P 500 would have to be in order to have an overvalued P/E...
READ MORE
MEMBERS ONLY
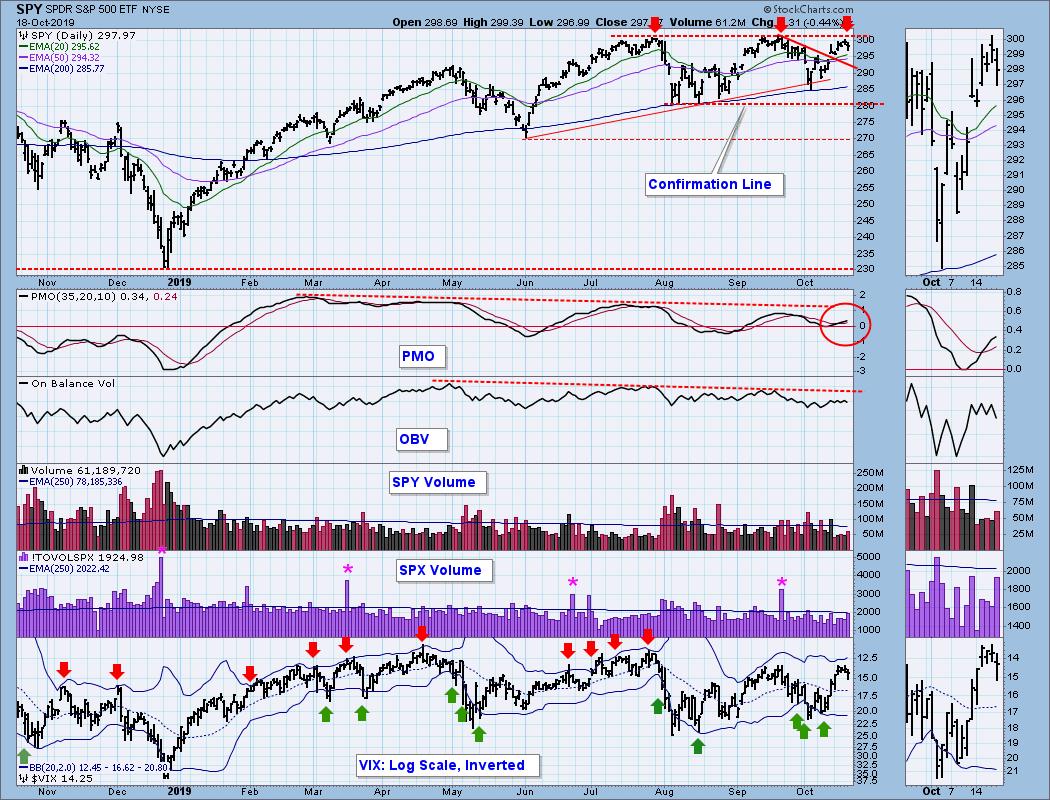
DP Show: Indicators Don't Support All Time Highs
by Erin Swenlin,
Vice President, DecisionPoint.com
by Carl Swenlin,
President and Founder, DecisionPoint.com
In this week's episode of DecisionPoint, Carl spent a few minutes analyzing a six-month chart of the SPX, after which Erin and Carl discussed the lack of support this recent rally is showing. Erin followed up with sentiment and DecisionPoint indicators, while Carl took his discussion of the...
READ MORE
MEMBERS ONLY
DP WEEKLY WRAP: Can't Fight the News
by Carl Swenlin,
President and Founder, DecisionPoint.com
Last week I said, "There is a declining trend line drawn from the mid-September top. If that is taken out, I will pretty much give up on the double top idea." When I wrote that, I had in mind a solid, deliberate advance to new, all-time highs. What...
READ MORE
MEMBERS ONLY
DP Show: Market Still Tenuous - Indicators Show Bearish Divergence
by Erin Swenlin,
Vice President, DecisionPoint.com
by Carl Swenlin,
President and Founder, DecisionPoint.com
In this week's episode of DecisionPoint, Erin reviewed the major market indexes as well as the DecisionPoint indicators. Meanwhile, Carl added the Percent of Stocks Below their 20-EMA and the Silver Cross Index on our standard indicator charts. It made it quite clear that not all companies participated...
READ MORE
MEMBERS ONLY
DP WEEKLY WRAP: Double Top Abort?
by Carl Swenlin,
President and Founder, DecisionPoint.com
The market was treating my double top assessment pretty well, but on Friday price got back above the recently broken support; however, on the two-day rally SPX volume fell below the one-year average, failing to validate the advance. The daily PMO tried to turn up, but couldn't quite...
READ MORE
MEMBERS ONLY
DP WEEKLY WRAP: A Test of Support Is Coming, Then Maybe Some Downside
by Carl Swenlin,
President and Founder, DecisionPoint.com
The July and September price tops are virtually identical, so I am assuming that a double top is in progress; however, it won't be a official double top until price drops below the confirmation line. That is a bit long to wait before taking appropriate action, so I...
READ MORE
MEMBERS ONLY
DP WEEKLY WRAP: Fading New Highs Spell Trouble
by Carl Swenlin,
President and Founder, DecisionPoint.com
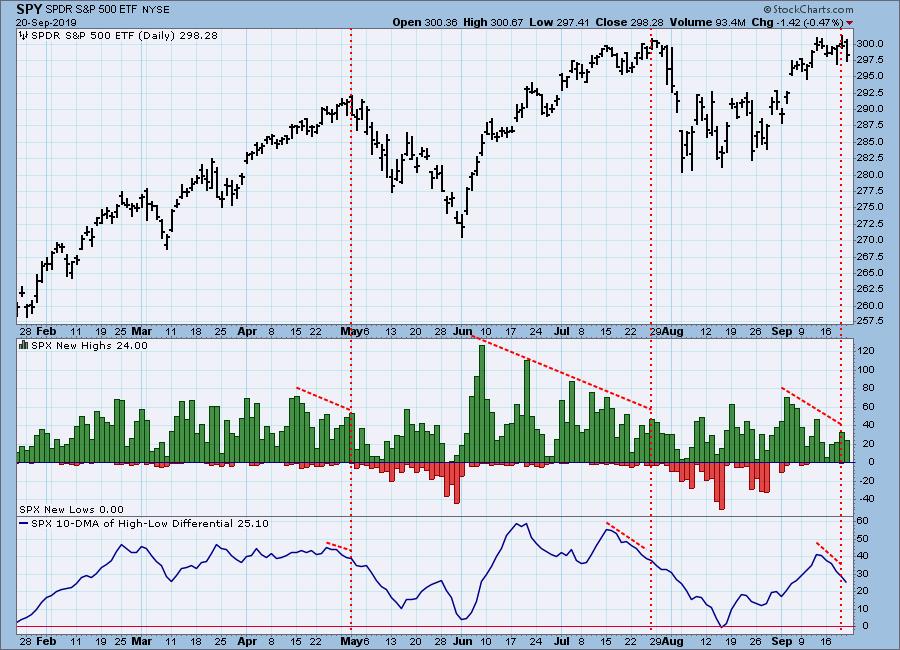
While SPY made another all-time intraday high on Thursday, the number of S&P 500 component New Highs continued to contract from the level they had reached earlier this month. This kind of activity should be taken as a warning flag, increasing our expectation of a price top. Also...
READ MORE
MEMBERS ONLY
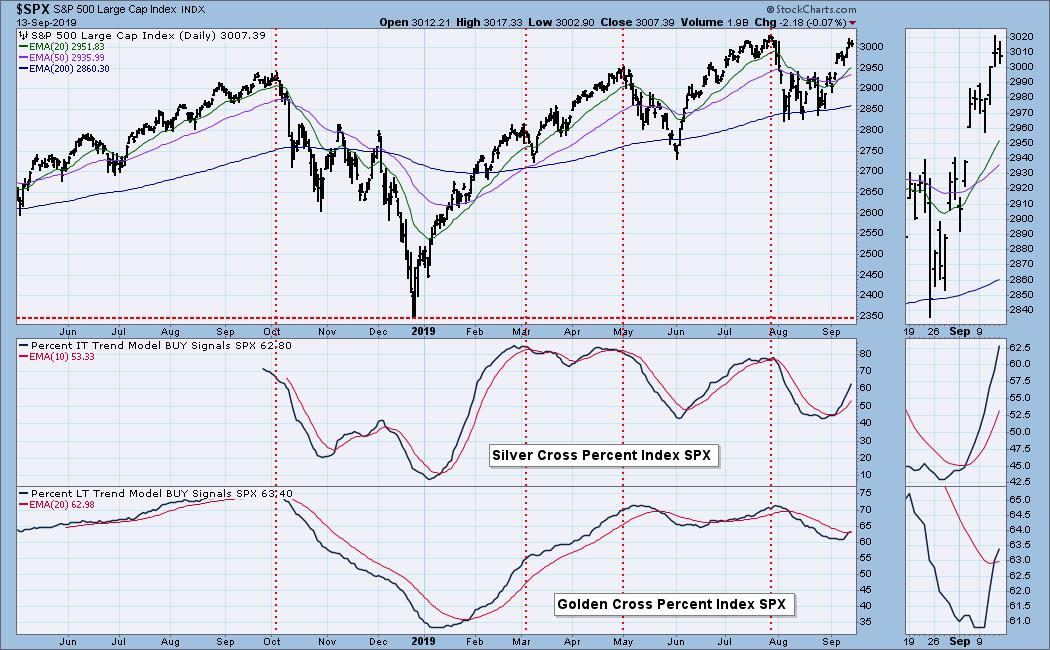
DP WEEKLY WRAP: Golden Cross and Silver Cross Indexes Not Confirming SPY Record High
by Carl Swenlin,
President and Founder, DecisionPoint.com
On Thursday SPY hit an all-time intraday high, but it was not confirmed by some of our internal indicators. In particular I am referring to the *Golden Cross and **Silver Cross Indexes, both of which are well below their levels when the market made its last all-time high in July....
READ MORE
MEMBERS ONLY
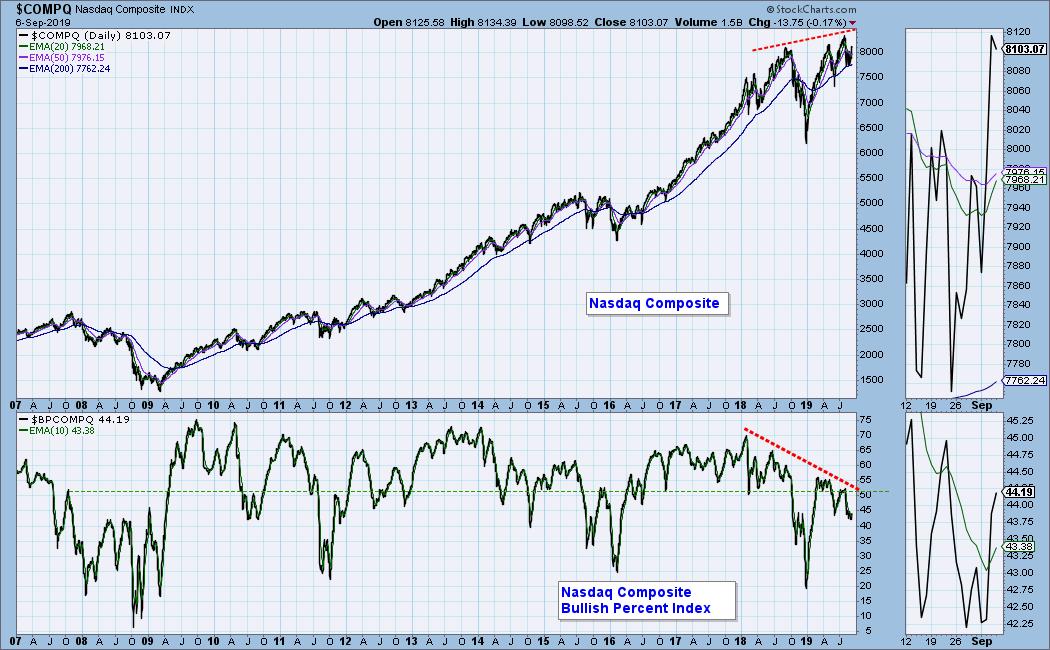
DP WEEKLY WRAP: Internal Support Substantially Erroded
by Carl Swenlin,
President and Founder, DecisionPoint.com
The Nasdaq Composite Index is about 2.5% below its all-time high of earlier this year, but its Bullish Percent Index (BPI), which is the percentage of Nasdaq component stocks with point and figure BUY signals, stands at only 44%. This is about -15% below the BPI reading at the...
READ MORE
MEMBERS ONLY
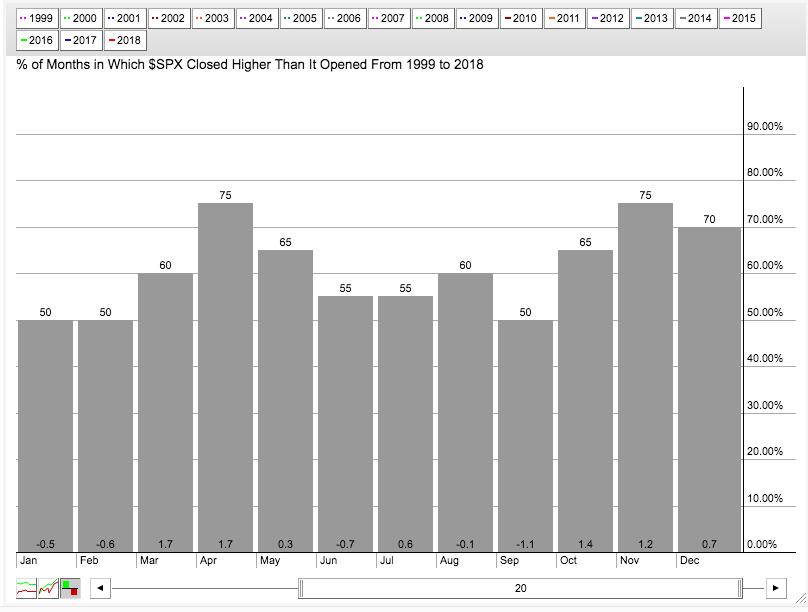
DP WEEKLY WRAP: Seriously Suspecting September Seasonality
by Carl Swenlin,
President and Founder, DecisionPoint.com
The month of September has a reputation for being a bad month for the stock market. After the October 1987 Crash, the month of October carried a bad rep for years, but more recently we are told that it's really September we have to watch out for. On...
READ MORE
MEMBERS ONLY
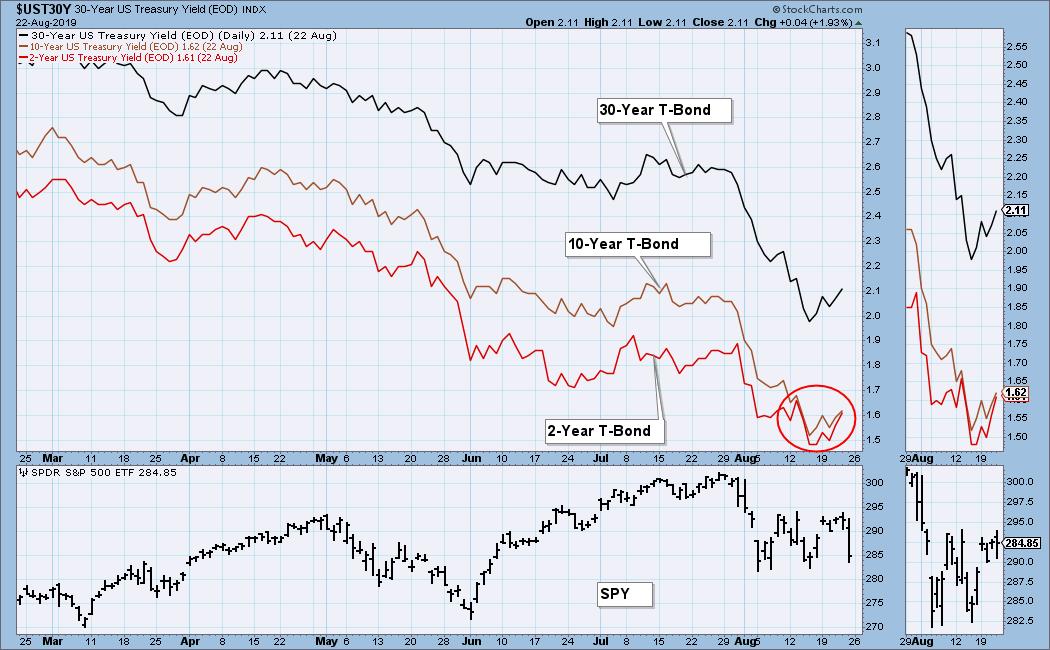
DP WEEKLY WRAP: Inversion Aversion; Failed Double Bottom
by Carl Swenlin,
President and Founder, DecisionPoint.com
The oft-referenced "yield curve" refers to the relationship between the yield of the 10-Year T-Bond and the 2-Year T-Bond. Logically, the longer-term instrument should have the higher yield, but this week the 2-Year yield popped slightly above the 10-Year yield on a few occasions intraday. As could be...
READ MORE
MEMBERS ONLY
DP WEEKLY WRAP: All That Drama for a Net Change of Less Than One Percent for the Week
by Carl Swenlin,
President and Founder, DecisionPoint.com
On the last trading day of July the market (SPY) resolved a rising wedge pattern with the expected breakdown, and that began what has turned out to be a very turbulent August. (Note how the volume for almost every day has exceeded the one-year average.) After an initial decline of...
READ MORE
MEMBERS ONLY
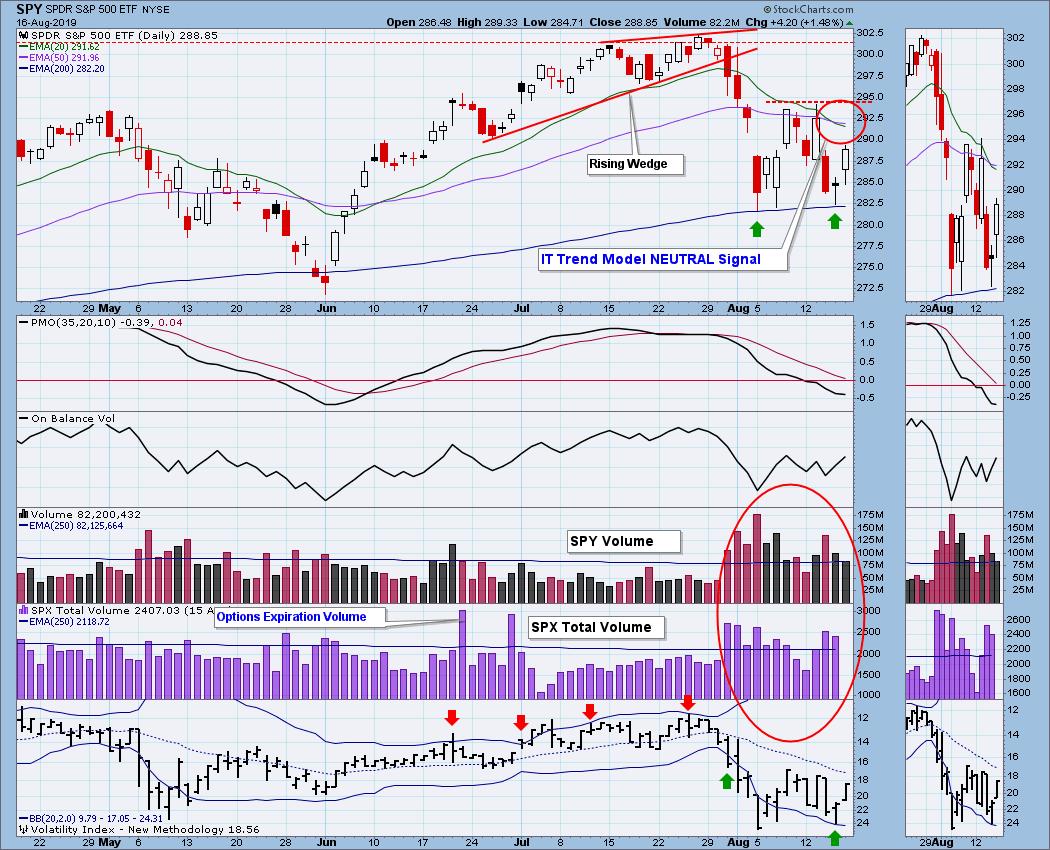
DP WEEKLY WRAP: Important New Look at an Old Indicator
by Carl Swenlin,
President and Founder, DecisionPoint.com
One thing that we technical analysts like to spot at price tops is an indicator flashing a negative divergence, which is an indicator that is trending downward while price continues to trend upward. Such divergences imply that internals are eroding under the rising price, and that a price correction could...
READ MORE
MEMBERS ONLY
DP WEEKLY WRAP: Was Technical Analysis At All Helpful This Week?
by Carl Swenlin,
President and Founder, DecisionPoint.com
While I work, I watch a business news channel with the sound turned down. It's not really a necessary activity, it's just what I do. One of the things I notice is that the commentators try to attribute news items to every market twitch, and most...
READ MORE
MEMBERS ONLY
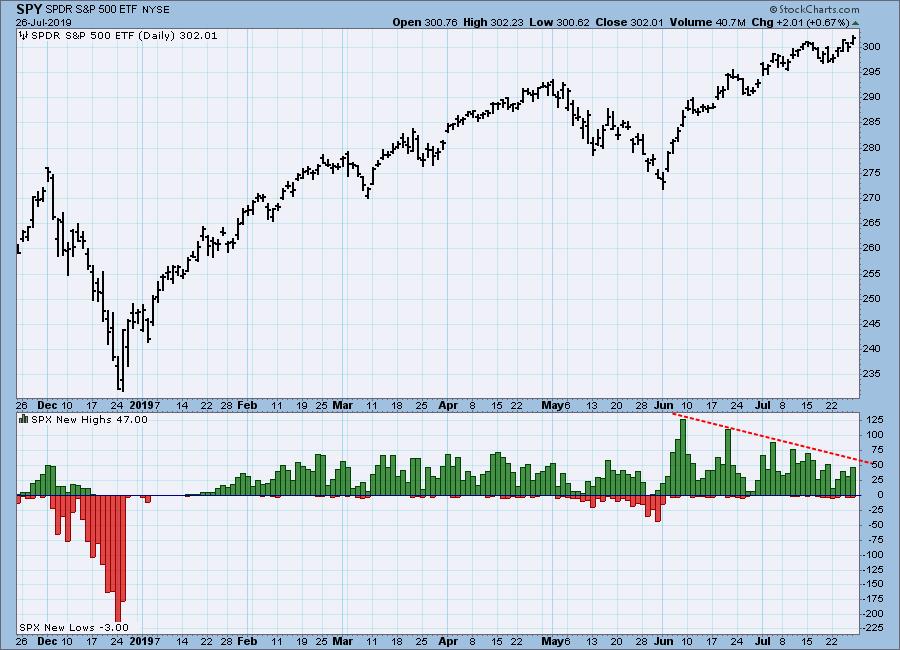
DP WEEKLY WRAP: While S&P 500 Index Makes Record Highs, Index Component New Highs Fade
by Carl Swenlin,
President and Founder, DecisionPoint.com
The S&P 500 Index has been making all-time highs for over a month, but new highs for S&P 500 component stocks has been fading since the rally initiation spike in early-June. This indicates that participation is narrowing and that largest-cap stocks are doing most of the...
READ MORE
MEMBERS ONLY
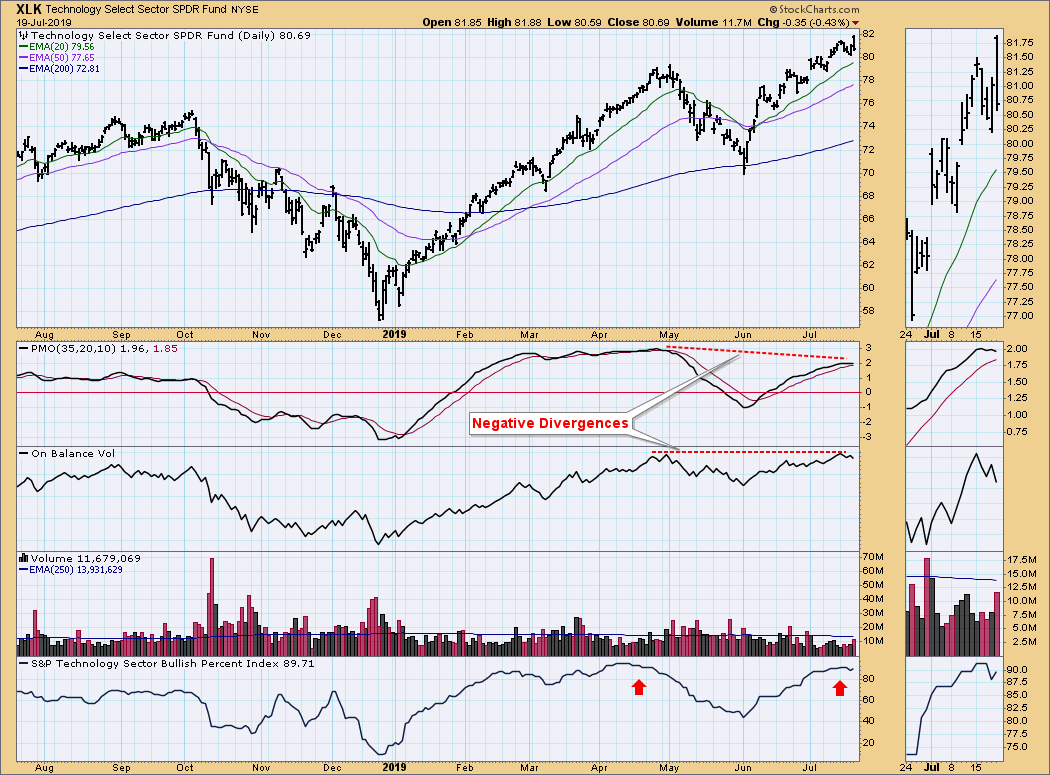
DP WEEKLY WRAP: Technology Sector Bullish Percent Seems Maxed
by Carl Swenlin,
President and Founder, DecisionPoint.com
The Bullish Percent Index (BPI) shows the percentage of stocks in a given index with Point and figure BUY signals. Besides having a BPI for the major market indexes, StockCharts.com also has a BPI for each of the 11 Sector SPDRs, and I have started to display them with...
READ MORE