MEMBERS ONLY
WEATHER, WEATHER EVERYWHERE
Hopefully things have been better at your house than they have been here in the Pacific Northwest. So far this winter we've had record rainfall, huge windstorms, long power outages, lots of snow, tsunami warnings, icy roads and record cold. The joke these days is "What else?...
READ MORE
MEMBERS ONLY

AIRLINES FLYING HIGH
Don't look now, but the airlines have found their wings. After drifting lower for the better part of 7-8 years, something strange has happened. Could it be? Yes, airlines are breaking out! I know it sounds impossible, but airlines for the first time in nearly a decade have...
READ MORE
MEMBERS ONLY
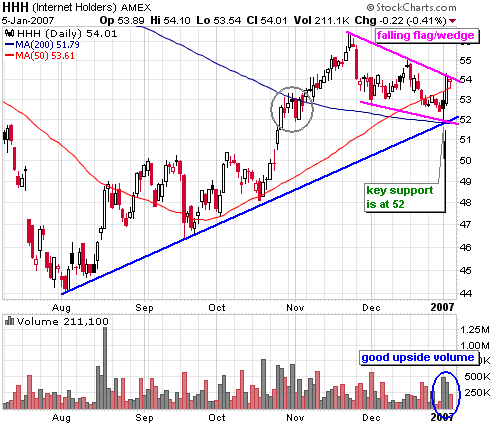
HHH STARTS 2007 WITH A BANG
The Internet HOLDRS (HHH) started 2007 with strong move on good volume, but the ETF was knocked back on Friday and remains just short of breakout. Follow through is the key.
The Internet HOLDRS (HHH) formed a falling flag/wedge over the last six weeks. These are typical for mild...
READ MORE
MEMBERS ONLY
NEW NYSE COMMON STOCK ONLY INDICATORS
The purpose of this article is to introduce a new set of market indicators that DecisionPoint.com has recently released, indicators constructed from only common stocks listed on the NYSE.
A little background, at its inception The NYSE Composite Index was composed of all the issues listed on the New...
READ MORE
MEMBERS ONLY

KEEPING AN EYE ON ENERGY
With the first week of the year out of the way; we have seen a rather sharp and violent sell-off in a number of asset classes including energy. Our interest is energy stocks: we think the sell-off has gotten a bit "overdone" to be sure as the oil...
READ MORE
MEMBERS ONLY
SERVER ROOM IMPROVEMENTS STATUS REPORT
Back in November, work started in earnest on our new server facility. The new facility will have much more power and cooling capacity and will allow us to install bigger and better computers to drive our website. December's big wind storm set the schedule back by a week...
READ MORE
MEMBERS ONLY
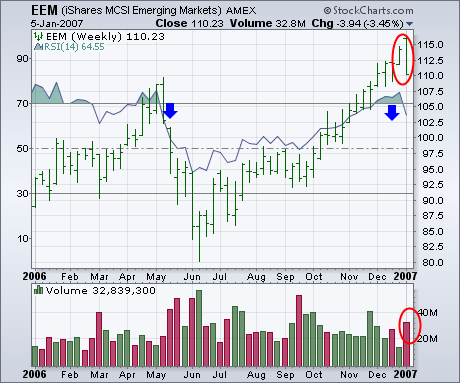
EMERGING MARKETS SUFFER WEEKLY REVERSAL
The MSCI Emerging Markets iShares (EEM) suffered a downside weekly reversal on heavy volume as shown in the chart below. In fact, the EEM had its biggest weekly fall in more than three months. At the very least, that suggests that a pullback of some type is probably in store....
READ MORE
MEMBERS ONLY
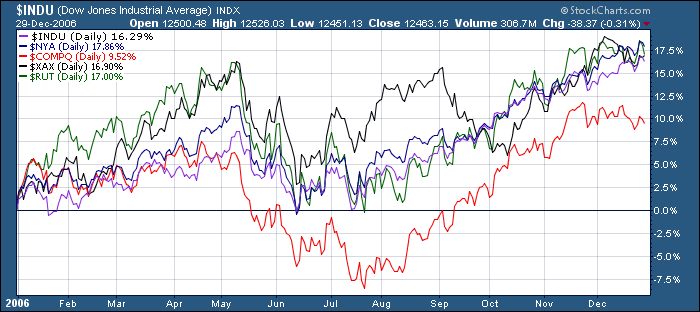
2006 REVIEW, 2007 PREVIEW
Happy New Year's ChartWatchers!
Hopefully the start of 2007 finds you more prosperous than you were at the start of 2006. That's always the goal and, given the performance of the major averages during 2006, it looks like many people achieved it.
Basically, everything was up...
READ MORE
MEMBERS ONLY
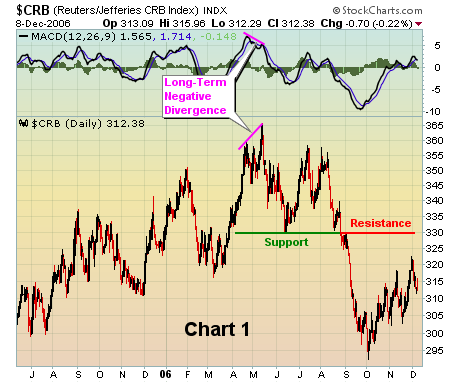
ARE COMMODITIES BOUNCING BACK, OR JUST BOUNCING?
We've seen commodity prices skyrocket over the past several years and equities that have exposure to commodities have gone along for the ride. Should we be concerned now that those commodities have experienced weakness over the past couple months? Or should we instead be focused on the ensuing...
READ MORE
MEMBERS ONLY
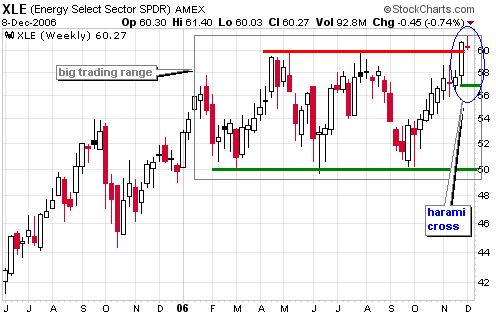
XLE AND USO: SOMETHING HAS TO GIVE
The Energy SPDR (XLE) surged over the last two months and is challenging resistance, but the U.S. Oil Fund ETF (USO) remains relatively weak and continues testing support. These two are out of sync and something has to give. As I see it, either XLE will fail at resistance...
READ MORE
MEMBERS ONLY
CRASH TALK IS PREMATURE
I have heard that a number of people have been predicting a crash. I don't know what evidence they are citing, but my analysis of the price structure and internal indicators leads me to the conclusion that there is not a crash anywhere in sight. This does not...
READ MORE
MEMBERS ONLY
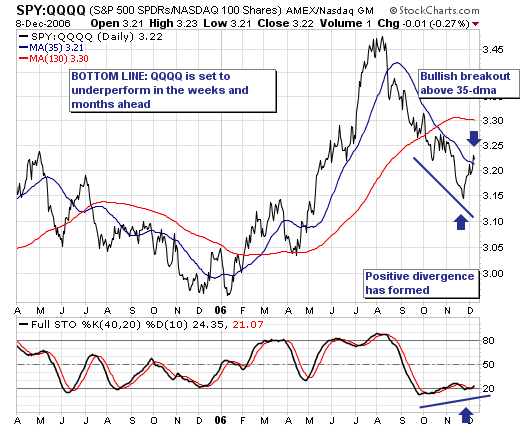
A CORRECTION - OR SOMETHING LARGER?
The recent "slowdown" in the major averages has produced "rotational undercurrents" between these averages; the most poignant we observe is the bullish breakout in the ratio of the S&P 500 Spyders (SPY) and the NASDAQ 100 (QQQQ). The reason we focus upon this is...
READ MORE
MEMBERS ONLY
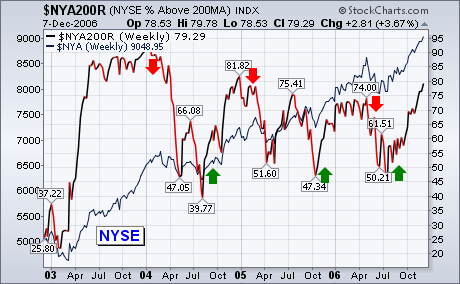
SENTIMENT INDICATORS SHOW A MARKET ENTERING OVERBOUGHT TERRITORY
% NYSE STOCKS ABOVE 200-DAY AVERAGES ... I've received requests to look at some long-term market sentiment indicators. I've chosen a couple that you can plot by yourself on Stockcharts. One of those is the % of NYSE stocks above their 200-day moving average ($NYA200R). That's the...
READ MORE
MEMBERS ONLY
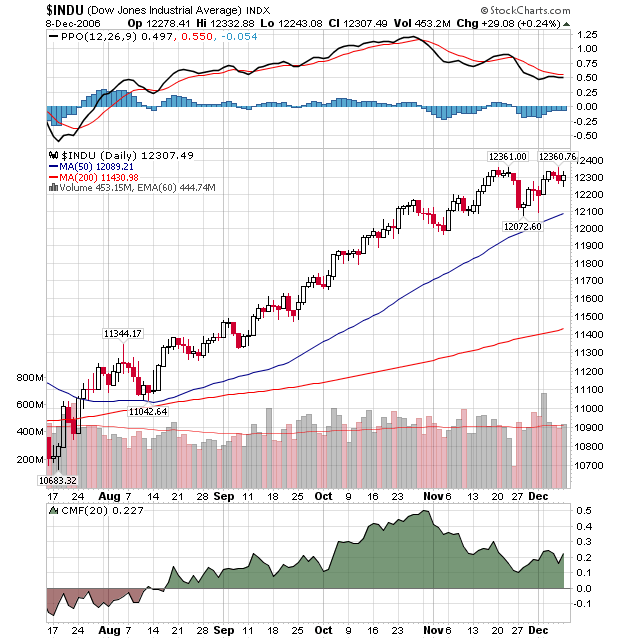
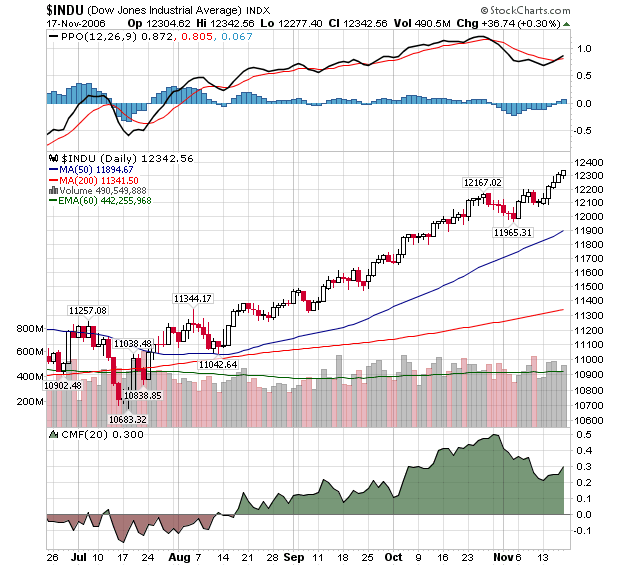
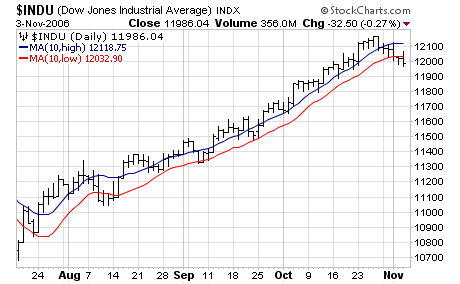
DOW LOOKING "TOPPY"
The Dow Jones Industrial Average had a significant technical development in the middle of last week when it failed to surpass it's previous "peak" for the first time in months. After hitting 12,361 on November 22nd, the index sank to 12,072 a week later....
READ MORE
MEMBERS ONLY
WILL THE NASDAQ RALLY FIZZLE?
Not very likely. We've seen a very strong earnings season. Economic report after economic report suggests the Fed is done with its interest rate hike campaign. There are too many non-believers in the market's advance, just take a look at the short-sellers. Lots of cash sits...
READ MORE
MEMBERS ONLY

THIRD BREAKOUT FOR QQQQ
For the third time in three months, QQQQ broke consolidation resistance and the uptrend shows no signs of abating. The gray ovals show consolidations in the second halves of August, September and October. These were followed by breakouts in early September, early October and early November. Broken resistance turned into...
READ MORE
MEMBERS ONLY
4-YEAR CYCLE RULES
For quite a while I have been saying that the rally that began in July has been driven by persistent bearishness among investors. I still think this was a significant element, and it was encouraged by a strong belief that a major decline would be occurring in October in conjunction...
READ MORE
MEMBERS ONLY
CANDLEGLANCE, SITE SEARCH
UPDATED CANDLEGLANCE PAGE - We've upgraded the Candleglance page so that people with wide screens will see more charts and less white space. Look for similar improvements throughout our site in the coming weeks.
NEW ENHANCED SITE-SEARCH POWERED BY GOOGLE - We've also greatly enhanced our...
READ MORE
MEMBERS ONLY

FALLING COMMODITIES HURT CANADA, EMERGING MARKETS LAG
FALLING COMMODITIES HURT CANADA ... When commodity prices started to slide several months ago, I suggested that certain global stocks markets might suffer from falling raw material prices. One of them was Canada. Chart 1 shows the Toronto 300 Index (TSE) in the process of challenging its spring high. That'...
READ MORE
MEMBERS ONLY
STRONG TECHNICALS?
Here's what a strong techincal picture looks like:
Record closes for each of the past 4 days. Steady volume. Increasing Money Flow values. Quick recovery from a recent downturn. Bullish MACD cross-over. This chart has it all!
Unless...
Maybe too many good signs is a bad sign. Maybe...
READ MORE
MEMBERS ONLY
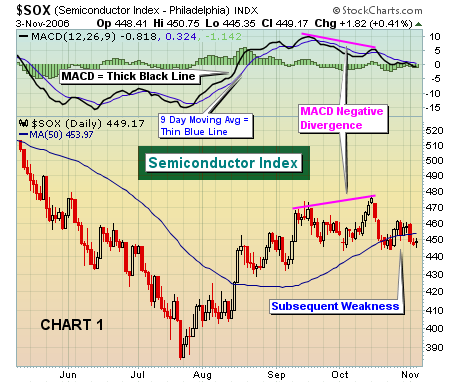
UNDERSTANDING THE MACD - NEGATIVE DIVERGENCES
On the technical side, we believe the combination of price and volume is paramount to successfully trading the stock market. A strong second place finish goes to the Moving Average Convergence Divergence, or the "MACD". The standard settings on the MACD are 12, 26, 9. On daily charts,...
READ MORE
MEMBERS ONLY
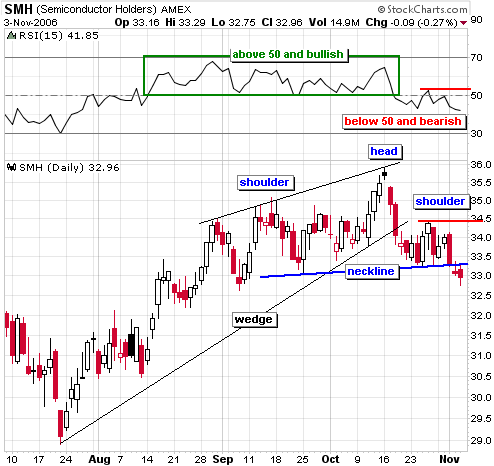
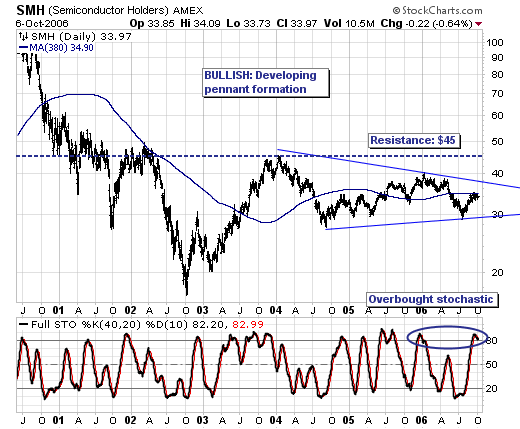
BEARISH DEVELOPMENTS IN SMH
The Semiconductor group is important to the performance of the Nasdaq and the Nasdaq is important to the performance of the overall market. Recent bearish developments in the Semiconductor HOLDRS (SMH) bode ill for the group and this is likely to weigh on both the Nasdaq and the S&...
READ MORE
MEMBERS ONLY
GOLD IS COMING BACK
Since gold peaked around $725 in May of this year, it has been going through the process of digesting the huge advance that took place a year prior to that peak. At first it was not clear whether or not the gold bull market was over, but, as you can...
READ MORE
MEMBERS ONLY
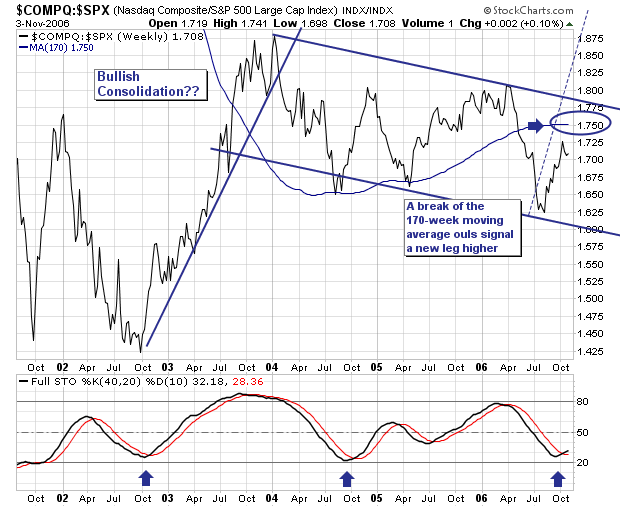
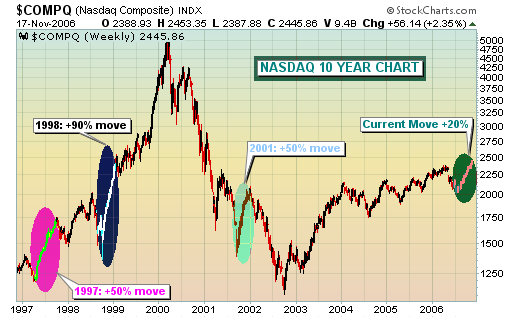
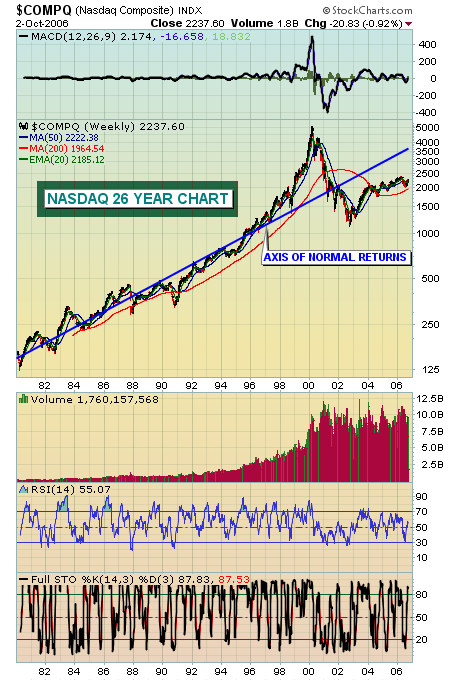
ANALYZING THE NASDAQ COMPOSITE
The broader market rally off the June/July lows has pushed all the major indices higher; and in particular the Nasdaq Composite has outperformed rather noticeably if one looks at the Composite/S&P 500 Ratio. It has moved from 1.625 to 1.725; not a very large...
READ MORE
MEMBERS ONLY
SERVER RELOCATION SUCCESSFUL
Our servers are now safely relocated to their new (temporary) home and the construction of our new server room has begun....
READ MORE
MEMBERS ONLY
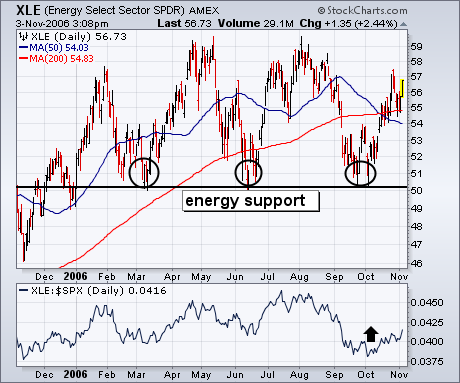
ENERGY STOCKS ARE BOUNCING AGAIN
The last time I showed the Energy Sector SPDR (XLE) it was starting to bounce off chart support along its 2006 lows (see circles). Chart 1 shows that the XLE has climbed back over its moving average lines and may be heading toward the top of its 2006 trading range....
READ MORE
MEMBERS ONLY
AVERAGING THE HIGHS AND THE LOWS
There is a lot more power inside our SharpCharts2 charting engine than we currently make available to our users. The problem is making that power available in an easy-to-use way. A great example of that is the ability to calculate indicators based on something other than the closing value in...
READ MORE
MEMBERS ONLY
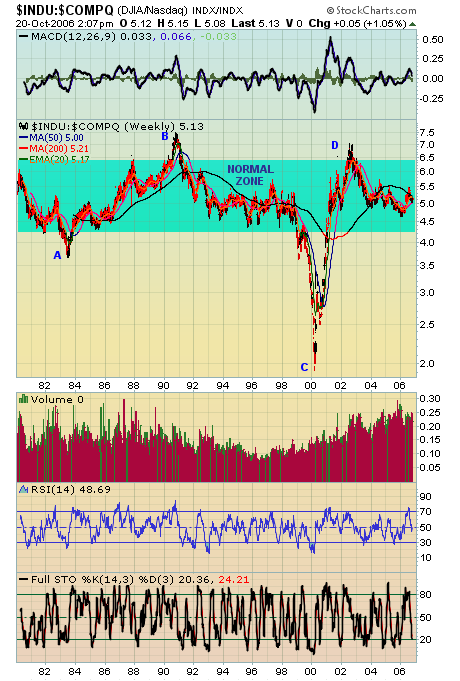
FLIGHT TO SAFETY
Recall in my last article the "axis of normal returns" showing the potential move of the NASDAQ over the next 2-3 years to return to its "normal line". This time I'd like to approach the NASDAQ's potential move from another angle -...
READ MORE
MEMBERS ONLY
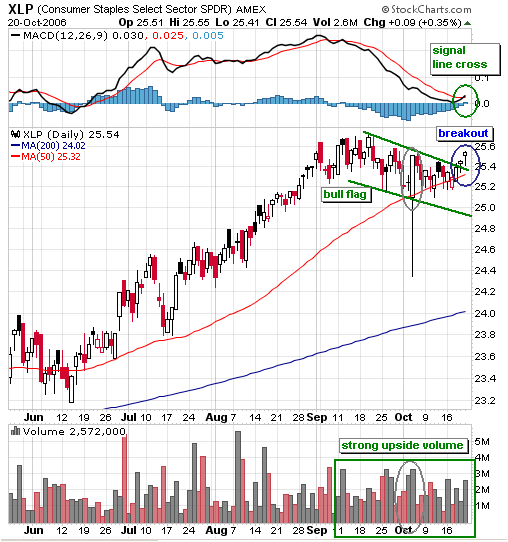
A BULL FLAG FOR THE CONSUMER STAPLES SPDR (XLP)
The Consumer Staples SPDR (XLP) was a top performer from April to September, but went through a period of underperformance over the last 4-5 weeks. The Dow Industrials and S&P 500 kept right on trucking in September and October. The Dow recorded a new all time high above...
READ MORE
MEMBERS ONLY

WINDSOCK VERSUS CRYSTAL BALL
For several months these articles have included a reminder that "Technical analysis is a windsock, not a crystal ball." To clarify, a windsock is used to ascertain the current wind direction and intensity. A crystal ball is used to predict the future. As a practical matter, if we...
READ MORE
MEMBERS ONLY
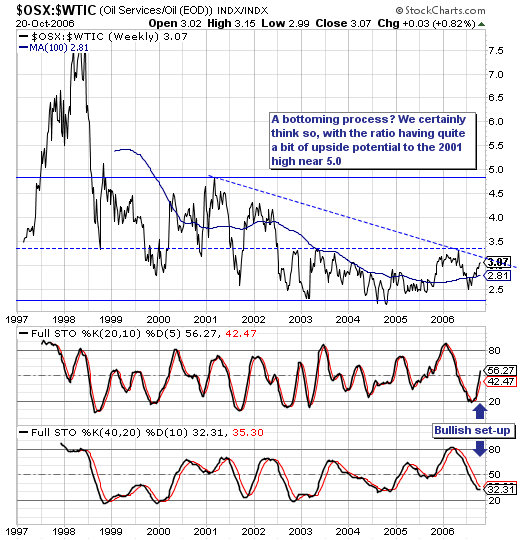
OIL SERVICES TAKING A BEATING
First, much continues to be made of the decline in crude oil prices, and the positive impact of lower energy prices upon the world consumer et al. This much is known; but oil service stocks have been "taken to the proverbial woodshed" and beaten to death, which creates...
READ MORE
MEMBERS ONLY
SERVER ROOM EXPANSION
JOHN MURPHY TRAVELLING THIS WEEK - John will be presenting at the IFTA Conference in Switzerland this week and will not be online after Monday. We've arranged for Arthur Hill (you can read he column below) to contribute commentary while John is away.
NEW METHOD FOR REQUESTING MISSING...
READ MORE
MEMBERS ONLY
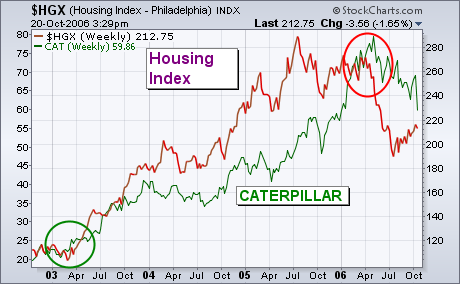
A WEAKENED HOUSING MARKET
CATERPILLAR HURT BY WEAK HOUSING ... A plunge in Caterpillar on Friday, Oct 20th, unsettled the market. And for good reason. The bad news from the stock was blamed on a weak housing sector. Why that's worth noting is because Wall Street seems to be dismissing the housing meltdown...
READ MORE
MEMBERS ONLY
INTERESTING STATISTICS
The Dow Industrials continued to set new highs last week and several interesting sectors led the way - but I'm not going to talk about that. (Our expert columnists have it covered below anyways.) I'm going to share some interested statistics with you about how StockCharts....
READ MORE
MEMBERS ONLY
IS IT TOO LATE TO CATCH THE NASDAQ TRAIN?
After a decent run up in stock prices, one of the questions always heard is "is it too late to buy?" Well, there's never a guaranteed right answer and a lot of analysts would say the bull market is long in the teeth and has run...
READ MORE
MEMBERS ONLY
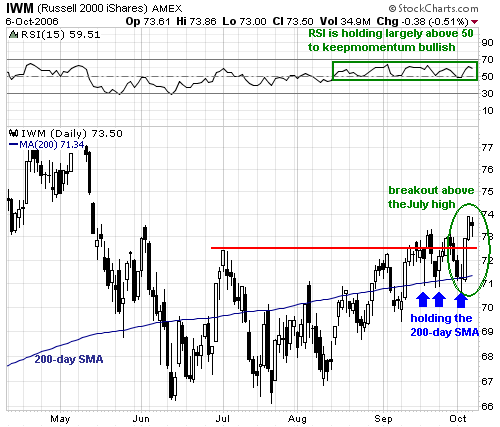
RUSSELL 2000 PERKS UP
After lagging QQQQ and SPY throughout September, the Russell 2000 iShares (IWM) got into the action last week with a surge from 71 to 74 (4.2%) on Wednesday and Thursday. The ETF remains well below its May high and is still lagging over the last few months, but this...
READ MORE
MEMBERS ONLY
MARKET HITS OVERHEAD RESISTANCE
The structure that has dominated the price pattern for nearly three years is a rising trend channel, which I have drawn on the S&P 500 chart below. As you can see, the price index has once more encountered the top of that channel, and that resistance will probably...
READ MORE
MEMBERS ONLY
RALLYING TECH SHARES
The sharp technology share rally has caught many "off-sides" to be sure. Take for example the NASDAQ 100 "Q's" +13.4% rise off their June low; this is quite impressive indeed...but not as impressive as the +19.7% gain in the Semiconductor Index...
READ MORE
MEMBERS ONLY
HARDWARE UPGRADES
JOHN MURPHY ON THE RADIO - In case you missed it, John Murphy was on Invested Central's radio broadcast during last Friday's afternoon show. He discussed the current direction of the market and what was driving its current direction. You can listen to the program online...
READ MORE
MEMBERS ONLY
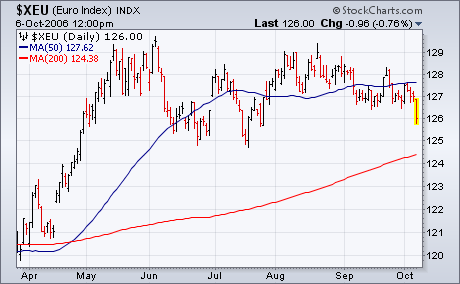
DOLLAR SURGES ON STRONG JOB REPORT
The dollar is having one of its strongest days in months. Part of the reason is the drop in the U.S. September unemployment rate and some upward revisions in recent job creation. The report diminished hopes for rate reductions by the Fed in the near future. In addition, Japanese...
READ MORE
