MEMBERS ONLY
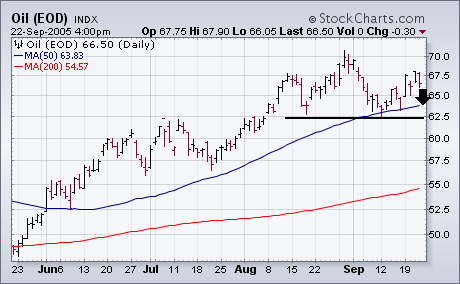
OIL MAY BE FORMING SHORT-TERM TOP ...
Today's selloff in oil of more than two dollars may be completing a right shoulder in a short-term head and shoulders top in the key commodity. The September bounce has fallen well short of the late-August peak (the head) and is about equal to the early August peak...
READ MORE
MEMBERS ONLY
Hello Fellow ChartWatchers!
Forces of nature have conspired to prevent the stock market from rising significantly since our last visit, however the markets have showed suprising strength considering the impact on the US economy that these storms are having. The storms are also on the minds of our regular columnists. John Murphy reviews...
READ MORE
MEMBERS ONLY
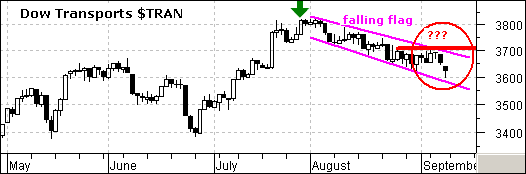
TRANSPORTS LAG INDUSTRIALS
Dow Theory stipulates that the Dow Industrials and Dow Transports should confirm each other to validate weakness or strength. Most recently, both Averages recorded new reaction highs in late July (green arrows) and this provided a Dow Theory confirmation of strength. Both Averages corrected in August, but only one surged...
READ MORE
MEMBERS ONLY
GOLD STOCKS APPROACHING RESISTANCE, POSSIBLE BREAKOUT
The May low for the Philadelphia Gold and Silver Index (XAU) provided us with the second data point necessary to establish the bottom of a trading range that is about two years old. The XAU is now approaching the top of the range, and we can expect that the current...
READ MORE
MEMBERS ONLY
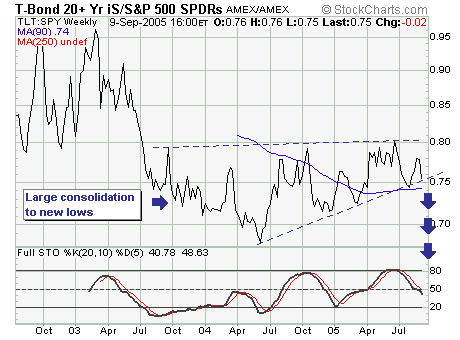
EFFECTS OF KATRINA
With the passing of Hurricane Katrina, we want to hone our focus in upon the TLT:SPY ratio relationship. This is simply due to the enormous amount of local, state and federal debt issuance that will materialize due to the substantial nature cost of clean-up and reconstruction efforts of the...
READ MORE
MEMBERS ONLY
NEW BOOK FROM STOCKCHARTS' OWN GREG MORRIS!
- Now is your chance to pre-order Greg Morris' new book, "The Complete Guide to Market Breath Indicators". This completely new book is a compilation of all the major (and most of the minor) market breadth indicators that are in use today. Be the first on your...
READ MORE
MEMBERS ONLY
FRIDAY BLOOMBERG INTERVIEW ...
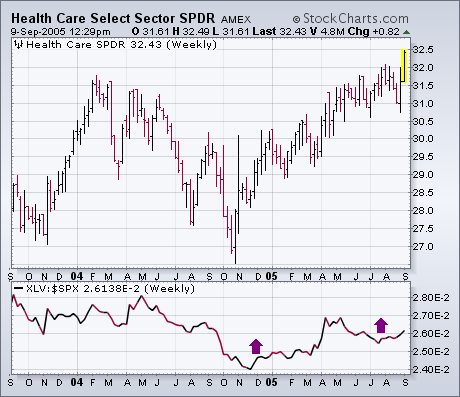
Some of you may have watched my 7:10 am interview on Bloomberg TV Friday. I discussed the upside breakout in the healthcare sector that I wrote about earlier in the week. For those of you who missed it, however, I'd like to show the same charts that...
READ MORE
MEMBERS ONLY
Hello Fellow ChartWatchers!
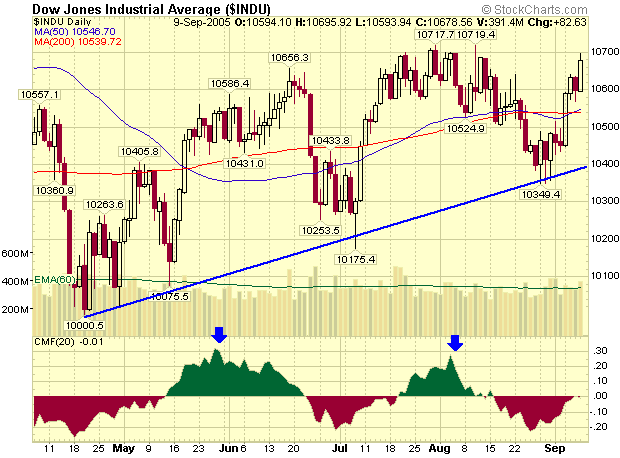
At the end of August, a very promising thing happened on the Dow Jones Industrials chart. Did you see it?
Last Thursday the index reversed around the 10,350 level. That confirmed the intermediate term uptrend (blue line) that goes back to the 10,000 low from last April. During...
READ MORE
MEMBERS ONLY

RYDEX CASH FLOW RATIO FAVORS BULLS
There is growing evidence that a bull market top is finally in place, but not all the evidence supports that scenario. For example, the Rydex Cash Flow Ratio shows that bearish sentiment is again approaching record levels, indicating that another run at new price highs could be in the cards....
READ MORE
MEMBERS ONLY
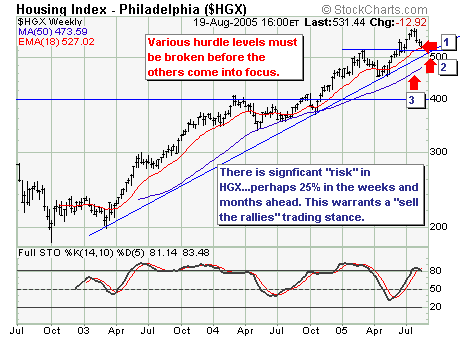
HOUSING INDEX ($HGX) COMING INTO CLEAR FOCUS
The current broader market decline has brought the Housing Index ($HGX) into clear focus; magazine after newspaper after TV show are talking about whether housing is overvalued and ready for a decline. We will save our thoughts for this for another time, but we do have some technical thoughts on...
READ MORE
MEMBERS ONLY
JOHN MURPHY'S BACK FROM VACATION
- After a week off, John's back at his perch, watching the markets like a hawk and reporting the technical developments to his subscribers. John reports that his trip to Yellowstone National Park and the Grand Tetons was spectacular and very relaxing although he did confess to sneaking...
READ MORE
MEMBERS ONLY
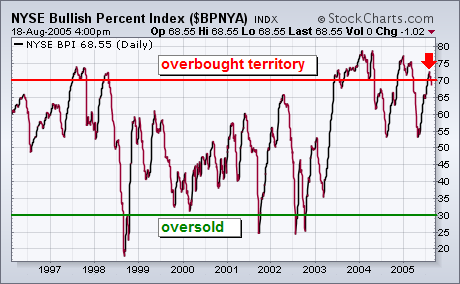
NYSE BULLISH PERCENT INDEX IS OVERBOUGHT ...
One of the ways to determine if the stock market is in a long-term overbought or oversold area is to chart the NYSE Bullish Percent Index which is shown in the chart below. The BPNYA measures the percent of stocks that are on point & figure buy signals. The two...
READ MORE
MEMBERS ONLY
Hello Fellow ChartWatchers!
The Dow continues to oscillate around 10,600 without much direction right now - sometimes getting near 10,700 - other times falling as low as 10,500. Now that the two major moving averages (50-day and 200-day) have essentially "merged" near the 10,550 mark, they should...
READ MORE
MEMBERS ONLY
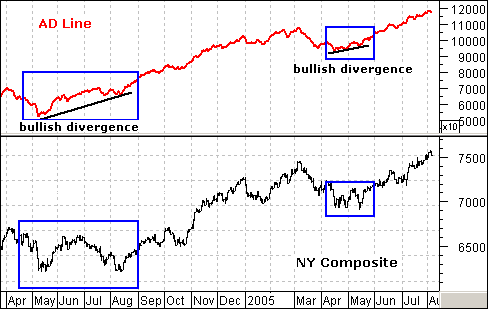
BREADTH REMAINS STRONG
Bullish and bearish divergences in the AD Line often precede significant bottoms and tops. Even though reversals are certainly possible when the AD Line is keeping pace, they are the exception rather than the rule. (Note: The Advance Decline Line is a cumulative measure of advancing issues less declining issues)...
READ MORE
MEMBERS ONLY
GOLDOLLAR INDEX SHOWS GOLD'S STRENGTH
Generally speaking, gold and the dollar have an inverse relationship -- a rising dollar causes the price of gold to decline and vice versa; however, supply and demand pressures also influence the price of gold, but it is often difficult to see them. For this we use the GolDollar Index....
READ MORE
MEMBERS ONLY
JOHN MURPHY ON VACATION THIS WEEK -
John is taking a well-deserved break this week. Watch for updates from other respected StockCharts commentators during John's absence.
SHARPCHARTS 2 BETA 7 PROGRESS REPORT - While it might seem we have not been making advances on this new service, behind the scene, we have greatly enhanced our...
READ MORE
MEMBERS ONLY
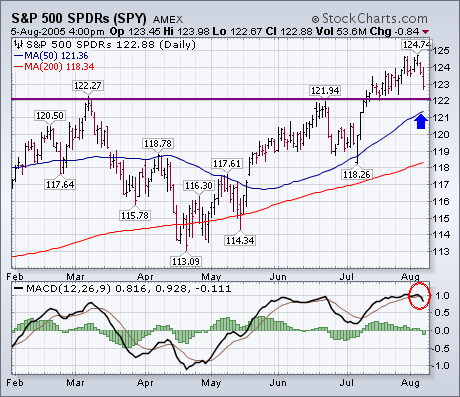
S&P CONTINUES TO WEAKEN, MACD TURNS DOWN ...
The market's short-term picture continues to weaken. Yesterday I wrote about the MACD lines for the S&P 500 being on the verge of turning negative. They did that today for the S&P and several other major market averages. That signals the start of a...
READ MORE
MEMBERS ONLY
Hello Fellow ChartWatchers!
Having cracked the 10,600 resistance level, the Dow immediately ran into problems at 10,700 and then Friday's session ended in a disappointing close back below 10,600. Volume has remained relatively light. All in all, a picture of a directionless market during the summer doldrums. But...
READ MORE
MEMBERS ONLY
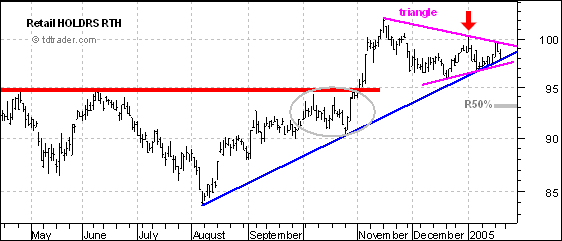
WHO STARTED THIS MESS ANYWAY?
January and 2005 have not been good for the bulls. After a strong finish in 2004, stocks were hit with strong selling pressure to begin the year and have yet to recover. A look into November and December reveals early weakness in two key groups. More importantly, traders can turn...
READ MORE
MEMBERS ONLY
OEX PUT/CALL RATIO SAYS BOTTOM NEAR
The Equity and OEX Put/Call Ratios generally signal overbought and oversold conditions that help identify price tops and bottoms; however, sometimes the OEX Put/Call Ratio will invert relative to the Equity Put/Call Ratio. At these times the inversion signals the opposite of what we would normally expect....
READ MORE
MEMBERS ONLY
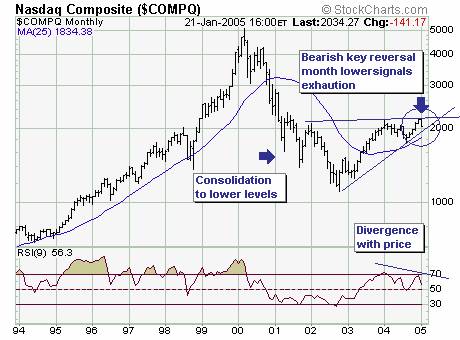
JANUARY DECLINE GAINING IMPORTANCE
The January decline to date is gaining in importance; if prices remain at current to lower levels through the next six trading sessions - then a bearish 'key reversal month' will form. This would signal 'exhaustion' of the uptrend, with any and all rallies considered selling...
READ MORE
MEMBERS ONLY

DOW STARTING TO CATCH UP...
A few weeks back I wrote about the close linkage between the Dow Transports and Industrials. At the time, both were threatening their spring lows. Now both are testing their June highs (see first chart). A Dow close through that barrier (combined with a similar upside breakout in the Transports)...
READ MORE
MEMBERS ONLY
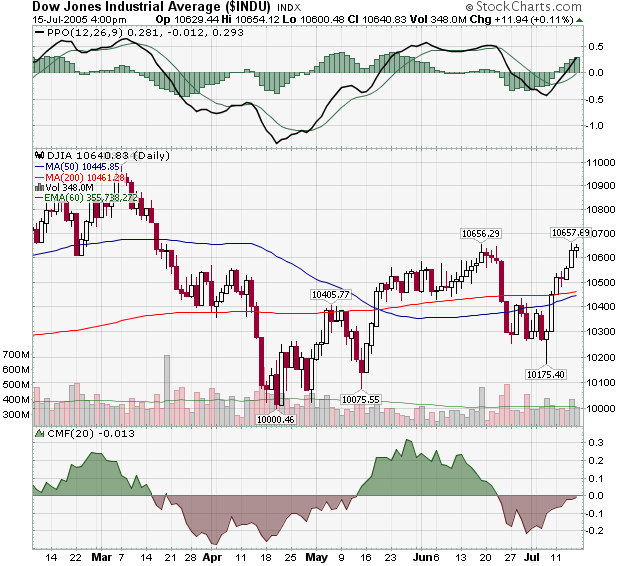
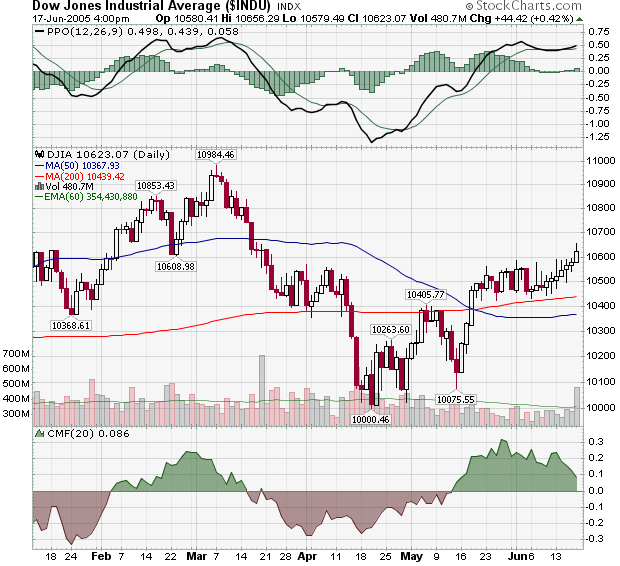
Hello Fellow ChartWatchers!
The market battled back impressively over the past week and a half and is re-testing the 10,600 resistance level that gave it so much trouble in mid-June (and May and late March).
With the CMF poised to move into positive territory, the PPO already positive, and the 50-day MA...
READ MORE
MEMBERS ONLY
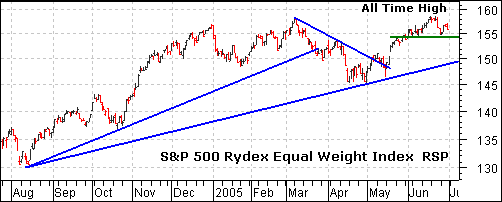
ENERGY AND STOCKS MOVING STEP FOR STEP
The Rydex Equal Weight S&P 500 Index (RSP) moved to a new all time high last week. Strangely enough, the Energy SPDR (XLE) moved to a new all time high two weeks ago. It is clear that Energy stocks have the best of both worlds: rising demand and...
READ MORE
MEMBERS ONLY
SMALL-CAP PARTICIPATION NARROWING
A good measure of market participation -- the number of stocks participating in upside price moves -- is the percentage of stocks above their 200-day moving average. DecisionPoint.com tracks this number on the major market indexes, and in this instance we are looking at this indicator for the S&...
READ MORE
MEMBERS ONLY
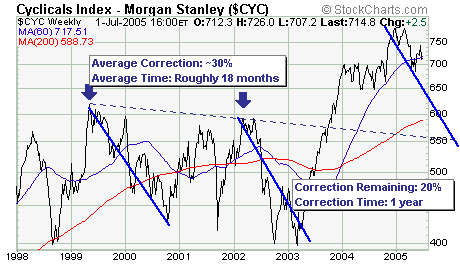
MS CYCLICAL INDEX IN MIDST OF CORRECTION
The MS Cyclical Index ($CYC) is quite interest rate sensitive; and thus prone to large corrections witness the past 7 year history of which there are two very distinct 30% corrections. Hence, given short-term rates are rising, we believe that the index is in the midst of another such correction...
READ MORE
MEMBERS ONLY
NEW ADDITION TO BOOKSTORE
ANOTHER NEW BOOK IN OUR BOOKSTORE -
Investing in a Secular Bear Market by Michael Alexander
This is the sequel to his 2000 book, Stock Cycles, which forecast the start of this secular bear market....
READ MORE
MEMBERS ONLY
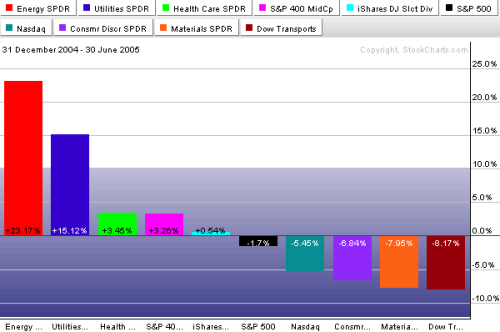
WINNERS AND LOSERS OF 2005, FIRST HALF RESULTS ...
The bars in the following chart show the best and worst group performers for the first half of the year. To no one's surprise, energy was the top sector -- while the fuel-sensitive transports were the weakest. Utilities took second place thanks to falling bond yields. Another defensive...
READ MORE
MEMBERS ONLY
Hello Fellow ChartWatchers!
The market erased the gains that we highlighted in our previous newsletter in one day as the 10,600 level on the Dow proved once again that it is an important level for the market. This week's big news of course was the Fed's rate hike....
READ MORE
MEMBERS ONLY
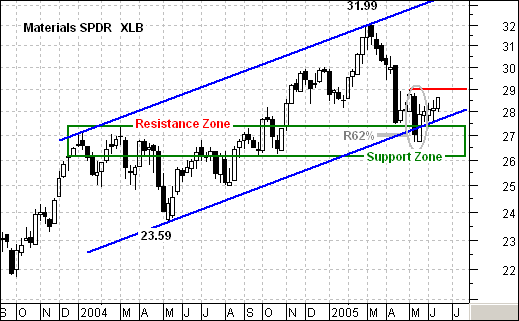
A MATERIAL BOTTOM ?
The Materials sector was all the rage in 2004, but fell on hard times in 2005. After a run from 23.59 to 31.99 (35%), the Materials SPDR (XLB) declined below 27 with a sharp decline. Was this enough to break the uptrend or is this just a sharp...
READ MORE
MEMBERS ONLY
EVIDENCE OF DISTRIBUTION
While persistently rising prices are frustrating the bears and encouraging the bulls, there is evidence that distribution is taking place.
On the first chart I have circled areas where daily volume has scooped below its 250-EMA line, indicating that there was inadequate sponsorship of the rising trend. In each of...
READ MORE
MEMBERS ONLY
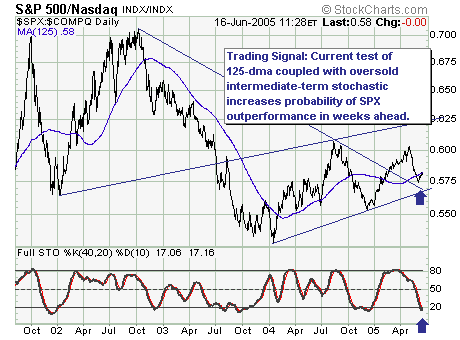
IMPRESSIVE ACTION IN THE S&P 500
The recent S&P 500 price action above the 1190 level is rather impressive, and can be considered a correction in 'time' rather than in price. This suggests new highs; however, those highs aren't expected to be accompanied by new highs in the Nasdaq Composite....
READ MORE
MEMBERS ONLY
NEW BOOKS ADDED TO OUR BOOKSTORE -
Unexpected Returns by Ed Easterling
A great book amplifying the merits of absolute return investing vs. relative return investing so often touted by Wall Street.
New Trading Systems and Methods by Perry Kaufman
This is the latest and biggest in this technical analysis classic. A must for indicator, systems, and...
READ MORE
MEMBERS ONLY
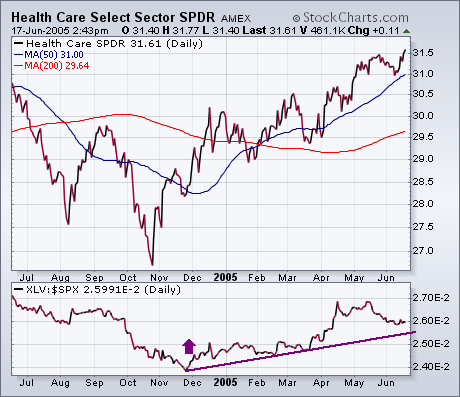
HEALTHCARE ETF HITS 52-WEEK HIGH ...
While a lot of attention has been paid to rising energy and basic material stocks this week, not much has been written about healthcare. It's time to correct that. Chart 1 shows the Health Care Sector SPDR (XLV) closing the week at a new 52-week high. [The only...
READ MORE
MEMBERS ONLY
Hello Fellow ChartWatchers!
Seven straight days of gains has moved the Dow back above the 10,600 level - something that looks even more impressive given Friday's significant volume increase. Next week should see a test of 10,600 as the index tries to consolidate its gains. Watch closely to see...
READ MORE
MEMBERS ONLY
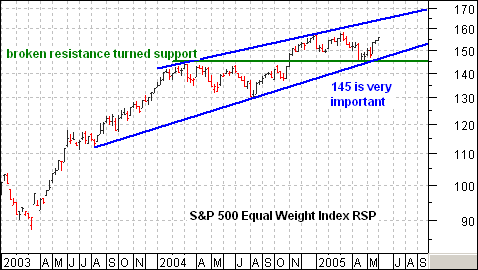
ABOUT THE RYDEX EQUAL WEIGHT S&P 500 INDEX (RSP)
As its name implies, the Rydex Equal Weight S&P 500 Index (RSP) treats all component equal, regardless of market capitalization. This means that ExxonMobile (XOM). with market cap of $369 billion, counts the same as Teco Energy TE), which has a market cap of just $3.64 billion....
READ MORE
MEMBERS ONLY
ENERGY SECTOR CASH FLOW IS TEPID
Decision Point tracks actual cash flowing into and out of Rydex mutual funds, and, while cash flow normally runs parallel to price, divergences can often appear ahead of price reversals. For example, let's look at Rydex Energy and Rydex Energy Service Funds.
During the last four weeks of...
READ MORE
MEMBERS ONLY
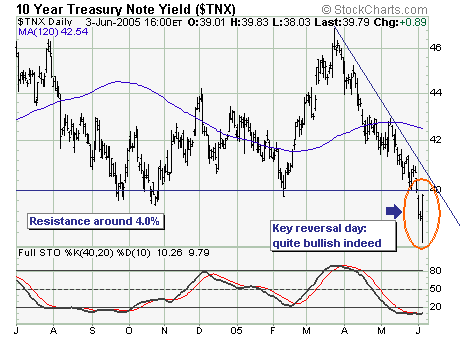
BOND REVERSAL MEAN MOVE FOR INTEREST RATES?
Rarely do they ring a 'bell' at the bottom, but Friday's reversal higher in bond yields argues strongly for a sustained move higher in interest rates. Quite simply, Friday's employment report was clearly on the 'weak side'; with the 10-year note yield...
READ MORE
MEMBERS ONLY
SHARPCHARTS 2 NEWS
- We took a big step forwards last week behind-the-scenes with our SharpCharts2 Beta program. Because SharpCharts2 is much more powerful, we've been working hard on making sure that our computer systems can support the additional load we will see once SharpCharts2 is officially released. Part of that...
READ MORE
MEMBERS ONLY
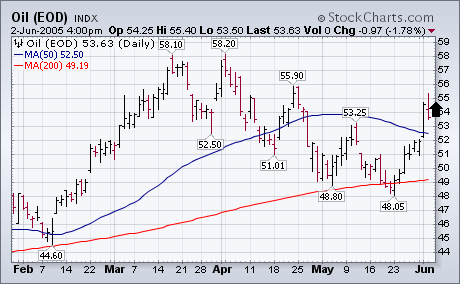
OIL ISN'T DEAD YET
...
A lot of recent optimism on the stock market and the economy has been predicated on the view that the historic rise in oil prices has probably ended. A lot of economists have also declared the major bull market in commodities over. Both of those predictions may prove to have...
READ MORE
