MEMBERS ONLY
VERY DANGEROUS MARKET
A bullish take on the stock market would be that (1) market indicators are very oversold, (2) there is a triple bottom setup on the S&P 100 Index, and (3) sentiment polls show a lot of bearishness. I agree that those conditions exist, but we are in a...
READ MORE
MEMBERS ONLY
SITE NEWS: "UNIVERSAL LOGIN" NOW WORKING
"UNIVERSAL LOGIN" NOW WORKING - We've finally, finally, finally fixed something that has been bugging lots of people for a long time. In the past, we had two very different ways to log into our website. People who subscribed to our Extra or Basic charting service...
READ MORE
MEMBERS ONLY
SECTOR ROTATION SAYS BEARISH
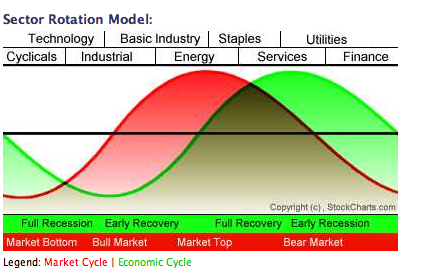
SECTOR ROTATION MODEL... One of our readers asked where we are in the Sector Rotation Model. That model shows the normal sector rotation that takes place at various stages in the business cycle. The chart shows that basic materials and energy are market leaders at a market peak. As the...
READ MORE
MEMBERS ONLY
UNAVOIDABLE BAD NEWS (AND HOW TO AVOID IT)
Hello Fellow ChartWatchers!
This week's edition of ChartWatchers is full of important information including a lively debate about the health of the market - Tom Bowley is actually optimistic (well... somewhat), Arthur Hill not so much. But first, I have several items that are super important for our...
READ MORE
MEMBERS ONLY
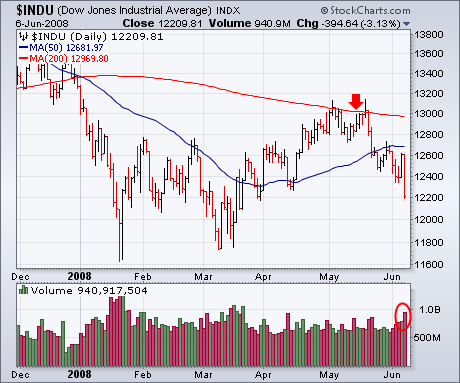
FINANCIALS LENDING NO SUPPORT
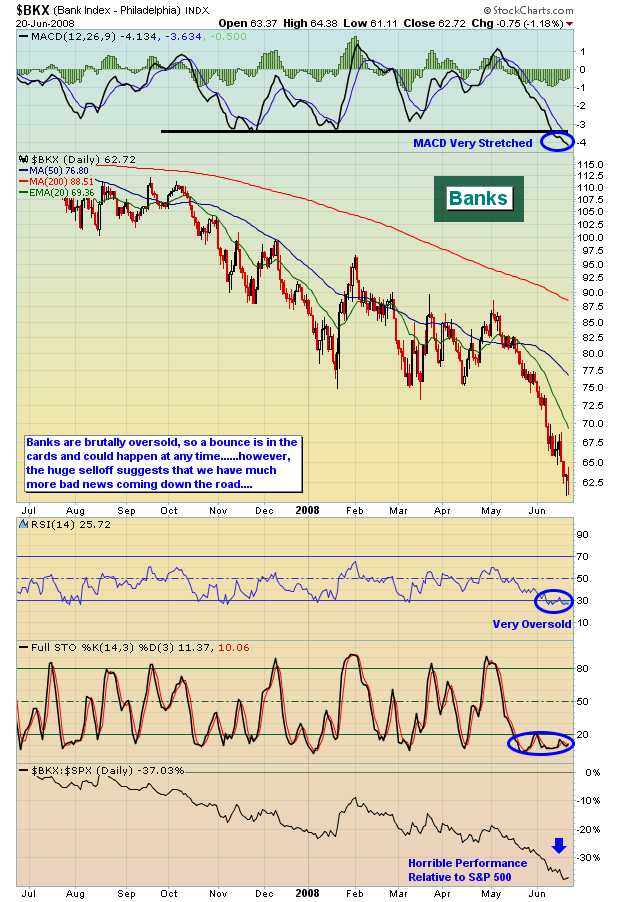
On May 19th, I discussed what appeared to be a topping market. Since that time, the Dow has lost 8.82%. The S&P 500 has lost 7.51%. The NASDAQ has lost 4.86%. The SOX has lost 9.24%. The XLF (an ETF that tracks financials) has...
READ MORE
MEMBERS ONLY
A LITTLE DANDRUFF FOR IWM
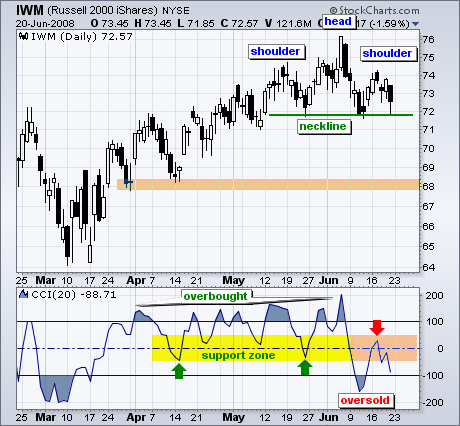
Despite a big decline in the S&P 500 ETF (SPY) over the last five weeks, the Russell 2000 ETF (IWM) has been holding up pretty well. However, a bearish reversal pattern and weakening momentum suggest that IWM will ultimately follow its big brother lower.
On the price chart,...
READ MORE
MEMBERS ONLY
IT'S STILL A BEAR & THE OIL BUBBLE
Discussions about the price of oil are in the news every day, but my observation is that, for the most part, these discussions serve only to confuse the public more. Most popular are the conspiracy theories, blaming the high prices on shadowy behind-the-scenes manipulators. These theories have one purpose, which...
READ MORE
MEMBERS ONLY
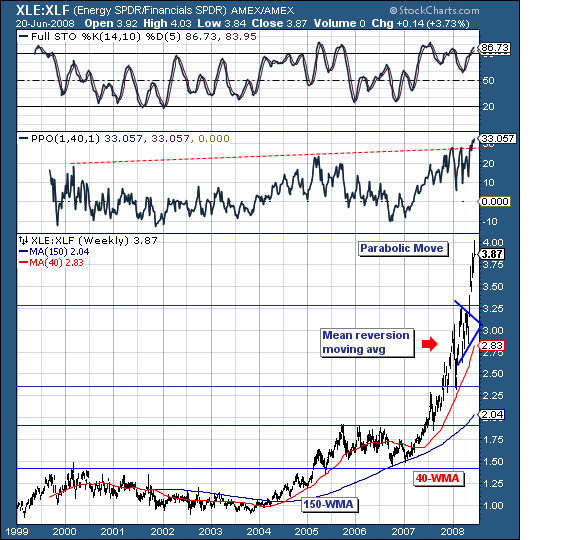
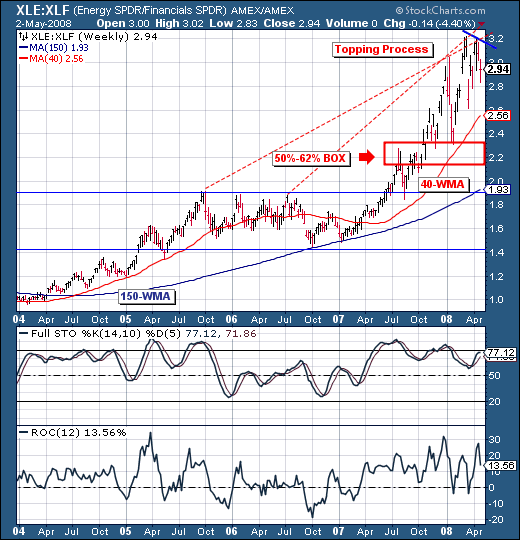
FOCUSING ON S&P ENERGY/FINANCIALS
As the world stock markets have embarked on what arguably is another "leg lower"; we are left to wonder aloud what the relative rotation beneath the surface of this decline will look like in terms of tactical allocation. Our focus has been upon the S&P Energy...
READ MORE
MEMBERS ONLY
FED'S IN A BOX, AND BEAR FUNDS ARE RISING
THE FED'S IN A BOX ... I've written recently about the Fed turning its attention away from the economy and back to inflation. Unfortunately, this week's market downturn is going to make its job a lot harder. The Fed apparently concluded that its easing program...
READ MORE
MEMBERS ONLY
CHARTNOTES IMPROVEMENTS
This weekend we've updated our ChartNotes chart annotation tool. On the surface everything looks the same, but for frequent ChartNotes users that are willing to remember a couple of new keyboard/mouse combinations, things should be much better. We've also thrown in some extra Fibonacci Lines...
READ MORE
MEMBERS ONLY
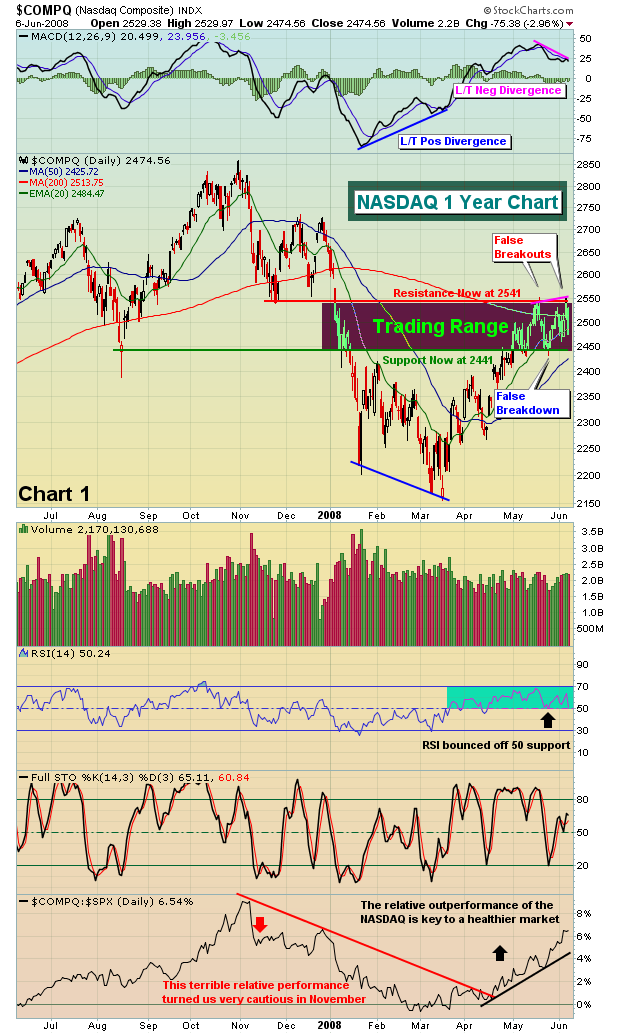
RESISTANCE HOLDING, BAD NEWS FOR BULLS
Let's focus first on one of the strongest indices, the NASDAQ. Technology stocks have been performing quite well and there's been a challenge for the tech-heavy NASDAQ to pierce price resistance at 2541. Thursday's close of 2549 was enticing, but volume was just moderate...
READ MORE
MEMBERS ONLY

SMACK DOWN AT RESISTANCE
Even though techs and small-caps have been showing relative strength the last several weeks, the Nasdaq and the Russell 2000 are running into stiff resistance of their own. Their charts show similar setups that point to a medium-term peak.
First, let's look at the reasons for resistance. Both...
READ MORE
MEMBERS ONLY
THREE MARKET VIEWS
There are three market indexes that capture the most attention: The Dow Jones Industrial Average (DJIA), the S&P 500 Index (SPX), and the Nasdaq 100 Index (NDX). Together they represent about 80% of the total U.S. market capitalization. While they are normally more or less in sync...
READ MORE
MEMBERS ONLY
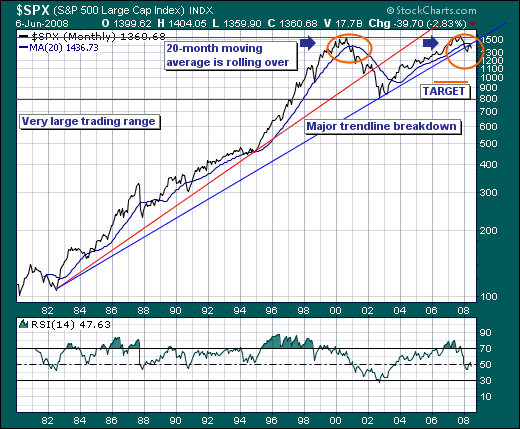
LOOKING TOWARDS THE HORIZON
When markets become as volatile as they have in the past week; it is best to stand back and take a look at the longer-term time horizon. We like to use the S&P 500 as our proxy; and as week look at the monthly chart - we find...
READ MORE
MEMBERS ONLY
BEARISH FORCES RETAKE THE MARKET
There have been two consistent themes that myself and Arthur Hill have been stressing in recent Market Messages. One has been that the rally from mid-March is a bear market rally. The other has been that the rally has probably ended. That dual reality was brought into sharper focus on...
READ MORE
MEMBERS ONLY
TIME INDEPENDENT CHARTS REDUCE EMOTIONAL INVESTING
StockCharts now has four different "time independent" forms of charting. I thought I'd take some time this week to introduce you to all four.
A "Time Independent" chart is a chart that doesn't have a consistent horizontal axis. On a typical price...
READ MORE
MEMBERS ONLY
LOOKING A LITTLE TOPPY
I've been bullish since my earlier bottom call in January. There were several reasons for the call, but in particular there were contrarian indicators moving off the charts in the bearish direction. That suggested that the next move in the market would be higher - and it was....
READ MORE
MEMBERS ONLY
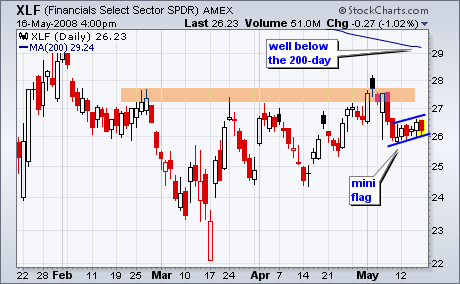
FINANCE AND HEALTHCARE LAG
Money may be moving into Technology, but it is avoiding Finance and Healthcare. While the Dow Industrials ETF and S&P 500 ETF both touched their 200-day moving averages in May, the Finance SPDR (XLF) and the Healthcare SPDR (XLV) fell well short of their 200-day lines. The inability...
READ MORE
MEMBERS ONLY
LOOKING BULLISH BUT OVERBOUGHT
Our long-term model remains on a sell signal, so we have to assume that we are still in a bear market; however, the rally from the March lows has taken prices far enough to cause important bullish signs to appear: (1) The intermediate-term model for the S&P 500...
READ MORE
MEMBERS ONLY
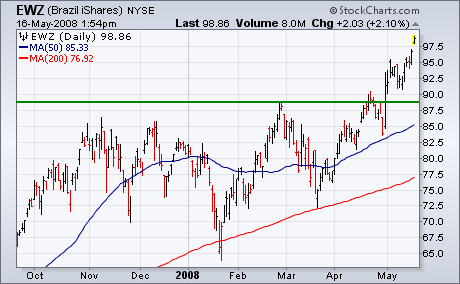
COMMODITY COUNTRIES HIT NEW HIGHS
On Monday, I wrote about three foreign stock markets that were at or close to new record highs. Those three markets are Brazil, Canada, and Russia. What all three have in common was that they are producers and exporters of commodities. By the end of the week, all three markets...
READ MORE
MEMBERS ONLY
ON THE DANGERS OF WEB ACCELERATORS
Last week, we started getting disturbing reports from several users about seeing the wrong name at the top of the page after they logged in to StockCharts.com. That set off HUGE RED WARNING LIGHTS here. We have numerous safeguards in place to make sure that people only see their...
READ MORE
MEMBERS ONLY
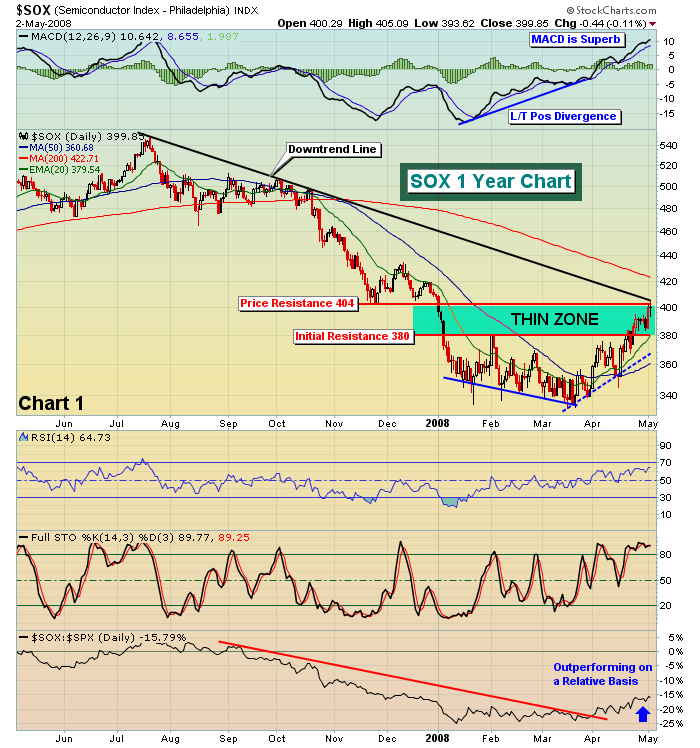
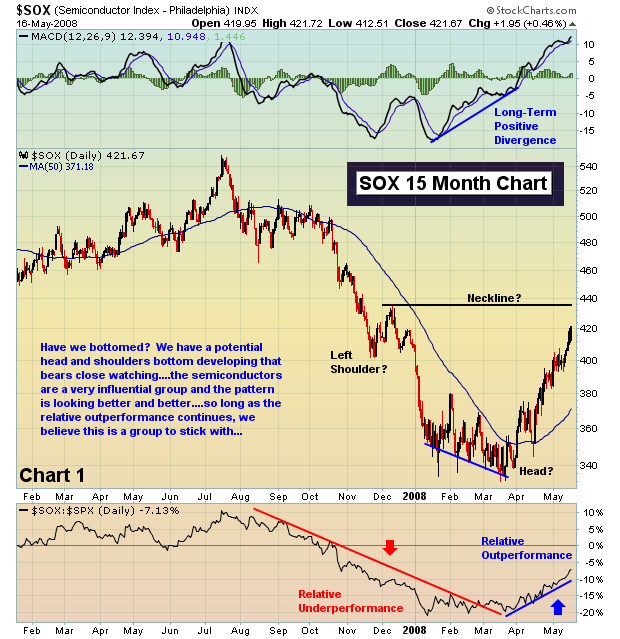
SEMICONDUCTORS AND FINANCIALS HELPING TO LEAD TURNAROUND
It's been a long time since we've spoken about semiconductors or financials in a positive light. But times have changed and so have the charts for these two influential groups. Semiconductors are showing clear relative outperformance, but have now reached a critical resistance area. Check out...
READ MORE
MEMBERS ONLY
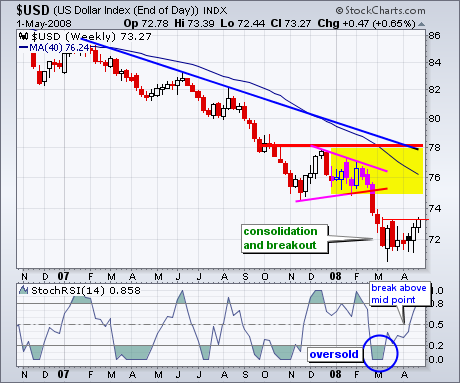
U.S. DOLLAR INDEX GETS A BOUNCE
The U.S. Dollar Index ($USD) remains in a long-term downtrend, but the index is showing signs of strength with a consolidation breakout this week. After becoming oversold in March, the index firmed for 6-7 weeks and surged above its mid March highs this week. StochRSI moved below .20 in...
READ MORE
MEMBERS ONLY
SIX-MONTH UNFAVORABLE SEASONALITY PERIOD BEGINS
Something you will be hearing a lot about for a while is that for the next six months the market will be carrying extra drag caused by negative seasonality. Research published by Yale Hirsch in the "Trader's Almanac" shows that the market year is broken into...
READ MORE
MEMBERS ONLY
"ROLLING CORRECTIONS" BENEATH THE SURFACE
It is rather clear there are ongoing "rolling corrections" beneath the surface in today's markets. In terms of performance, whether one is bullish or bearish on the broader market hasn't made as much of a difference as we would have thought. But understanding where...
READ MORE
MEMBERS ONLY
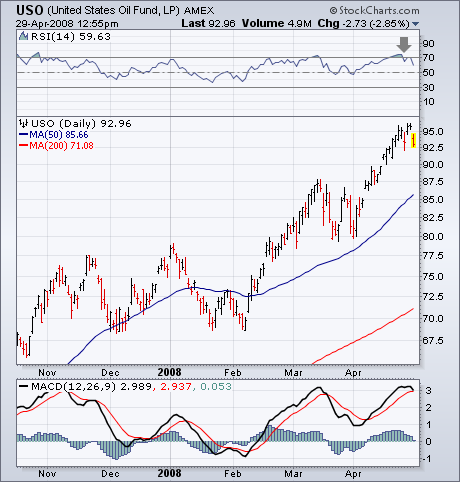
CRUDE AND NATURAL GAS LOOK OVERBOUGHT
When only one commodity group is hitting new highs, that's usually a sign that it's out of step with the others. That seems to be the case with energy. I still believe that the energy complex is due for some profit-taking. Chart 1 shows the United...
READ MORE
MEMBERS ONLY
CLOUDS GATHERING ON THE HORIZON
Clouds are gathering on your charting radar - can you see them? No, no - I'm not talking about the recent bad news on the US economy or the price of oil or any of that stuff. I'm talking about another new kind of chart that...
READ MORE
MEMBERS ONLY
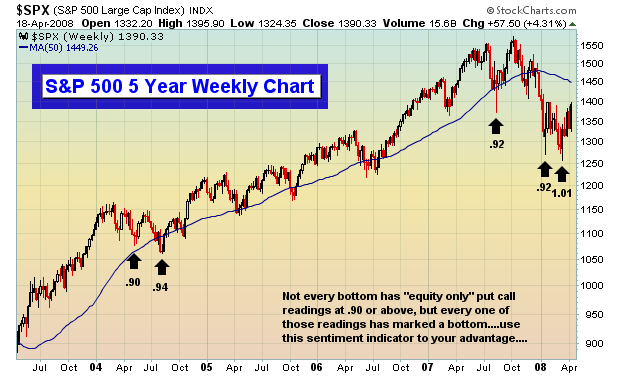
THE GAME HAS CHANGED
In the February 3rd edition of ChartWatchers, I made a bold prediction that the market had bottomed with the January lows. I did so because of the extreme pessimism in the options world. If you go back to 1995, the year that the Chicago Board Options Exchange began providing investors...
READ MORE
MEMBERS ONLY
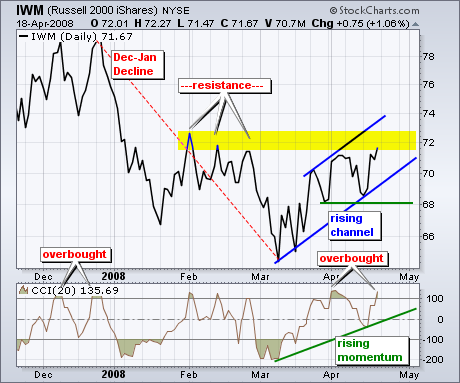
IMW VENTURES INTO RESISTANCE ZONE
Despite a big advance over the last few weeks, the Russell 2000 ETF (IWM) entered a resistance zone and has become overbought. There are two reasons to expect resistance around 72. First, the three February highs mark resistance in this area. Second, a 50% retracement of the December-January decline would...
READ MORE
MEMBERS ONLY
SUSPICIOUS GAPS
On Wednesday and Friday of this week the market opened up with large gaps from the previous closing price, and I think this activity is suspicious, possibly contrived. It is, after all, options expiration week, and weird market action can be expected. This week it is likely that the big...
READ MORE
MEMBERS ONLY
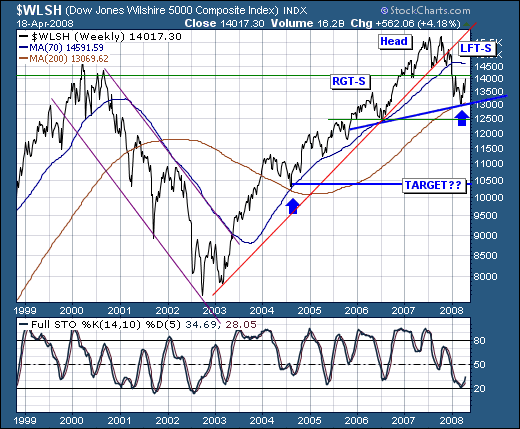
STORM ON THE HORIZON
The intermediate-term broader market technical condition is improving; however, we believe that this "improvement" is nothing more than a respite before the larger storm develops. First, let's note that the Wilshire 5000 has broken its bull market trendline off its 2003-2006 lows, and remains on the...
READ MORE
MEMBERS ONLY
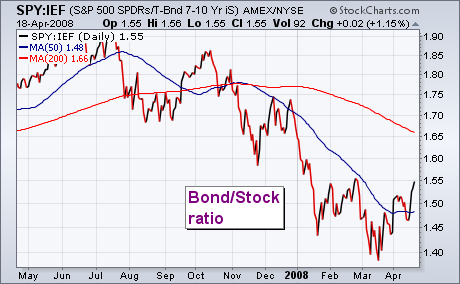
PENDULUM SWINGS BACK TO STOCKS
This week's market action has been characterized by stock buying and bond selling. The change in the relationship between those two markets is shown in the chart below which plots a ratio of the 7-10 Year Treasury Bond Fund (IEF) by the S&P 500 SPDRS (SPY)...
READ MORE
MEMBERS ONLY
KAGI AND RENKO CHARTS COME TO TOWN
StockCharts.com is pleased to announce that we have just added Kagi and Renko charting formats to our site. Go. Check em out.
Hmmm... Why are you still here? Oh, right. Not everyone knows what Kagi and Renko charts are. Well, lemme show you what a Kagi chart looks like...
READ MORE
MEMBERS ONLY
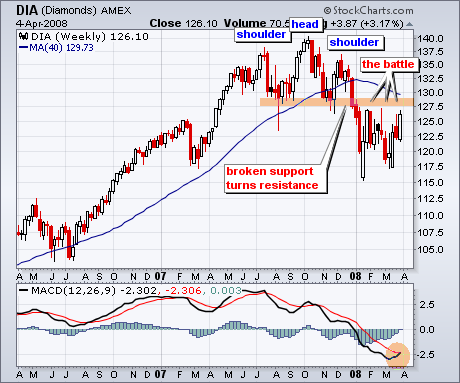
DIA BATTLES RESISTANCE
Despite some volatile price action the last few months, the Dow Industrials ETF (DIA) remains below a major support break and has yet to win the battle at resistance. DIA formed a rather large head-and-shoulders pattern in 2007 and broke support with a sharp decline in January. This support zone...
READ MORE
MEMBERS ONLY
A LOOK AT (COUGH, COUGH) FUNDAMENTALS
As a technician I rarely look at fundamentals, primarily because they are not directly useful in making trading decisions; however, while fundamentals are not primary timing tools, they can be useful in establishing a broader context within which technical indicators can be interpreted. For example, one of the reports the...
READ MORE
MEMBERS ONLY

METAL AND OIL SERVICE STOCKS ARE BREAKING OUT TO THE UPSIDE
Throughout the market problems of the first quarter, stocks tied to basic materials have been the top performing sector. That's also been true over the last week. The chart below shows the Materials SPDR (XLB) trading over 43 today for the first time this year. That puts in...
READ MORE
MEMBERS ONLY
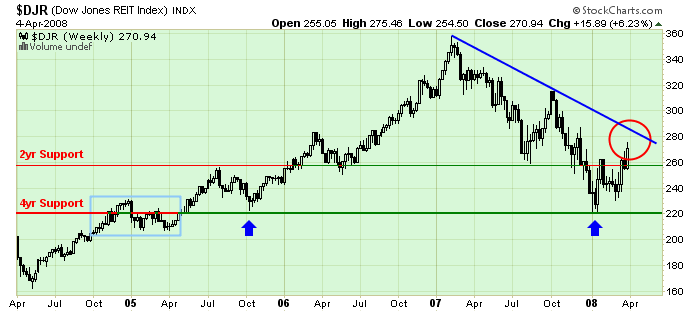
WHEN TRENDLINES COLLIDE
Hello Fellow ChartWatchers!
The Real Estate industry is undergoing lots of challenges right now. Let's see how those challenges are affecting the REIT charts. Check out the current chart for the Dow Jones REIT index:
The problem with REITs is clear here - the blue downtrend line that...
READ MORE
MEMBERS ONLY
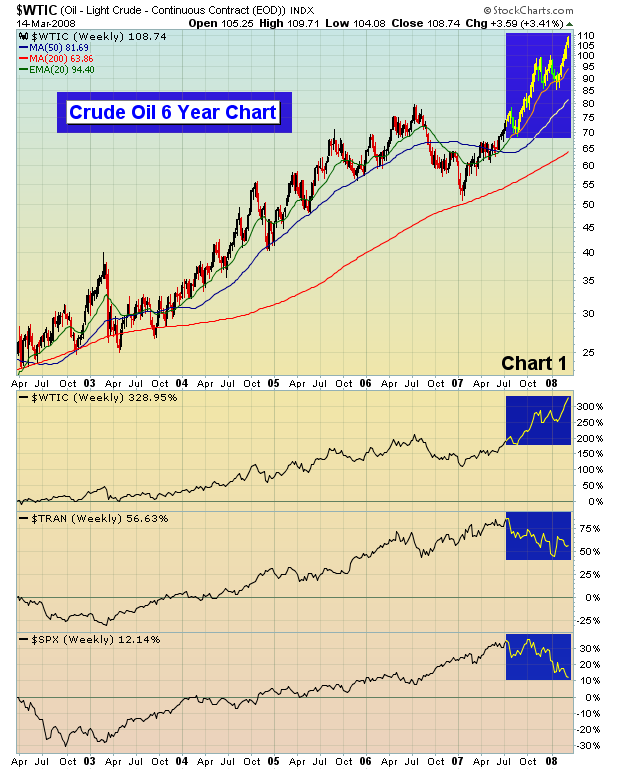
OIL PRICES, TRANSPORTS AND THE NEXT BUBBLE
It makes perfect sense that higher oil prices could derail (no pun intended) transports as the implications are clear. But the truth might surprise you. From Chart 1 below, you'll see that oil prices have been rising dramatically over the past 6 years. The price per oil was...
READ MORE
MEMBERS ONLY
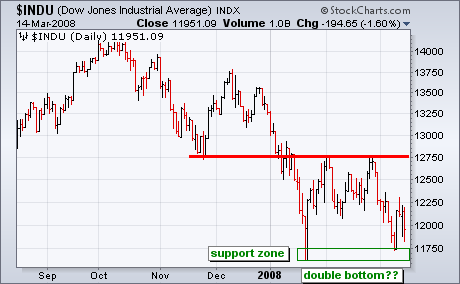
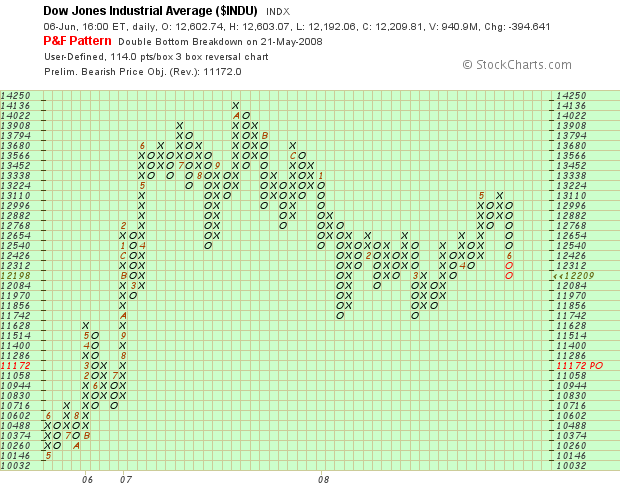
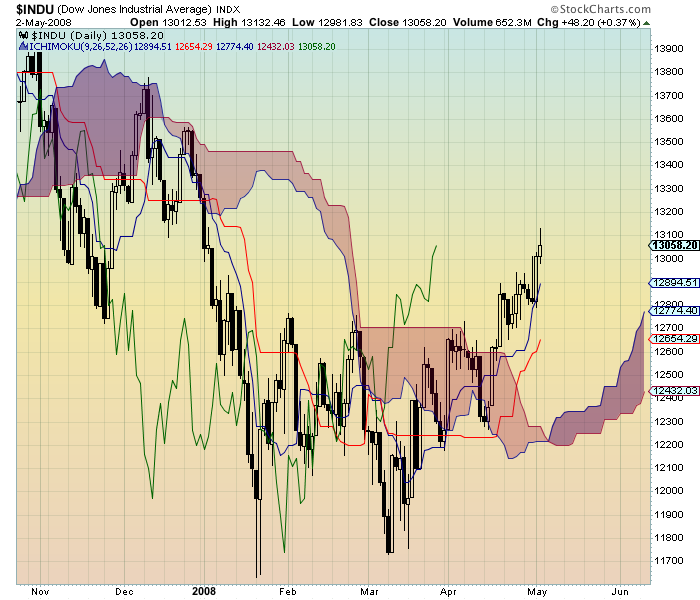
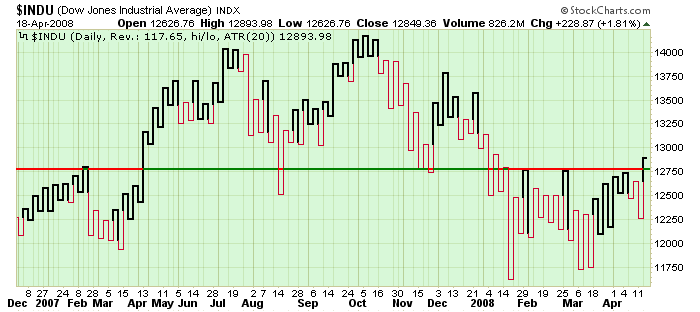
THE DOW AND THE JANUARY LOW
Technical analysis is a little art and a little science, which makes it subjective and open to interpretation. It is kind of like, gasp, economics. With a test of the January lows and a big surge on Tuesday, some pundits are talking double bottom. The interpretation of this double bottom...
READ MORE
MEMBERS ONLY
GET A LONG-TERM PERSPECTIVE
One of the reasons that Decision Point has spent so much time and money to create dozens of long-term historical chart series is that we must often compare current price and indicator behavior to prior periods where market action has been similar. For example, we are currently in a bear...
READ MORE
