MEMBERS ONLY
S&P 500 Using Ichimoku Cloud Model
by David Keller,
President and Chief Strategist, Sierra Alpha Research
The Ichimoku cloud model (often just referred to as the "cloud model") is a traditional Japanese technical indicator which actually combines three separate trend-following devices. I spent some time on Japanese trading desks earlier in my career, and was always fascinated at how much I would see candlestick...
READ MORE
MEMBERS ONLY
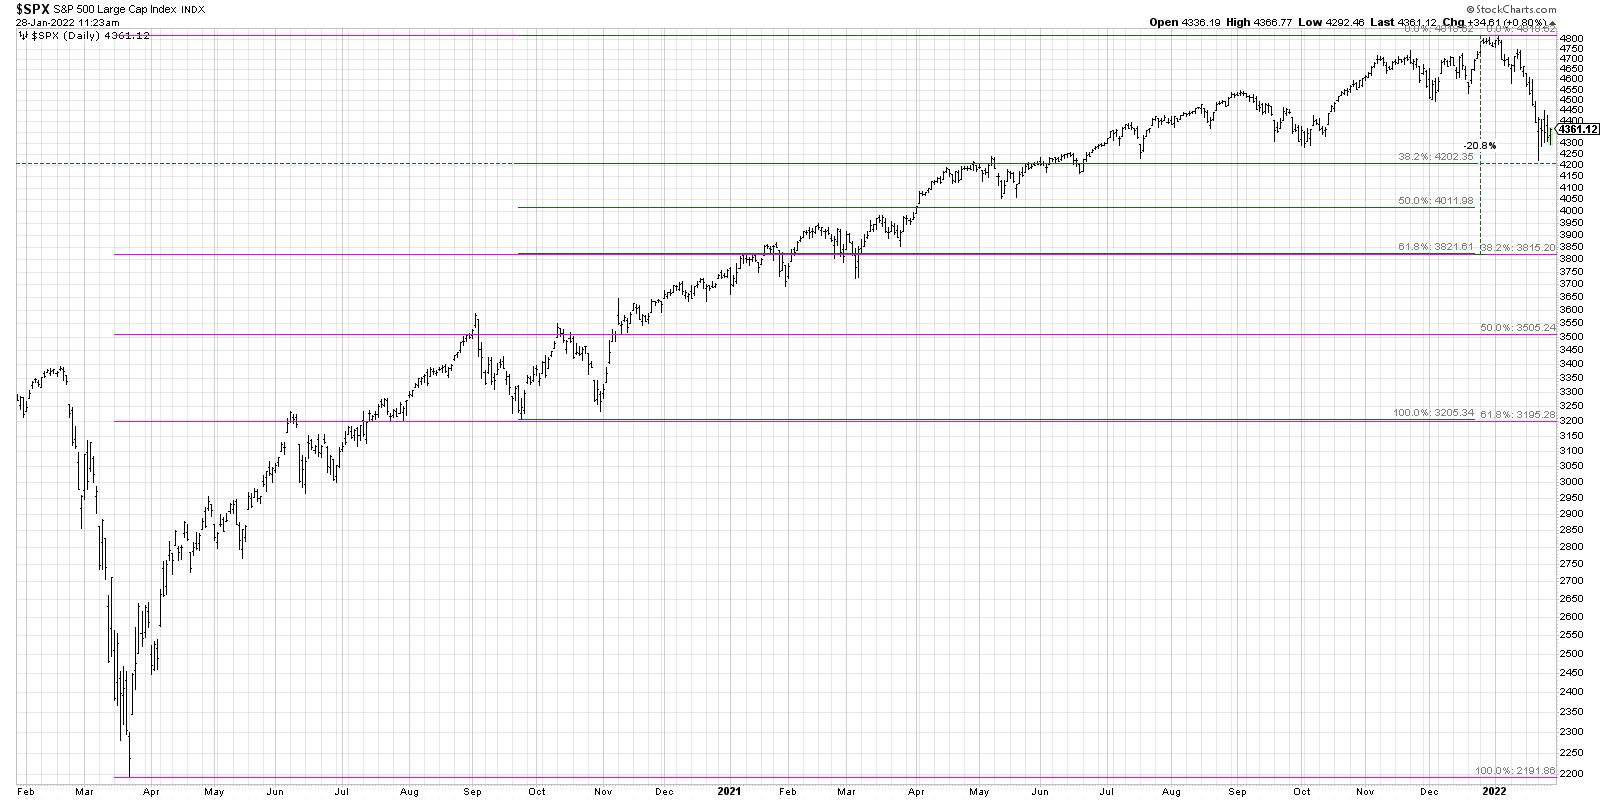
Downside S&P Projections Using Fibonacci
by David Keller,
President and Chief Strategist, Sierra Alpha Research
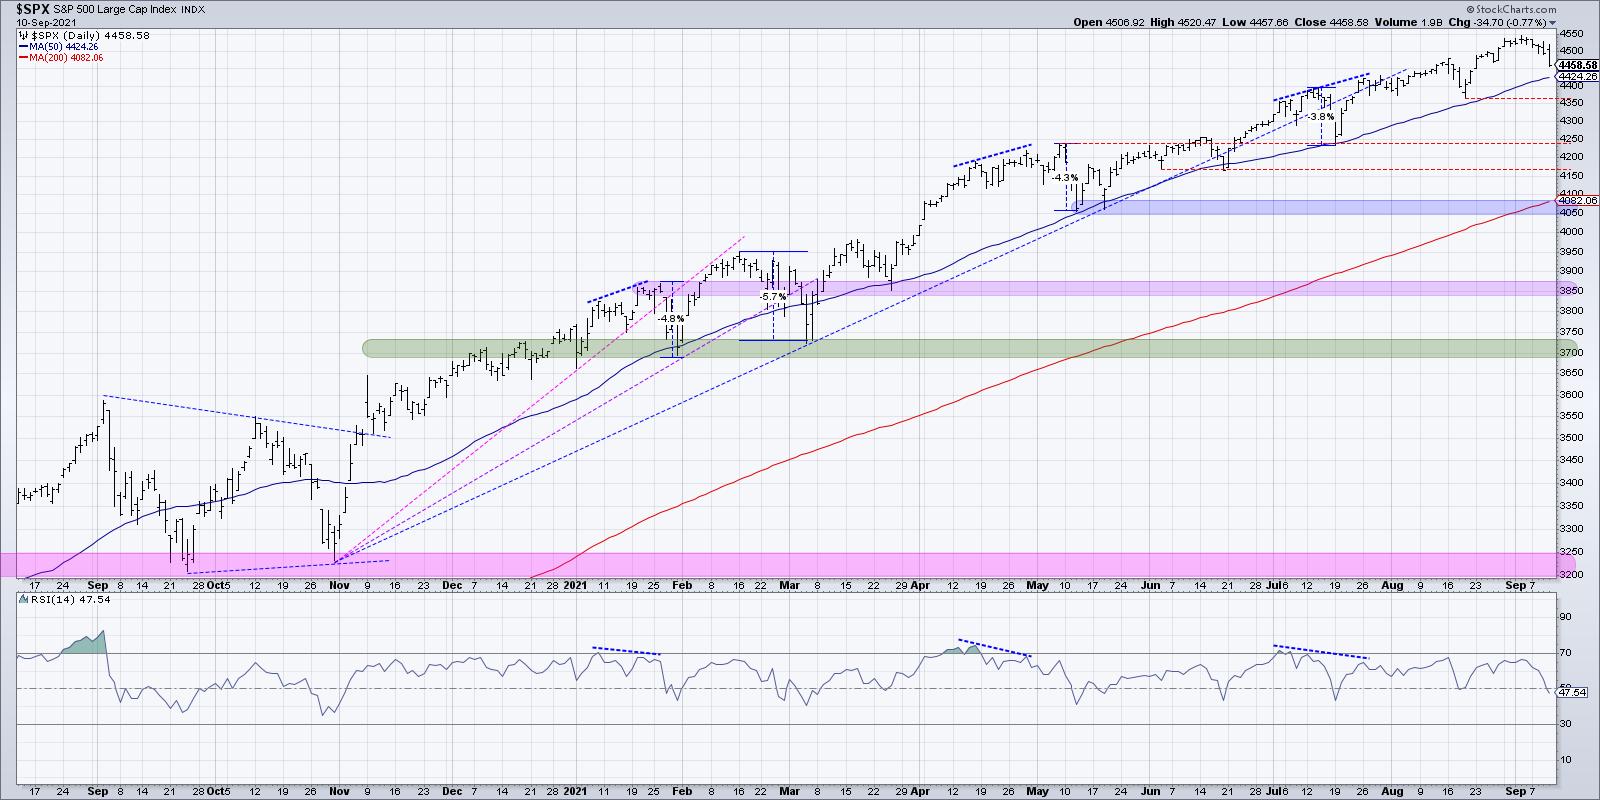
I recently posted a video on four potential paths for the S&P 500, from the very bullish (S&P gets over 4800 in the next six weeks) to the very bearish (S&P breaks below 4000).Today, I wanted to dig a little deeper into using...
READ MORE
MEMBERS ONLY
Hindenburg Omen Signals Downside Potential
by David Keller,
President and Chief Strategist, Sierra Alpha Research
The Hindenburg Omen is a bit of a controversial indicator. I often get asked about it from financial media outlets, as the name itself is enough to stir up investor fear. What is this indicator, and what can it tell us about current market conditions?
The Hindenburg Omen was developed...
READ MORE
MEMBERS ONLY
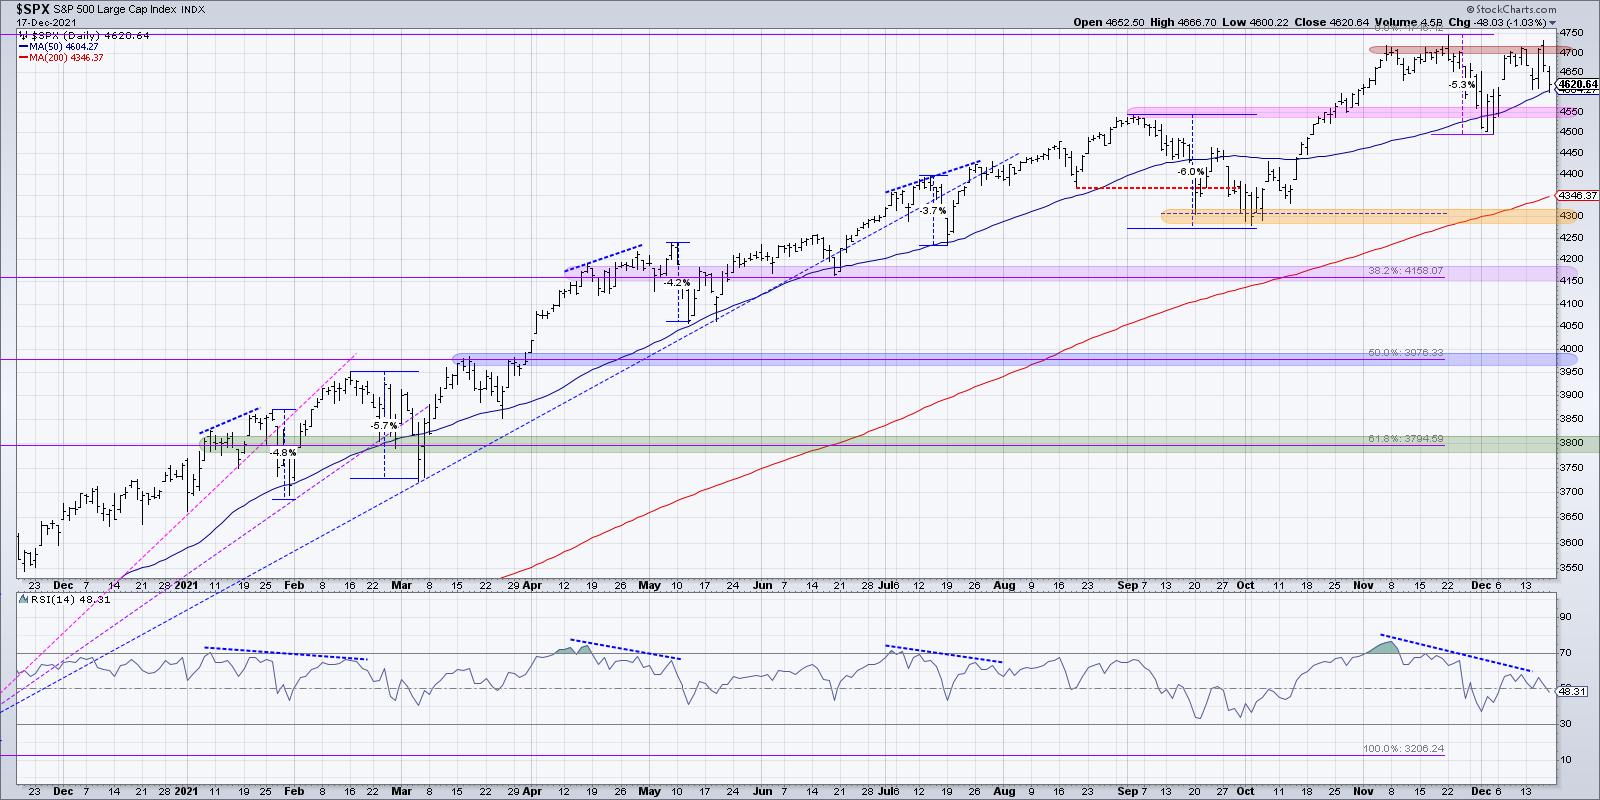
Why is SPX 4550 So Important?
by David Keller,
President and Chief Strategist, Sierra Alpha Research
So far in 2022, we've seen elevated volatility, yet another test of the 50-day moving averagefor the S&P 500, and renewed strength incyclical sectors over growth. If you were looking for a nice break after the uncertainty of 2021, I'm sure you are quite...
READ MORE
MEMBERS ONLY
Ten Questions to Ask Yourself at Year-End
by David Keller,
President and Chief Strategist, Sierra Alpha Research
The week between Christmas and New Year's is a special week for me. I actually call it "Power Week", and it is basically a week-long process of taking a step back from the "flickering ticks" of day-to-day life to focus on the long-term.
Part...
READ MORE
MEMBERS ONLY
Top Five Charts of 2021
by David Keller,
President and Chief Strategist, Sierra Alpha Research
Try to summarize 2021 in one word.
"Rotational."
"Uncertain."
"Volatile."
Perhaps all of the above?
This year has been all about leadership rotation, with growth names, value stocks and even defensive sectors all spending some time as the strongest performers in a given month....
READ MORE
MEMBERS ONLY
Bearish Divergence Continues for S&P 500
by David Keller,
President and Chief Strategist, Sierra Alpha Research
Something changed on November 5, 2021.
The S&P 500 had successfully broken up through the previous resistance level around 4550; early November saw the benchmark continue higher to finally reach 2700 on November 5th. Until that first Friday in November, the S&P 500 appeared to be...
READ MORE
MEMBERS ONLY
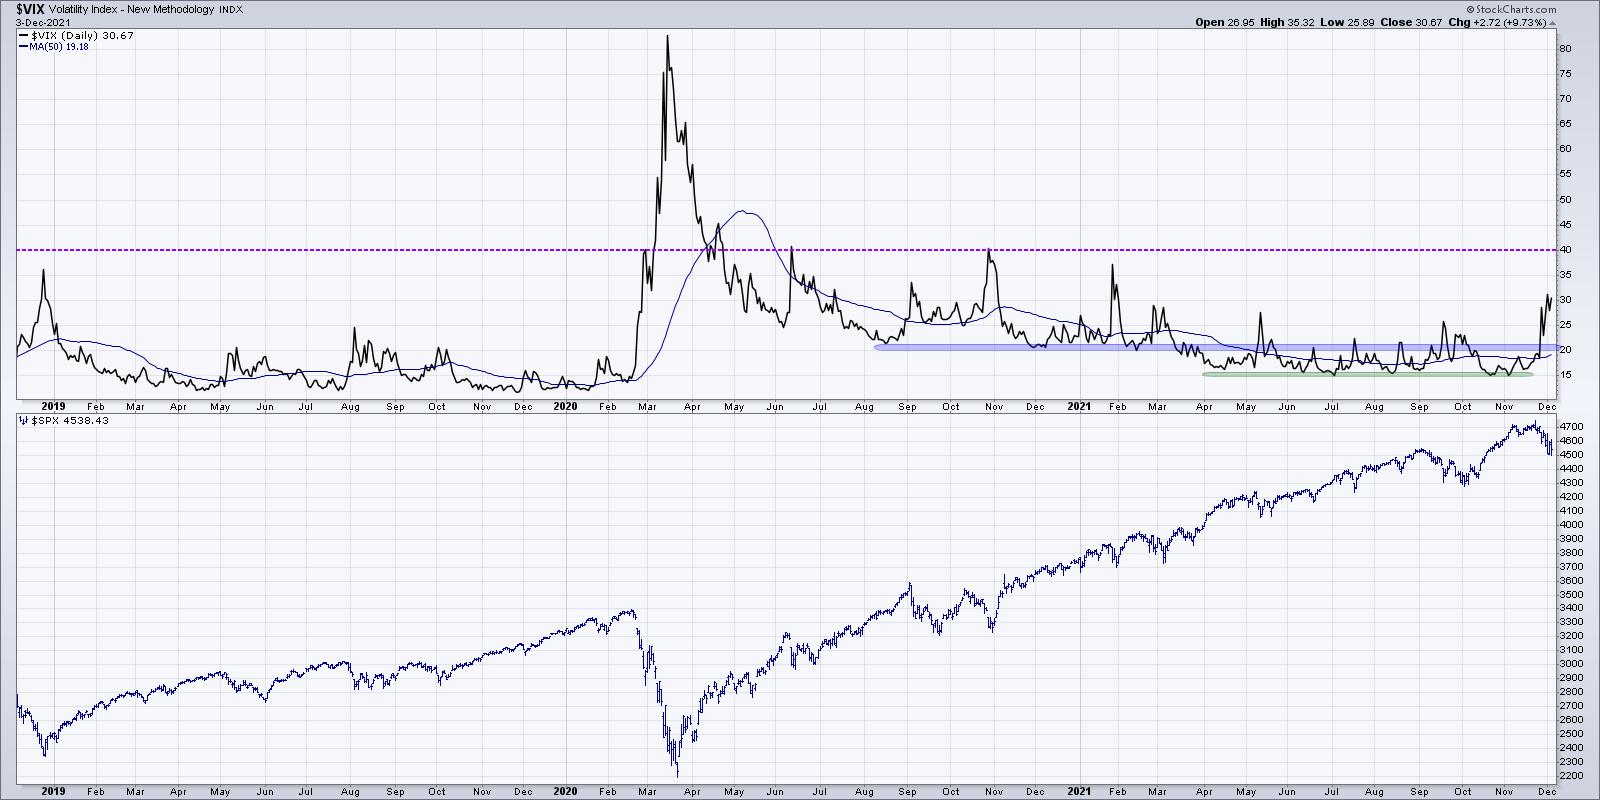
Spike in Volatility Bearish for Stocks?
by David Keller,
President and Chief Strategist, Sierra Alpha Research
The VIX spiked above 30 this week, making that the highest level since January 2021. But is a rapid rise in volatility necessarily bearish for stocks?
In my conversation with Marc Chaikinearlier this week onThe Final Bar, we talked about the move higher in the VIX and how that relates...
READ MORE
MEMBERS ONLY
Five Stocks I'm Watching Next Week
by David Keller,
President and Chief Strategist, Sierra Alpha Research
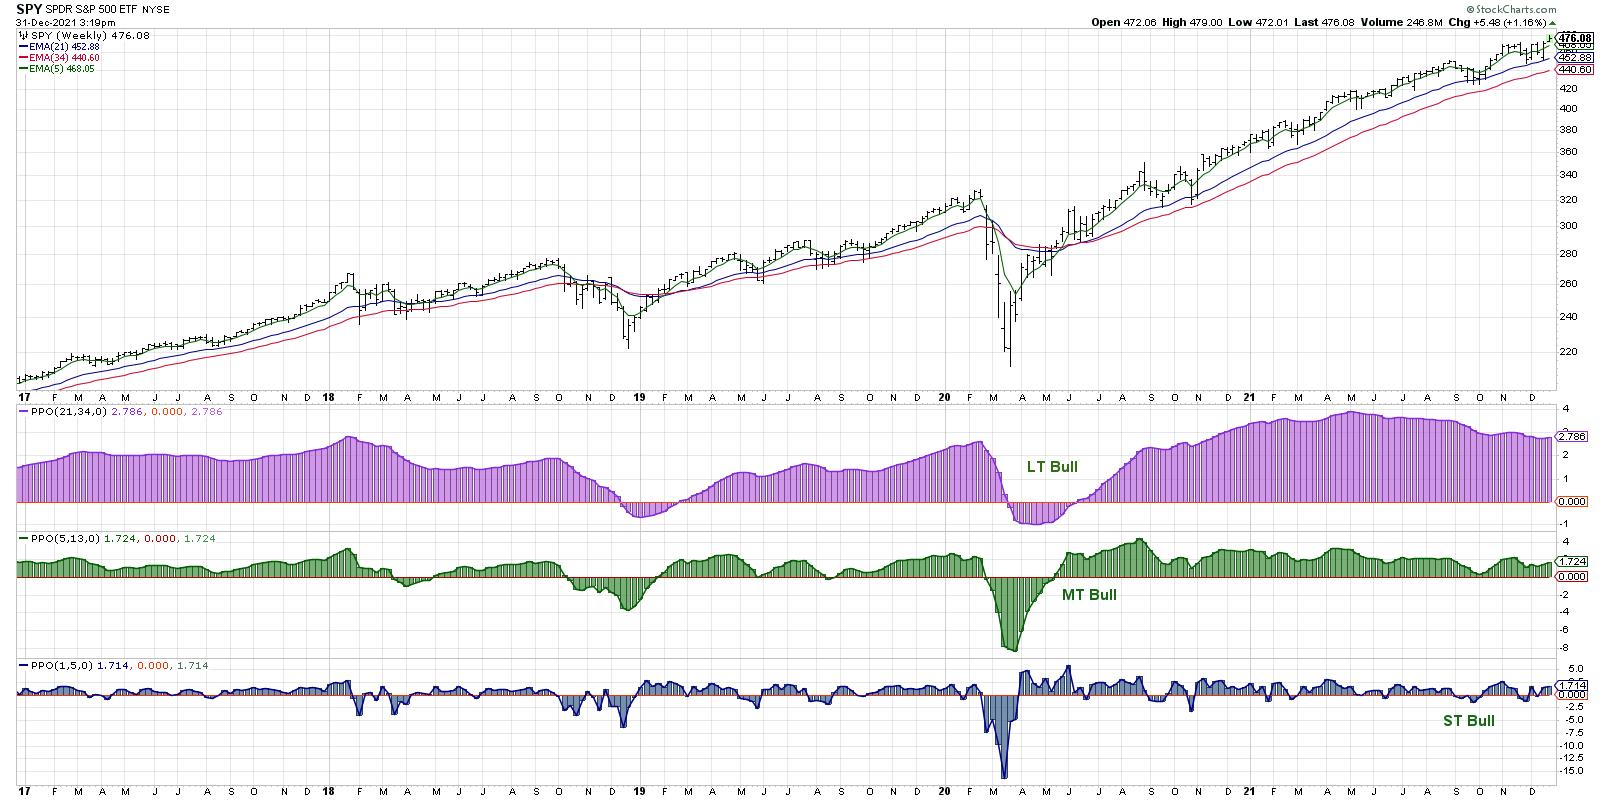
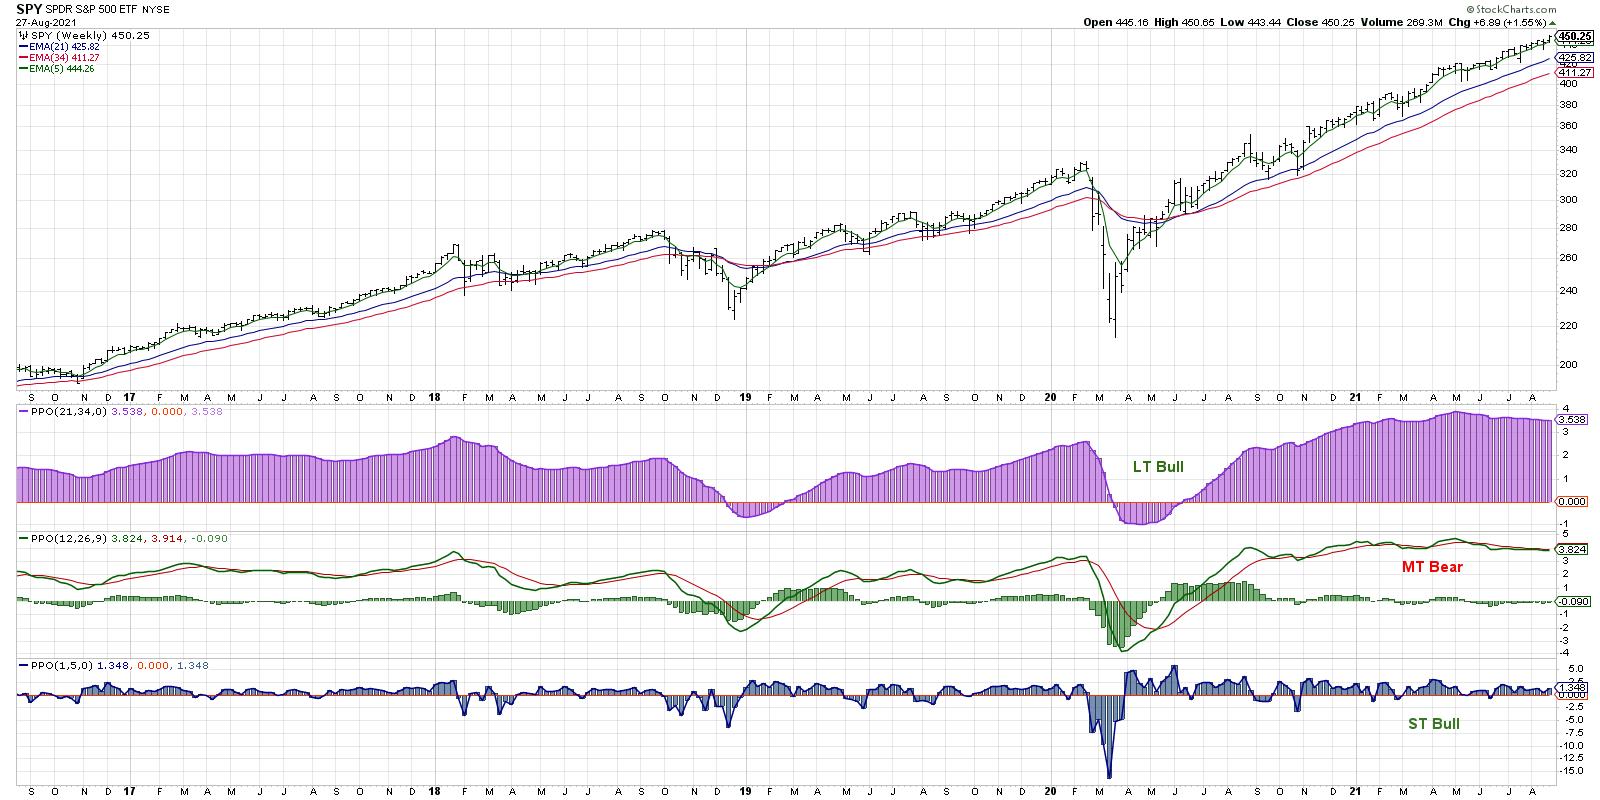
My Market Trend Modelremains positive on all three time frames, which means I focus on three main goals: identify breakout opportunities with upside potential, lean into positive trends that continue to work and, lastly, look for signs of weakness that may indicate thebull market phase is exhausted.
On Friday'...
READ MORE
MEMBERS ONLY
When is the S&P 500 No Longer Bullish?
by David Keller,
President and Chief Strategist, Sierra Alpha Research
One of the best parts of hosting The Final Bar on StockCharts TVis the opportunity to compare notes with some of the top technical analysts and traders in the markets.In my recent discussions, we've discussed new highs for the S&P 500, Nasdaq, Russell 2000, Dow...
READ MORE
MEMBERS ONLY
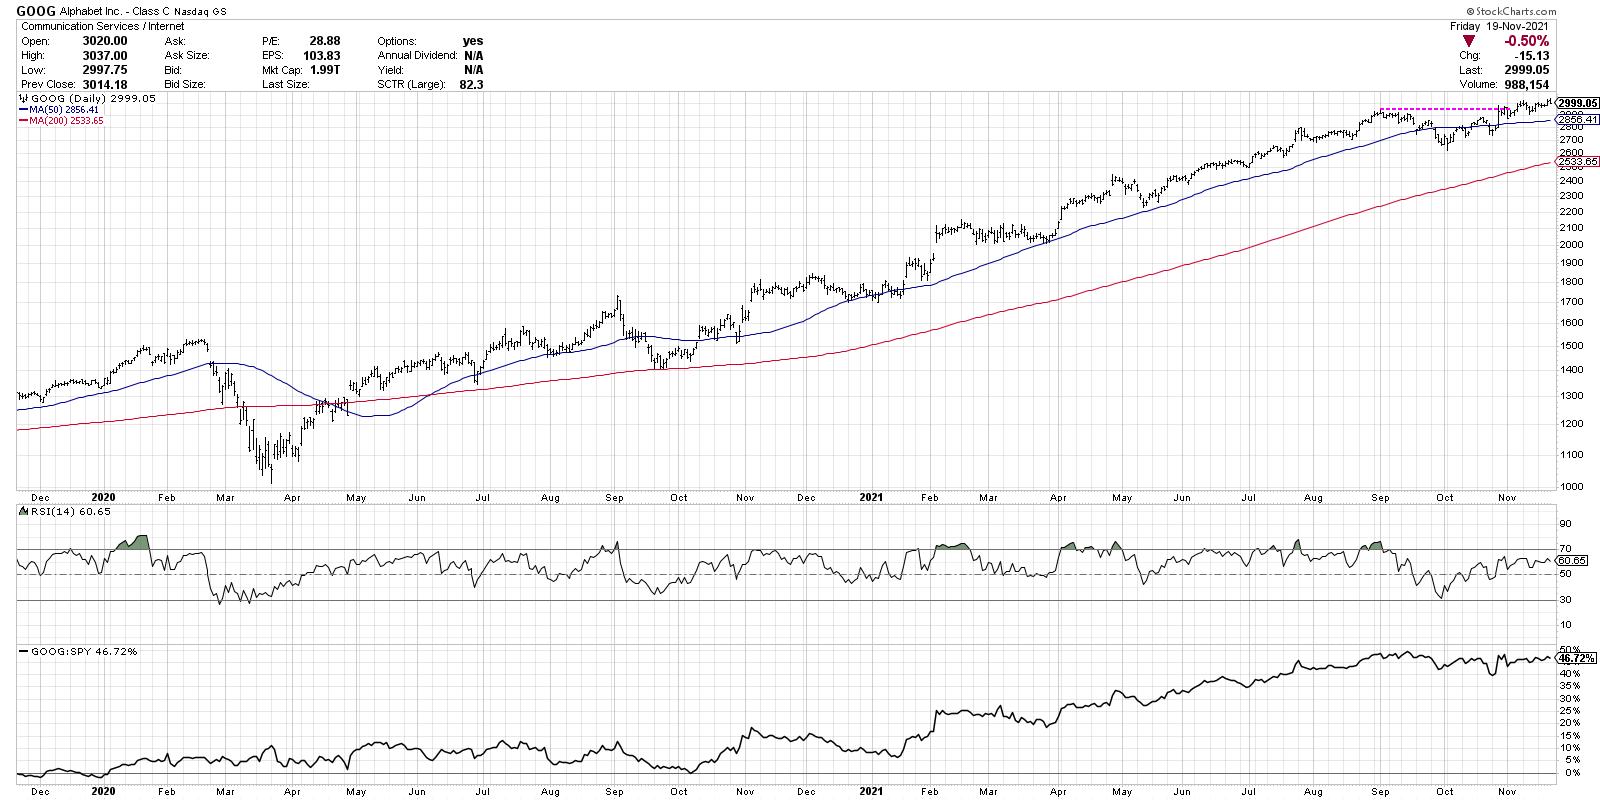
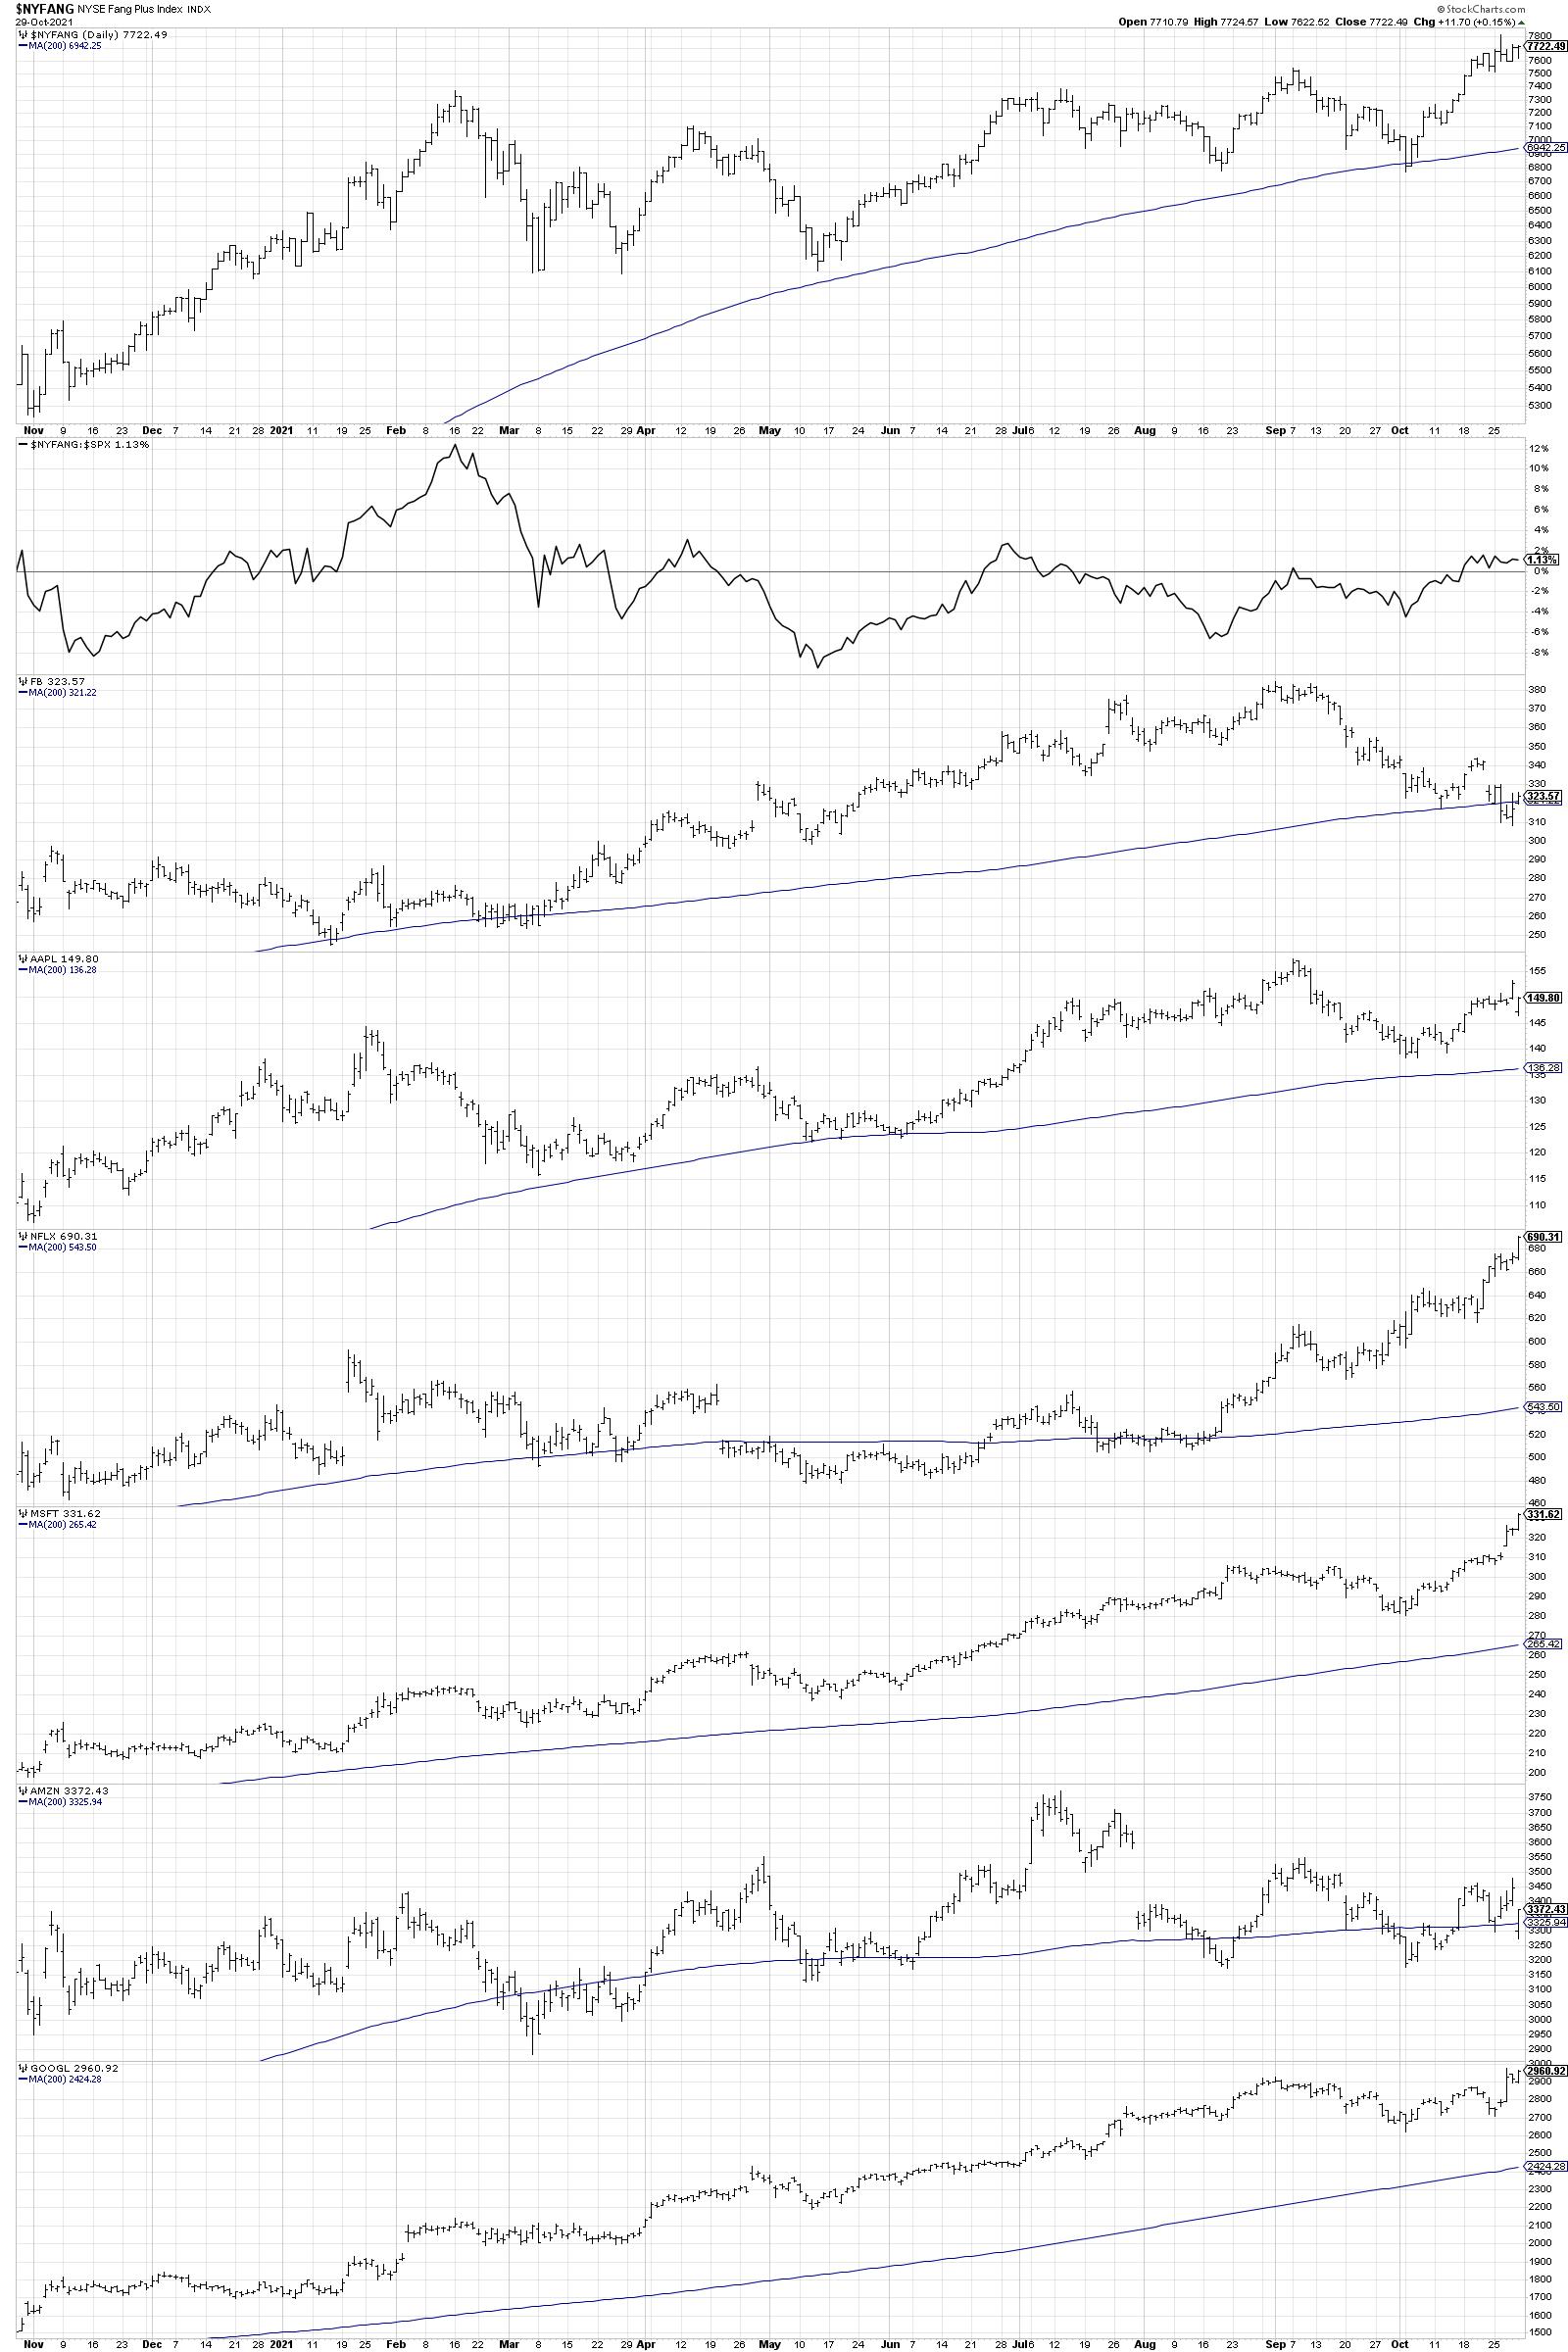
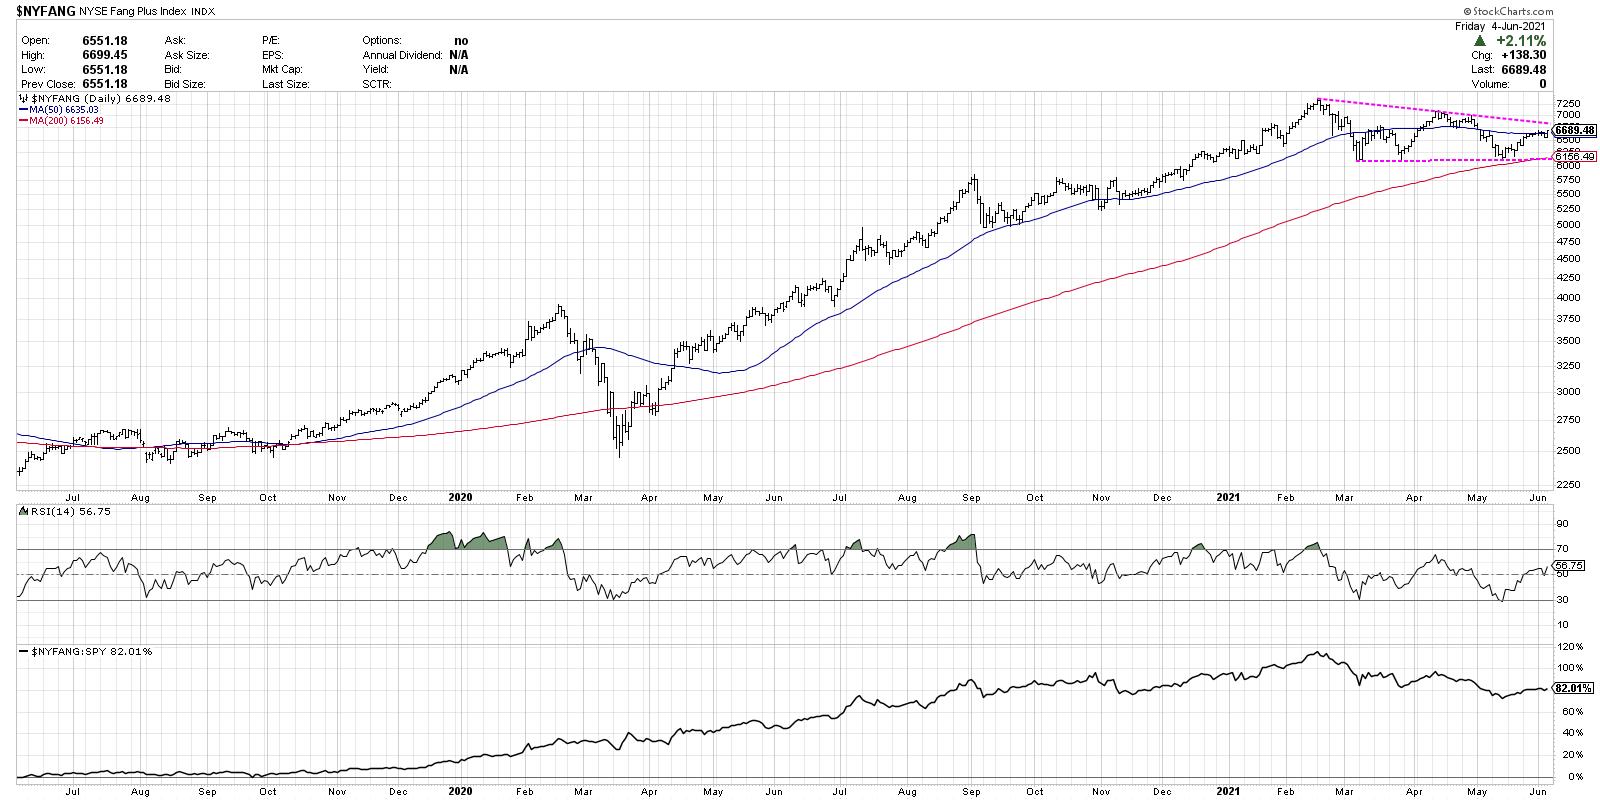
The Best FANMAG Stock Through Year End
by David Keller,
President and Chief Strategist, Sierra Alpha Research
Investors often think of the FAANG stocks as one basket of names. Either the mega cap tech and communication trade is working, or it isn't. But, as a review of the charts will reveal, these stocks can actually be differentiated using their price and relative profiles.
So which...
READ MORE
MEMBERS ONLY
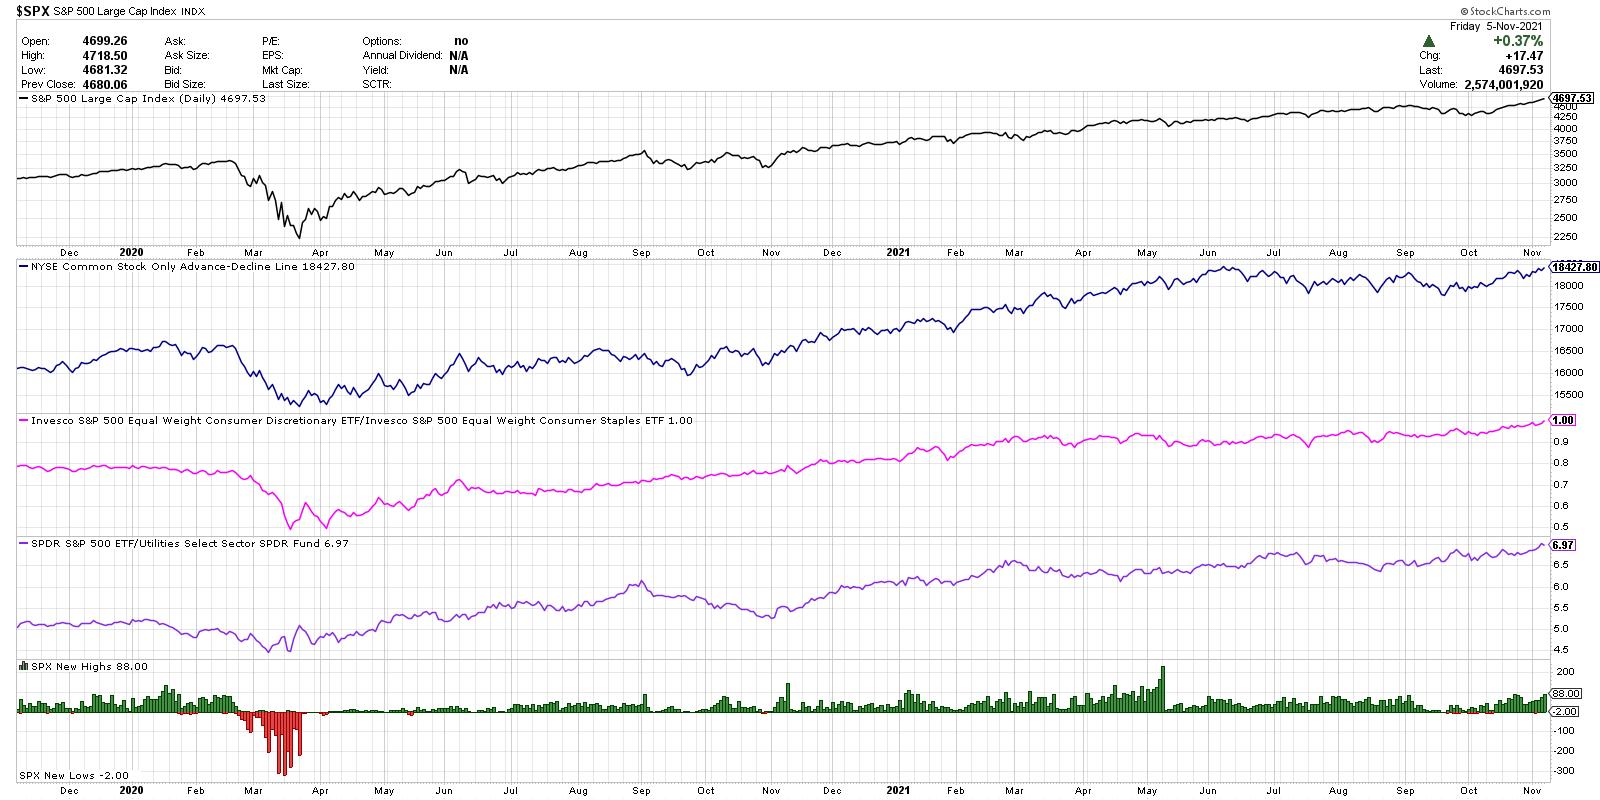
Why Breadth Matters as S&P Tests 4550
by David Keller,
President and Chief Strategist, Sierra Alpha Research
The worst crime that an analyst can commit is remaining bearish in the face of a rising market. -Richard Russell
The S&P 500 has now round tripped from its early September high around 4550 and the low around 4300 in early October. Will there be enough buying power...
READ MORE
MEMBERS ONLY
Three Charts to Watch Through Year-End
by David Keller,
President and Chief Strategist, Sierra Alpha Research
This has been a confusing market in so many ways. The S&P 500 moved higher for the first nine months of the year, but many stocks had a very different experience over that time frame. Leadership themes have rotated a number of times, with growth- and value-oriented sectors...
READ MORE
MEMBERS ONLY
Why Gold Remains Bearish
by David Keller,
President and Chief Strategist, Sierra Alpha Research
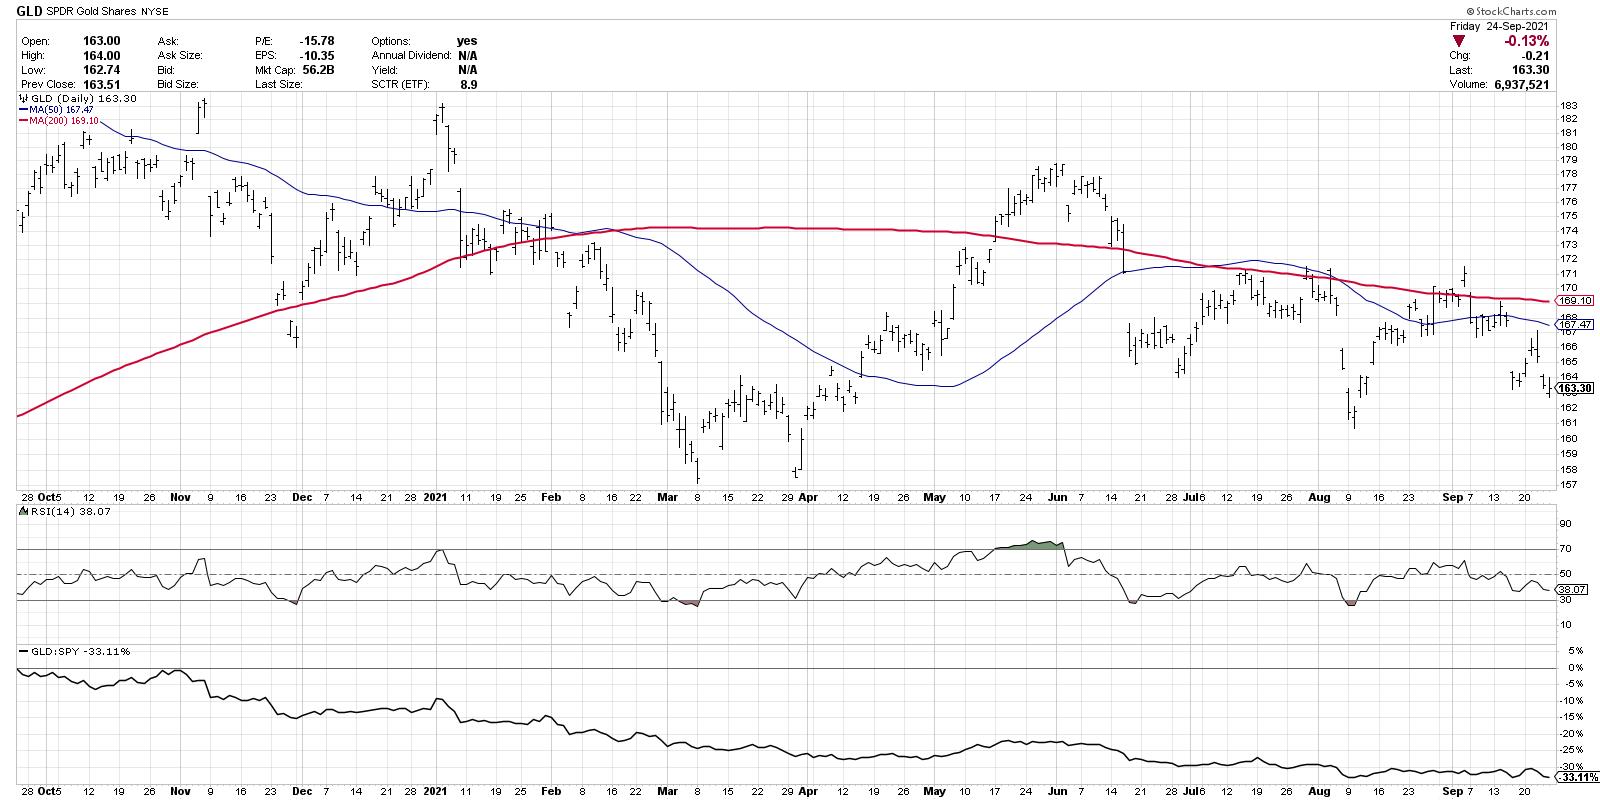
Gold has captivated human beings for millennia, infatuated with its appearance and it scarcity. Gold has also attracted investors for its value in hedging inflation and providing a stable store of wealth during periods of uncertainty.
While there are many narratives for gold related to transitory inflation, the Fed'...
READ MORE
MEMBERS ONLY
When In Doubt, Use a Checklist
by David Keller,
President and Chief Strategist, Sierra Alpha Research
I recently gave a webcast on how to avoid one of the sneakiest and most prolific of the behavioral biases: confirmation bias. Here's how it works. Instead of gathering evidence and then making a decision, you reverse the two. You actually make your decision first and then you...
READ MORE
MEMBERS ONLY
Four Signs the Bull Market is Over
by David Keller,
President and Chief Strategist, Sierra Alpha Research
"Technical analysis is a windsock, not a crystal ball." - Carl Swenlin
For me, technical analysis is not about trying to predict the future. So when I'm asked to give my S&P 500 target for year-end, I try not to giggle as I answer....
READ MORE
MEMBERS ONLY
Three Reasons I'm a Little Less Bearish
by David Keller,
President and Chief Strategist, Sierra Alpha Research
My medium-term Market Trend Modelturned bearish in May and has remained consistently bearish ever since. The market hasn't seemed to notice and has continued to make new all-time highs in every subsequent month.
So how do we reconcile these two conflicting signals, with a model turned negative and...
READ MORE
MEMBERS ONLY
Why Is Bitcoin 42,000 So Important?
by David Keller,
President and Chief Strategist, Sierra Alpha Research
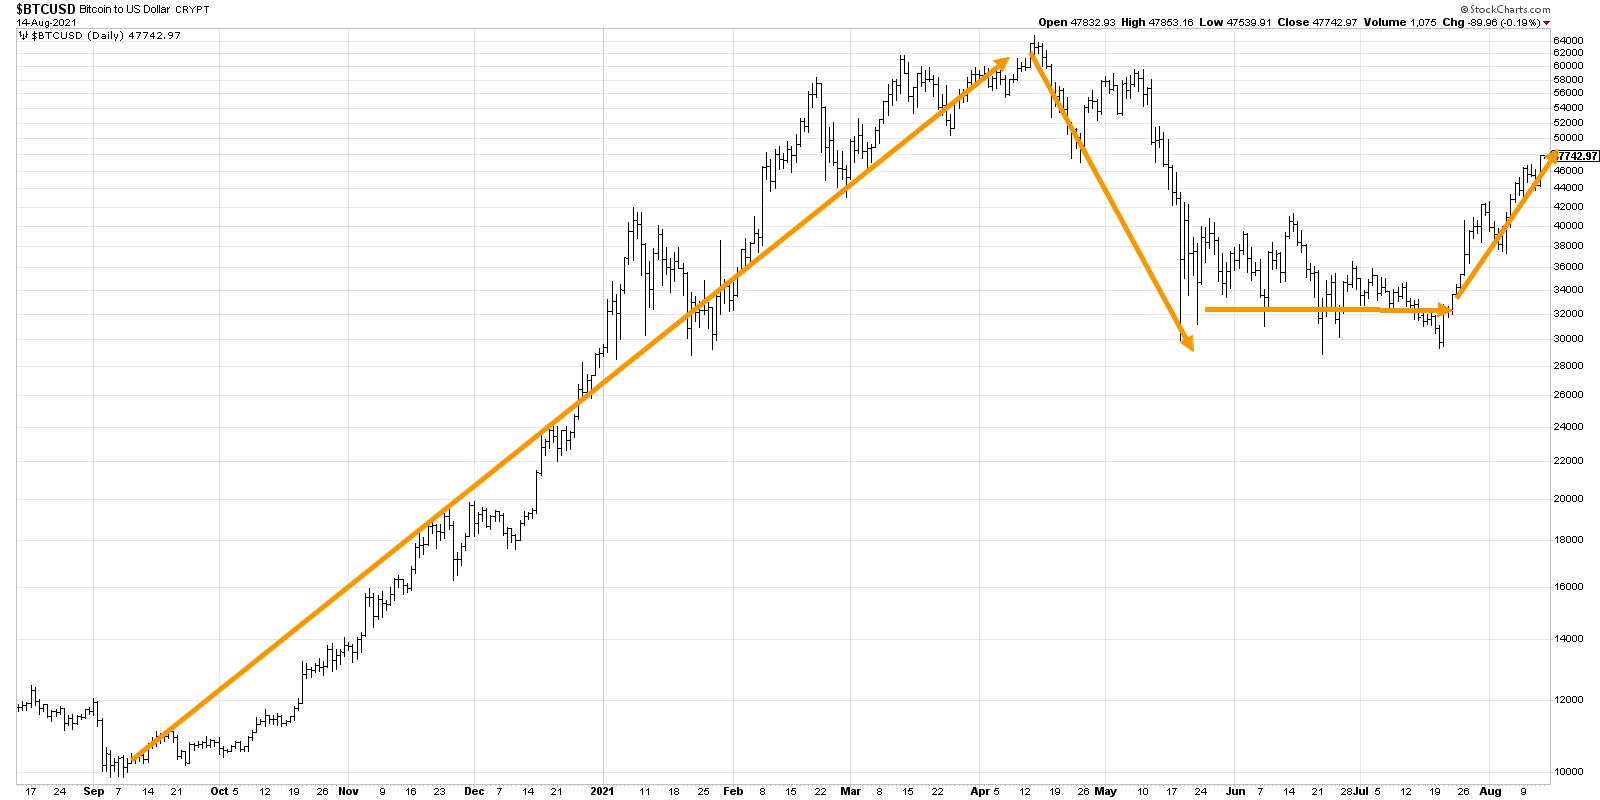
I recently recorded a "Choose Your Own Adventure" style approach to Bitcoin. I laid out four different scenarios for this crypto, from the uber-bullish move to 65,000 to the ultra-bearish scenario down to 24,000.
If you're interested, you can see the original video here...
READ MORE
MEMBERS ONLY
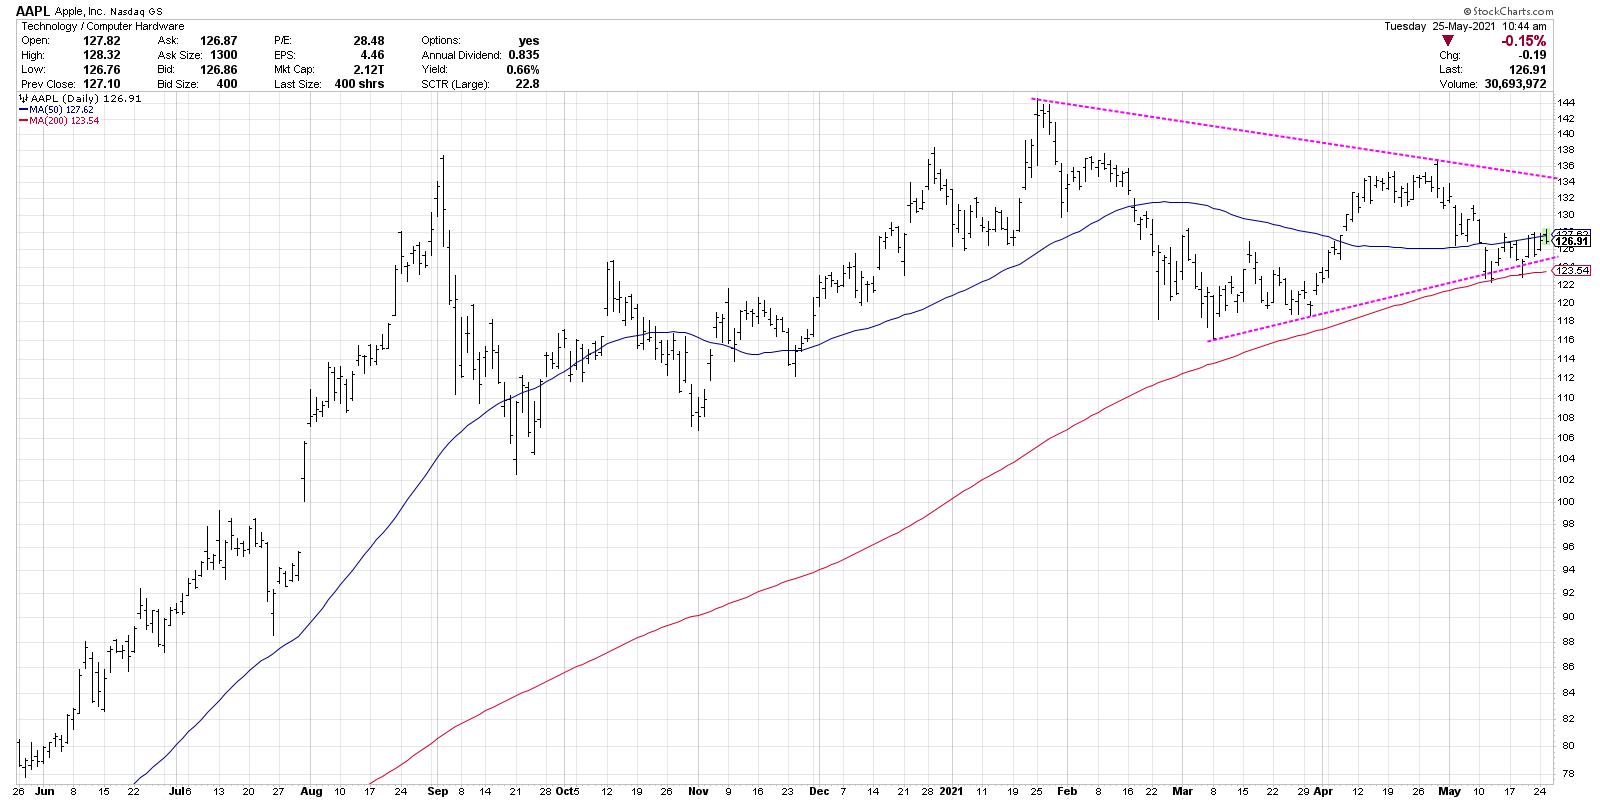
PayPal's Pullback May Be a Broader Signal
by David Keller,
President and Chief Strategist, Sierra Alpha Research
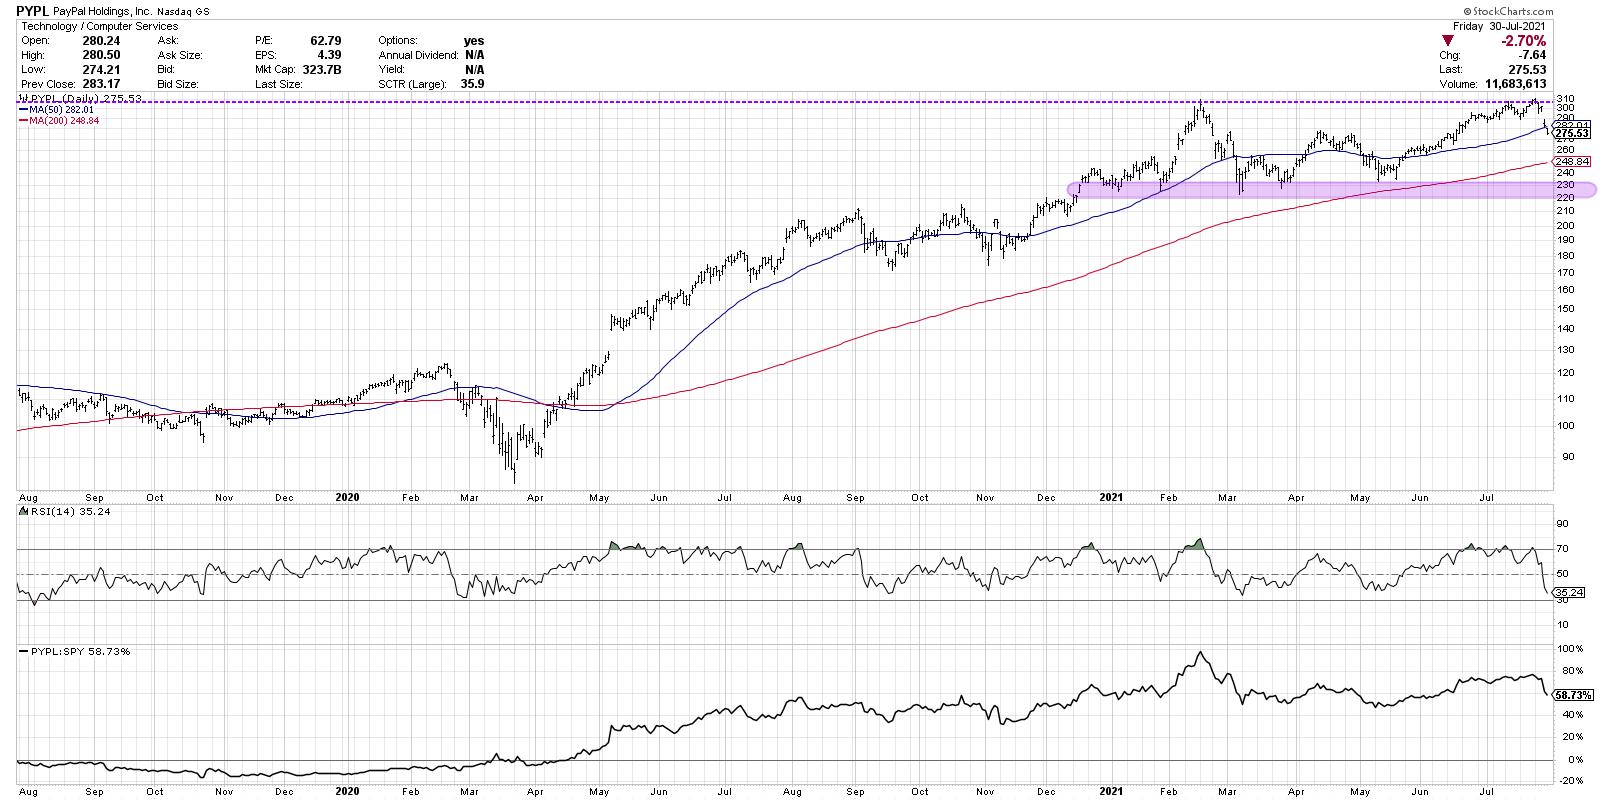
Markets in healthy uptrends, with improving bullish characteristics, see price breakouts follow through to further upside. Stocks like AAPL and AMZN and PYPL and others break above previous resistance levels and continue to push onward and ever upward.
Except that was not the upside follow through scenario that the markets...
READ MORE
MEMBERS ONLY
How the Impending Correction May Actually Play Out
by David Keller,
President and Chief Strategist, Sierra Alpha Research
As the S&P 500 and Nasdaq 100 indexes have pounded away at new all-time highs basically every month in 2021, investors are left to wonder when a correction may actually be coming. We were taught that markets don't just go straight up, but instead they move...
READ MORE
MEMBERS ONLY
What the Impending Correction May Look Like
by David Keller,
President and Chief Strategist, Sierra Alpha Research
As the S&P 500 and Nasdaq 100 indexes have pounded away at new all-time highs basically every month in 2021, investors are left to wonder when a correction may actually be coming. We were taught that markets don't just go straight up, but instead they move...
READ MORE
MEMBERS ONLY
A Market with Bad Breadth is Still Going Up
by David Keller,
President and Chief Strategist, Sierra Alpha Research
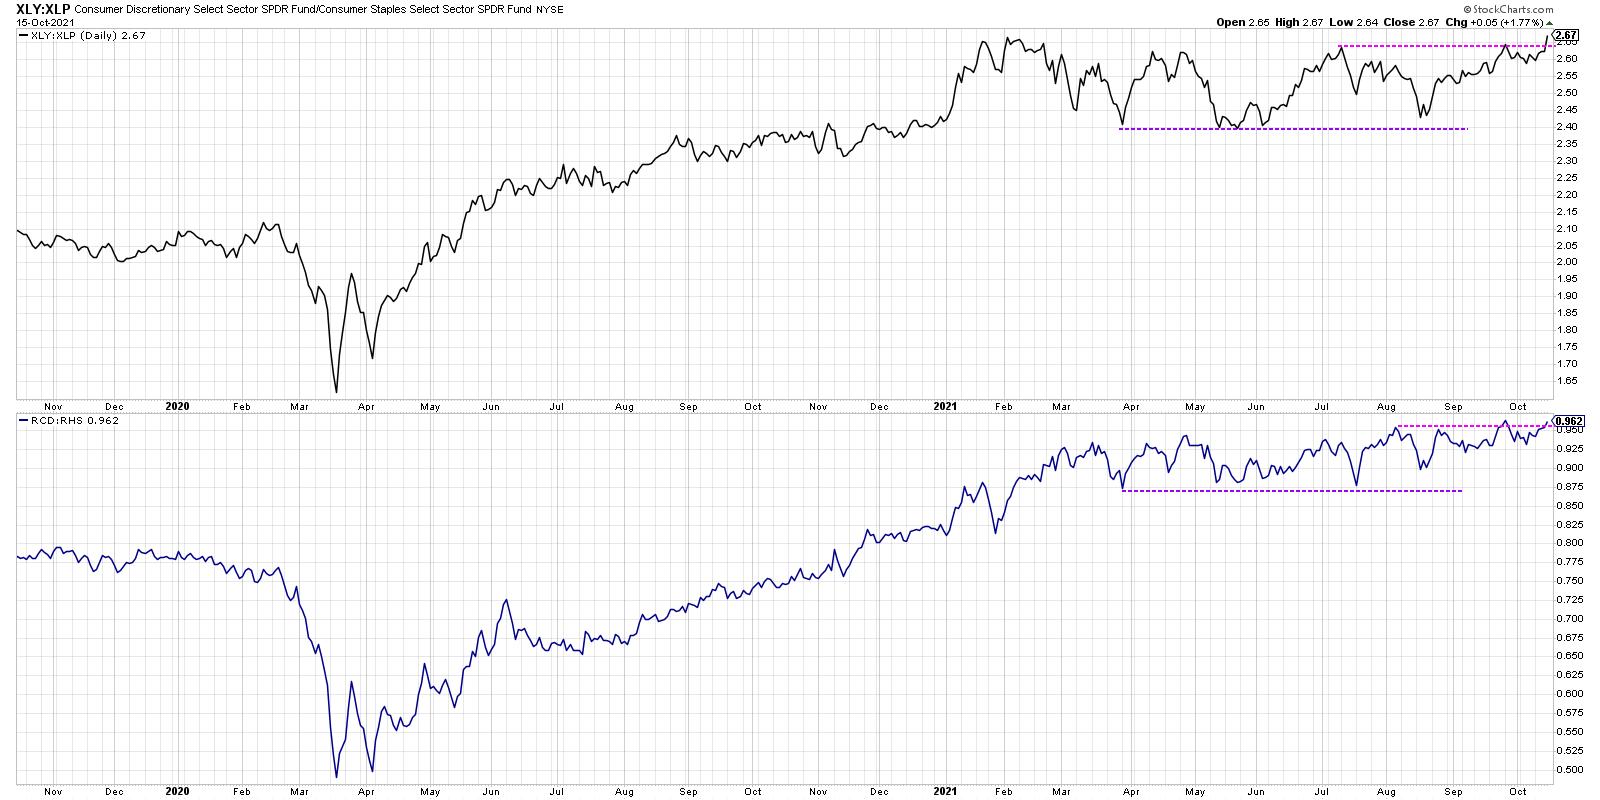
The S&P 500 is going higher. If you knew nothing else about the current market environment, you would consider that to be a bullish indication. As Paul Montgomery once said, "The most bullish thing the market can do is go up."
But if you look underneath...
READ MORE
MEMBERS ONLY
Four Lessons From Four Charts in My Office
by David Keller,
President and Chief Strategist, Sierra Alpha Research
I have four paper charts hanging in my office. I use these as the background for most of my videos, and you can usually see one in the background when we shoot The Final Barevery afternoon.
I was recently asked why these four charts were worthy of display -- and...
READ MORE
MEMBERS ONLY
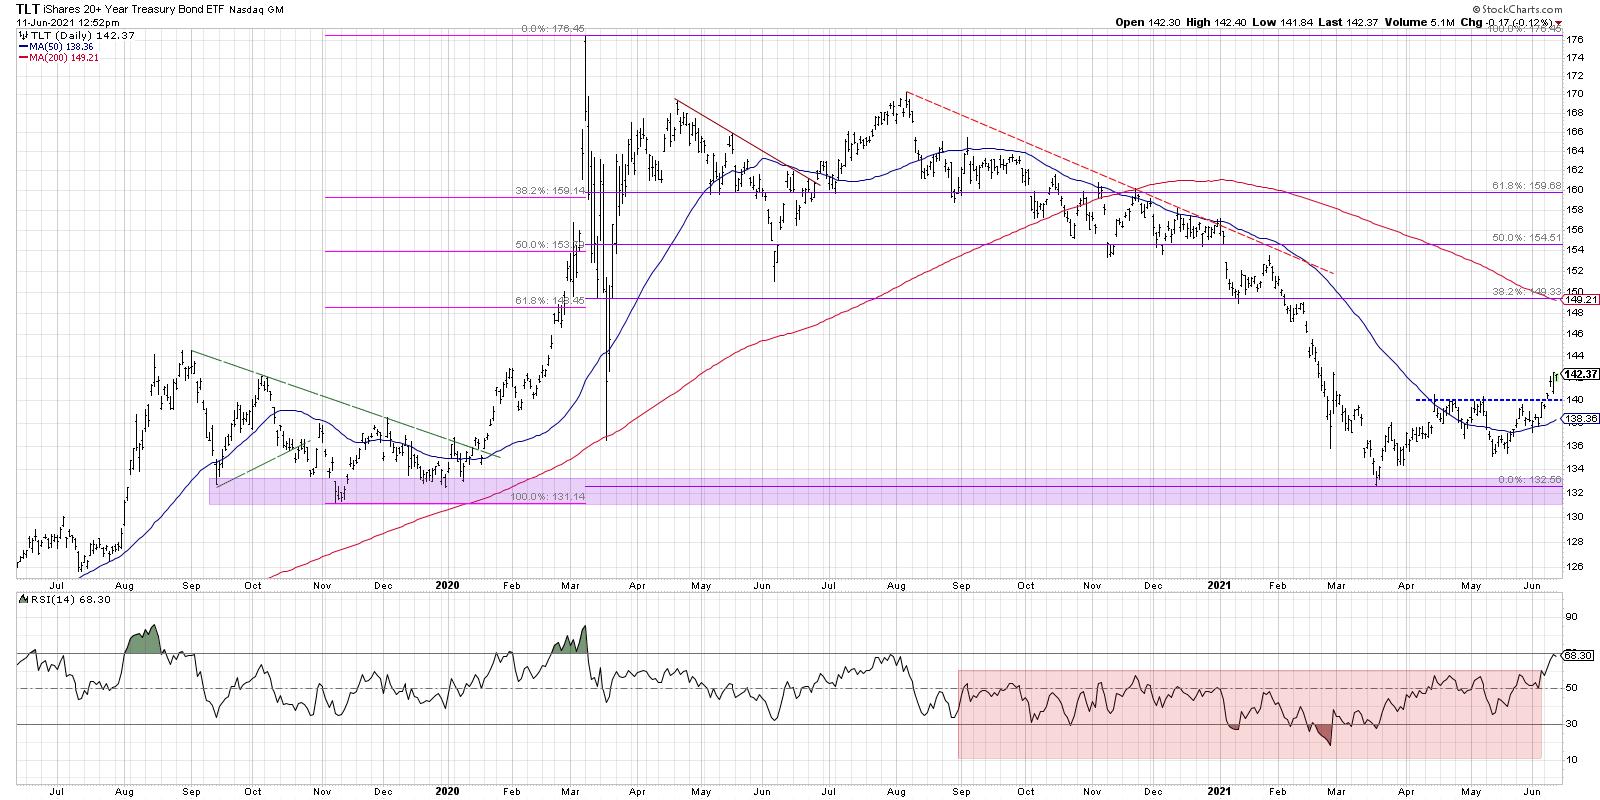
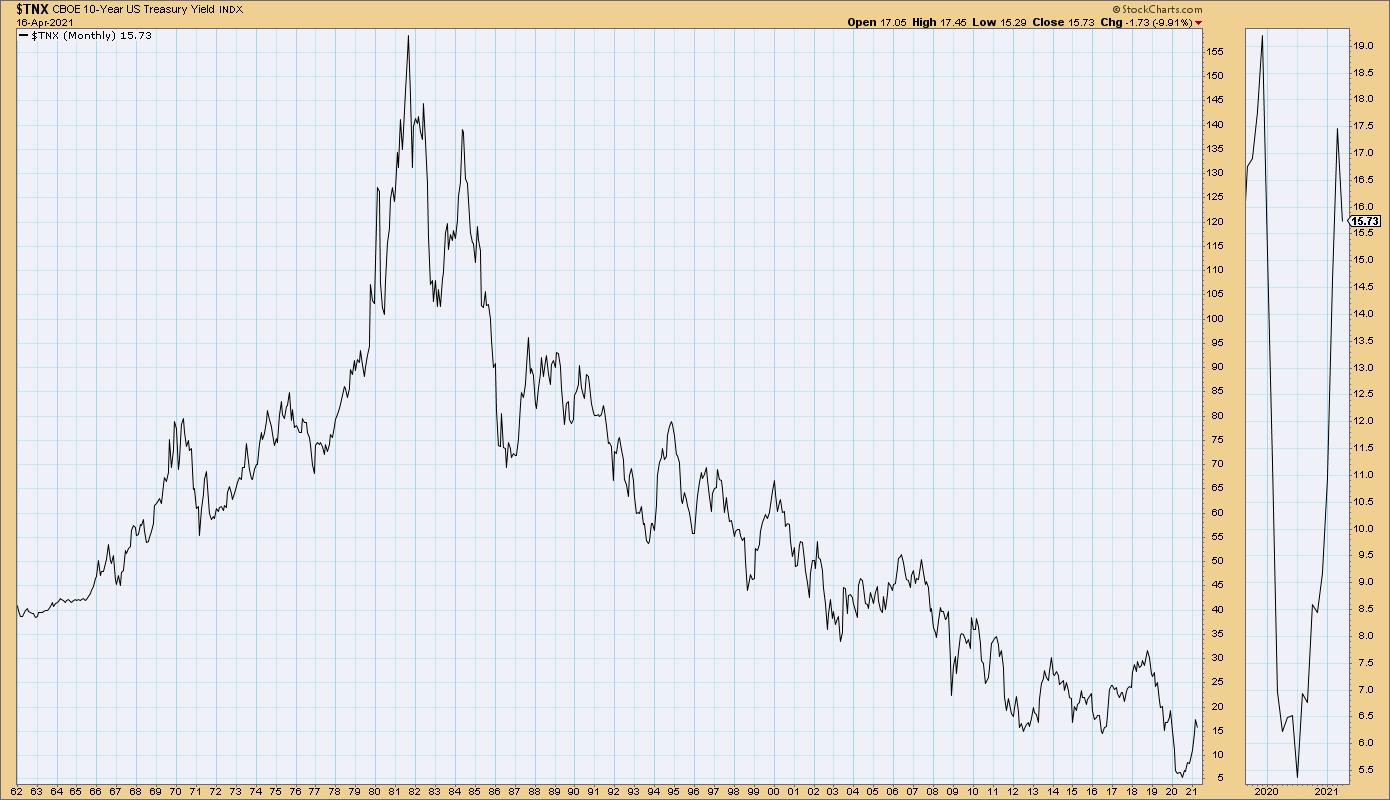
Three Key Charts for Falling Rates
by David Keller,
President and Chief Strategist, Sierra Alpha Research
In terms of key developments this week, I would argue that the ten-year Treasury yield breaking below 1.5% was perhaps the most significant. On The Final Bar this week, we've talked about the $140 level on the long bond ETF ($TLT) and how this rotation higher in...
READ MORE
MEMBERS ONLY
Introducing the FAME Stocks
by David Keller,
President and Chief Strategist, Sierra Alpha Research
In John Murphy's classic text Technical Analysis of the Financial Markets, he explains that one of the three basic assumptions of technical analysis is that prices move in trends.For anyone that has looked at charts for any amount of time, this seems like an obvious truism. The...
READ MORE
MEMBERS ONLY
Three Key Lines for Three Key Charts
by David Keller,
President and Chief Strategist, Sierra Alpha Research
As I go through my normal routine of analyzing hundreds of charts every day, or when I'm preparing for my daily closing bell show, I often focus on the "line in the sand" for each chart. That is, what's the point at which you...
READ MORE
MEMBERS ONLY
Dead Cat Bounce on S&P 500?
by David Keller,
President and Chief Strategist, Sierra Alpha Research
When a market makes a quick move lower from an established peak, then quickly rebounds back to the upside, you will hear the dreaded phrase "dead cat bounce" emerge on trading floors. What is this pattern, and what can it tell us about next steps for the S&...
READ MORE
MEMBERS ONLY
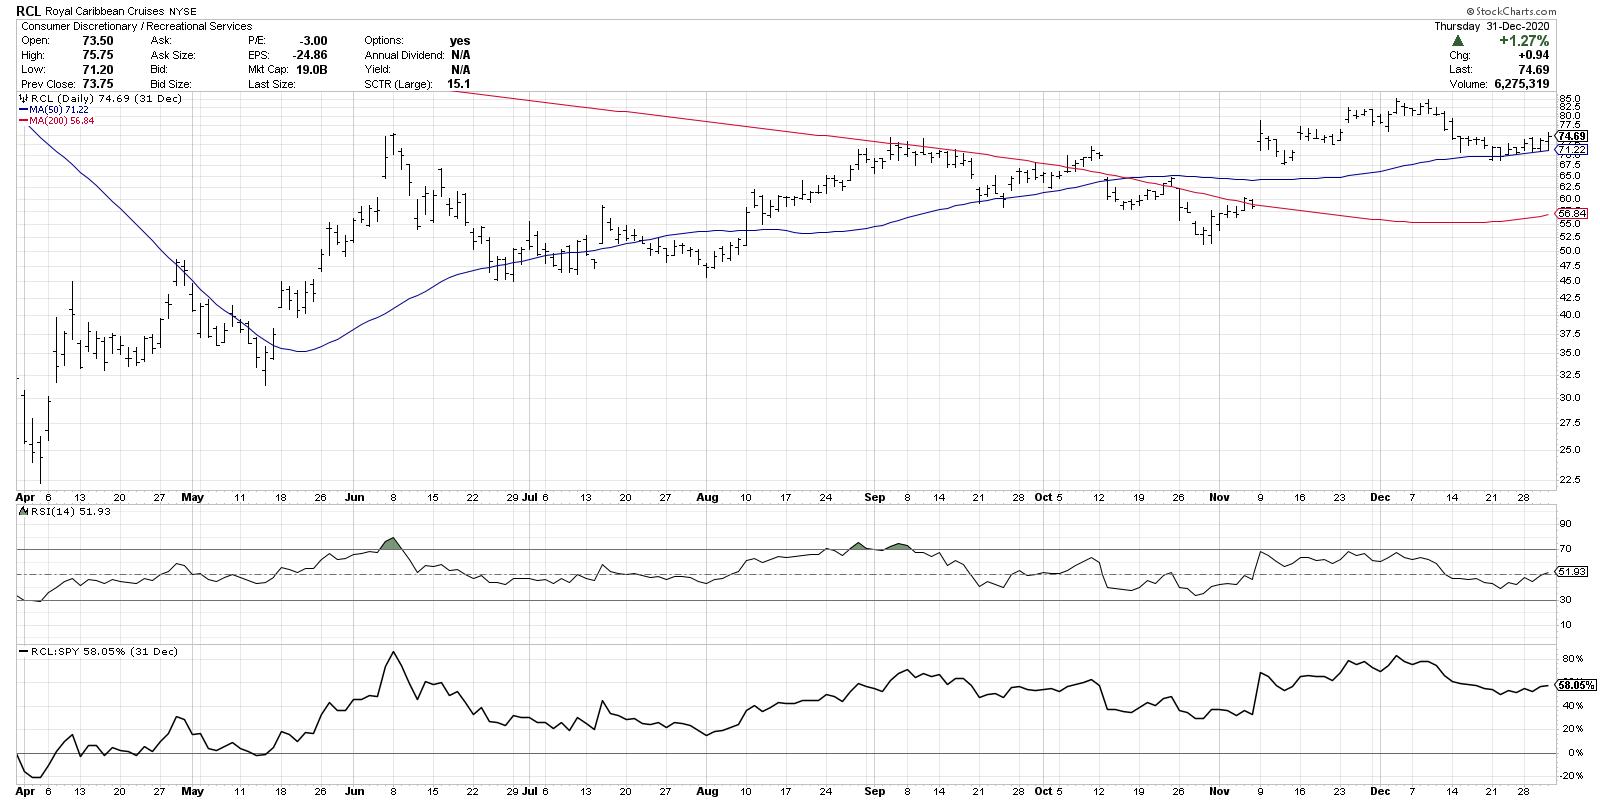
Bullish Breakouts for Financials
by David Keller,
President and Chief Strategist, Sierra Alpha Research
Last month, we recognized a bearish divergence on the chart of the 10-year Treasury Yield ($TNX). Soon after, bond prices rallied, pushing interest rates down to an ascending 50-day moving average. Now that this pullback has completed, we're seeing signs of rising rates, which has ripple effects for...
READ MORE
MEMBERS ONLY
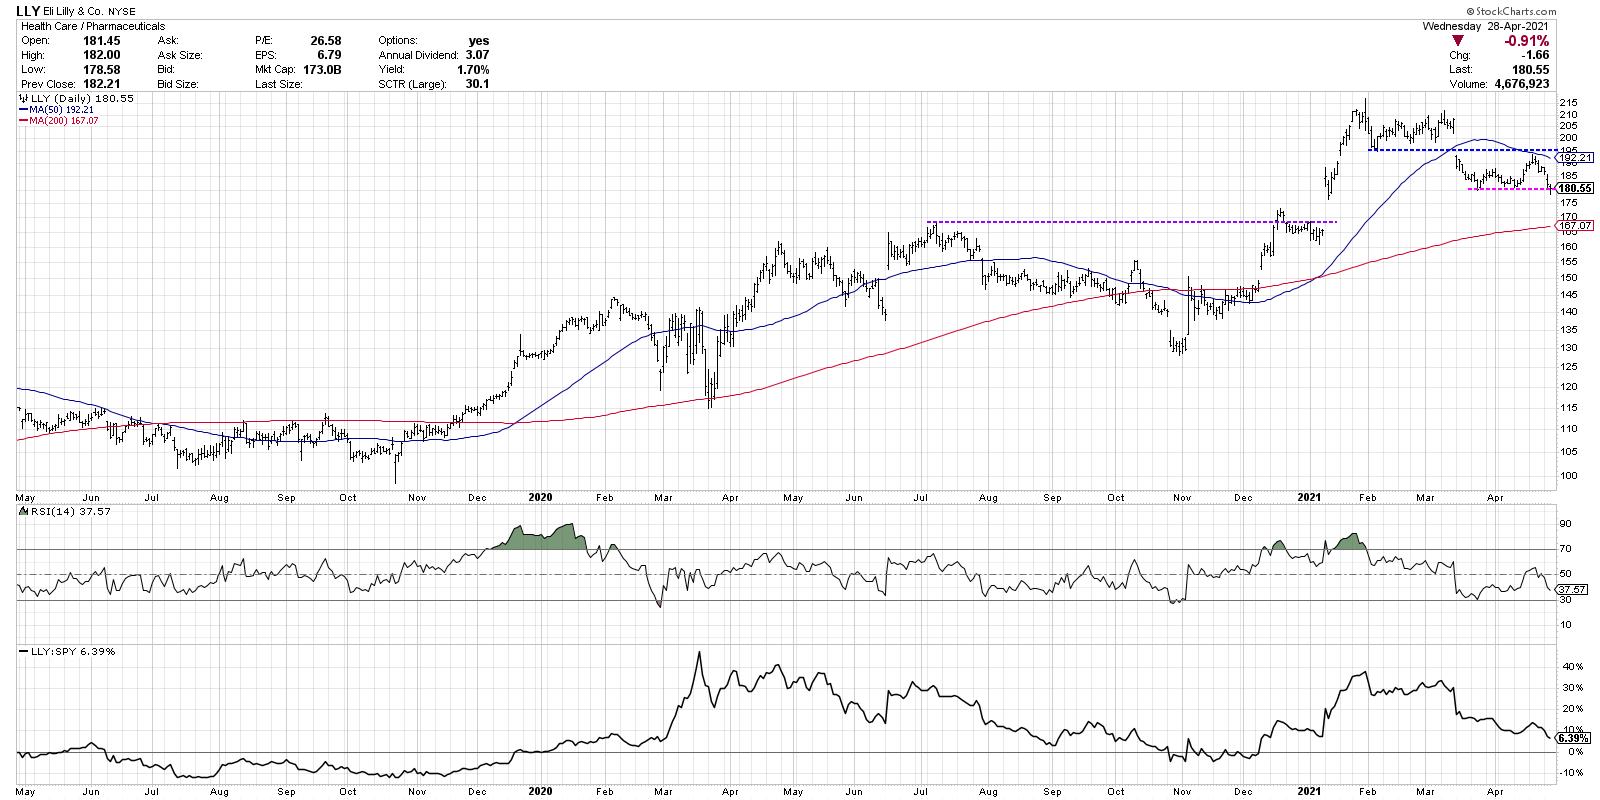
Eli Lilly: Perfect Example of Price Distribution
by David Keller,
President and Chief Strategist, Sierra Alpha Research
I look at hundreds of charts every single day. Every once in a while, I come upon a chart that I feel should be in future textbooks on technical analysis. One chart that seems to provide a perfect example of best practices in price analysis and investor behavior.
This week&...
READ MORE
MEMBERS ONLY
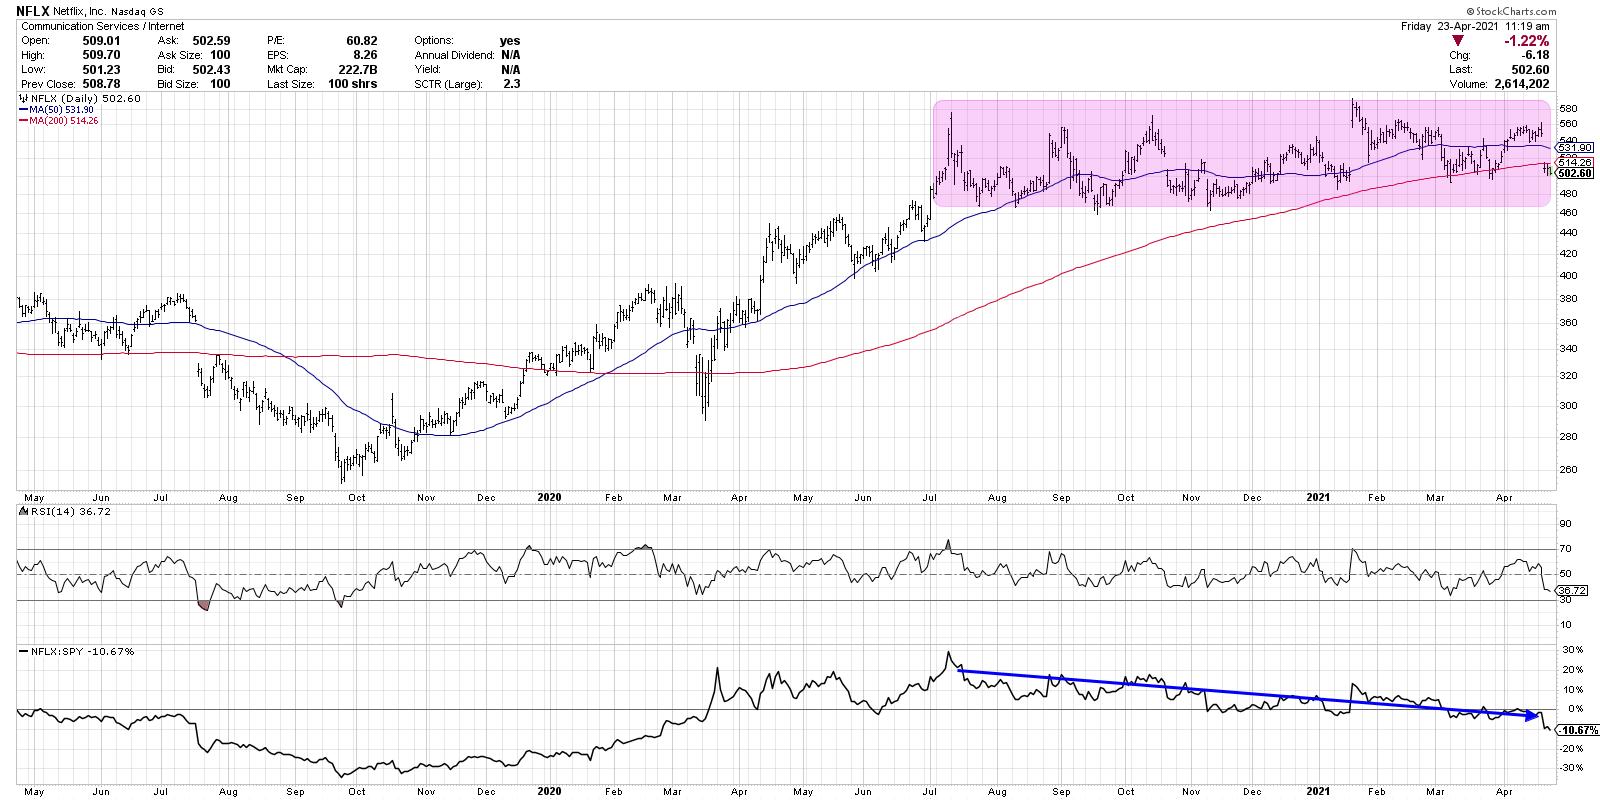
The Streaming Wars: T vs. NFLX
by David Keller,
President and Chief Strategist, Sierra Alpha Research
It's been a heavy earnings week, with many stocks gapping higher or lower based on investors' reactions to their quarterly results. With two particular stocks, AT&T (T) and Netflix (NFLX), this week was less about their ability to grow earnings and more about their potential...
READ MORE
MEMBERS ONLY
The Impact of Falling Interest Rates
by David Keller,
President and Chief Strategist, Sierra Alpha Research
Over the last six weeks, we've seen a dramatic reversal from a rising rate environment to a falling rate environment. While this rotation makes perfect sense from a technical perspective, the fact that the ten-year yield has come down in the face of strong economic data this week...
READ MORE
MEMBERS ONLY
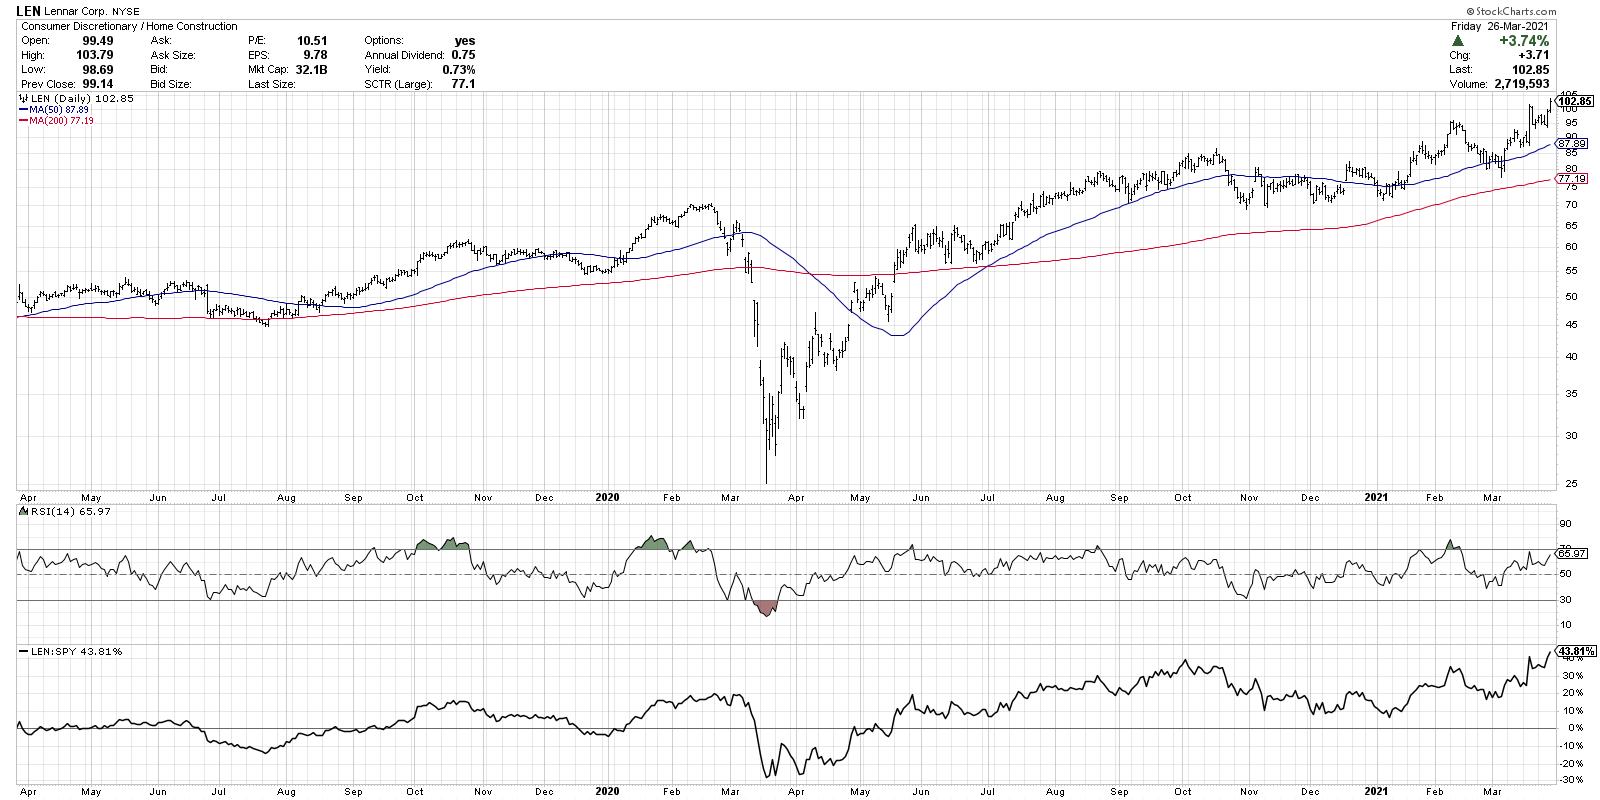
Improving Relative Strength for Homebuilders
by David Keller,
President and Chief Strategist, Sierra Alpha Research
Relative strength is one of the most important parts of my technical toolkit. Basically, the idea is to lean into stocks that are working and lean away from stocks that are not working. If that sounds easy, simple and straightforward, that's because it is!
This week, I noticed...
READ MORE
MEMBERS ONLY
The Chart You Need to Stay Bullish
by David Keller,
President and Chief Strategist, Sierra Alpha Research
I have learned over my career to be skeptical. I have learned to question my investment thesis and actively argue the other side of any position to challenge my own analysis. I have learned to actively search out people that disagree with me and try to see what they are...
READ MORE
MEMBERS ONLY
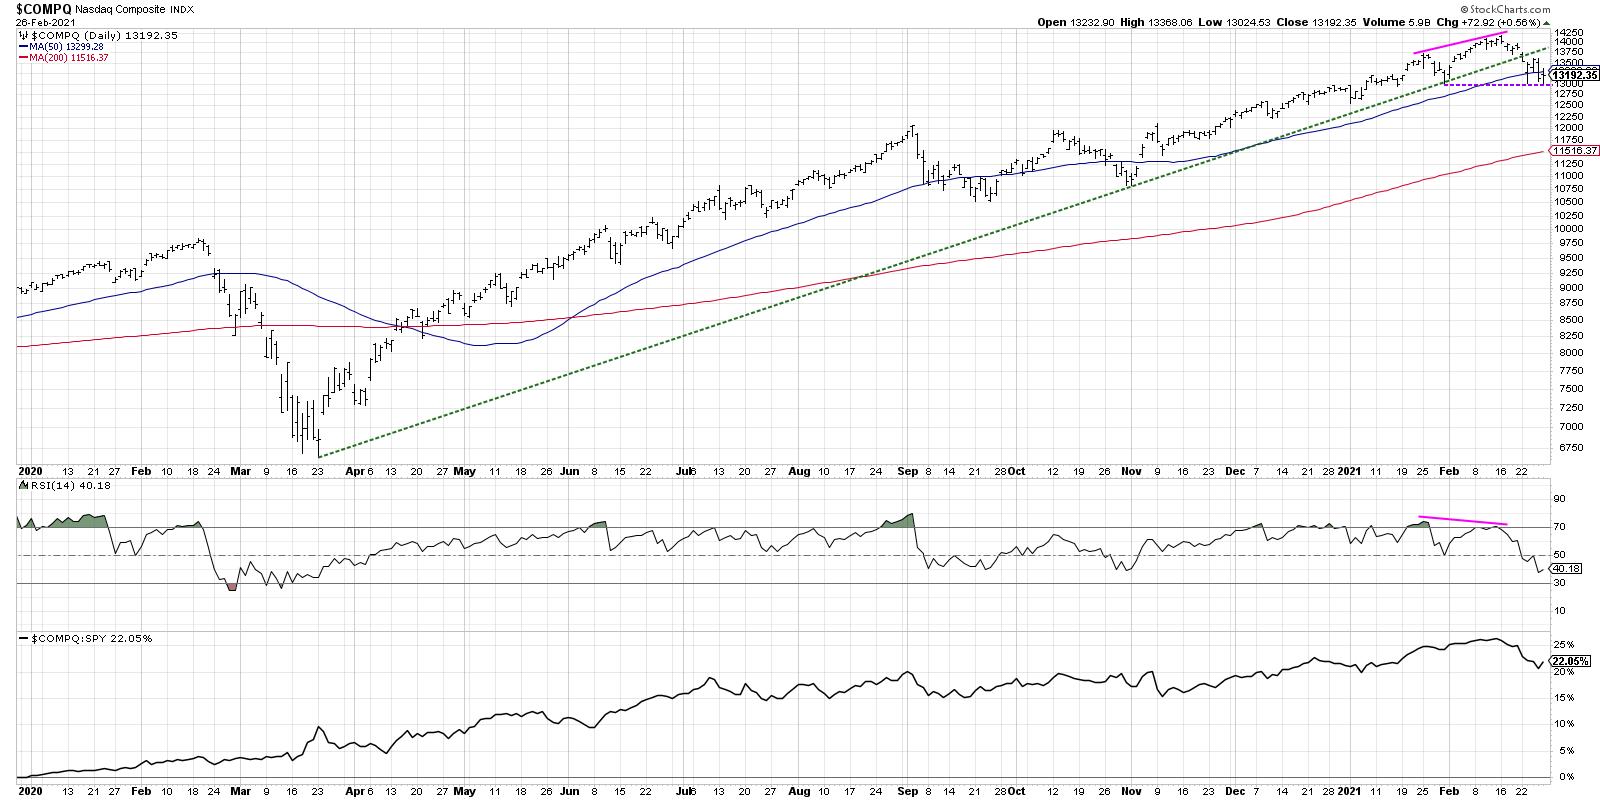
Nasdaq Rotates Toward Bearish Phase
by David Keller,
President and Chief Strategist, Sierra Alpha Research
I recently tweeted the three steps for the S&P to signal a rotation from bullish phase to bearish phase, especially on the tactical time frame. After taking some time to digest this week's distribution, I wanted to update that thesis with a four step "bull...
READ MORE
MEMBERS ONLY
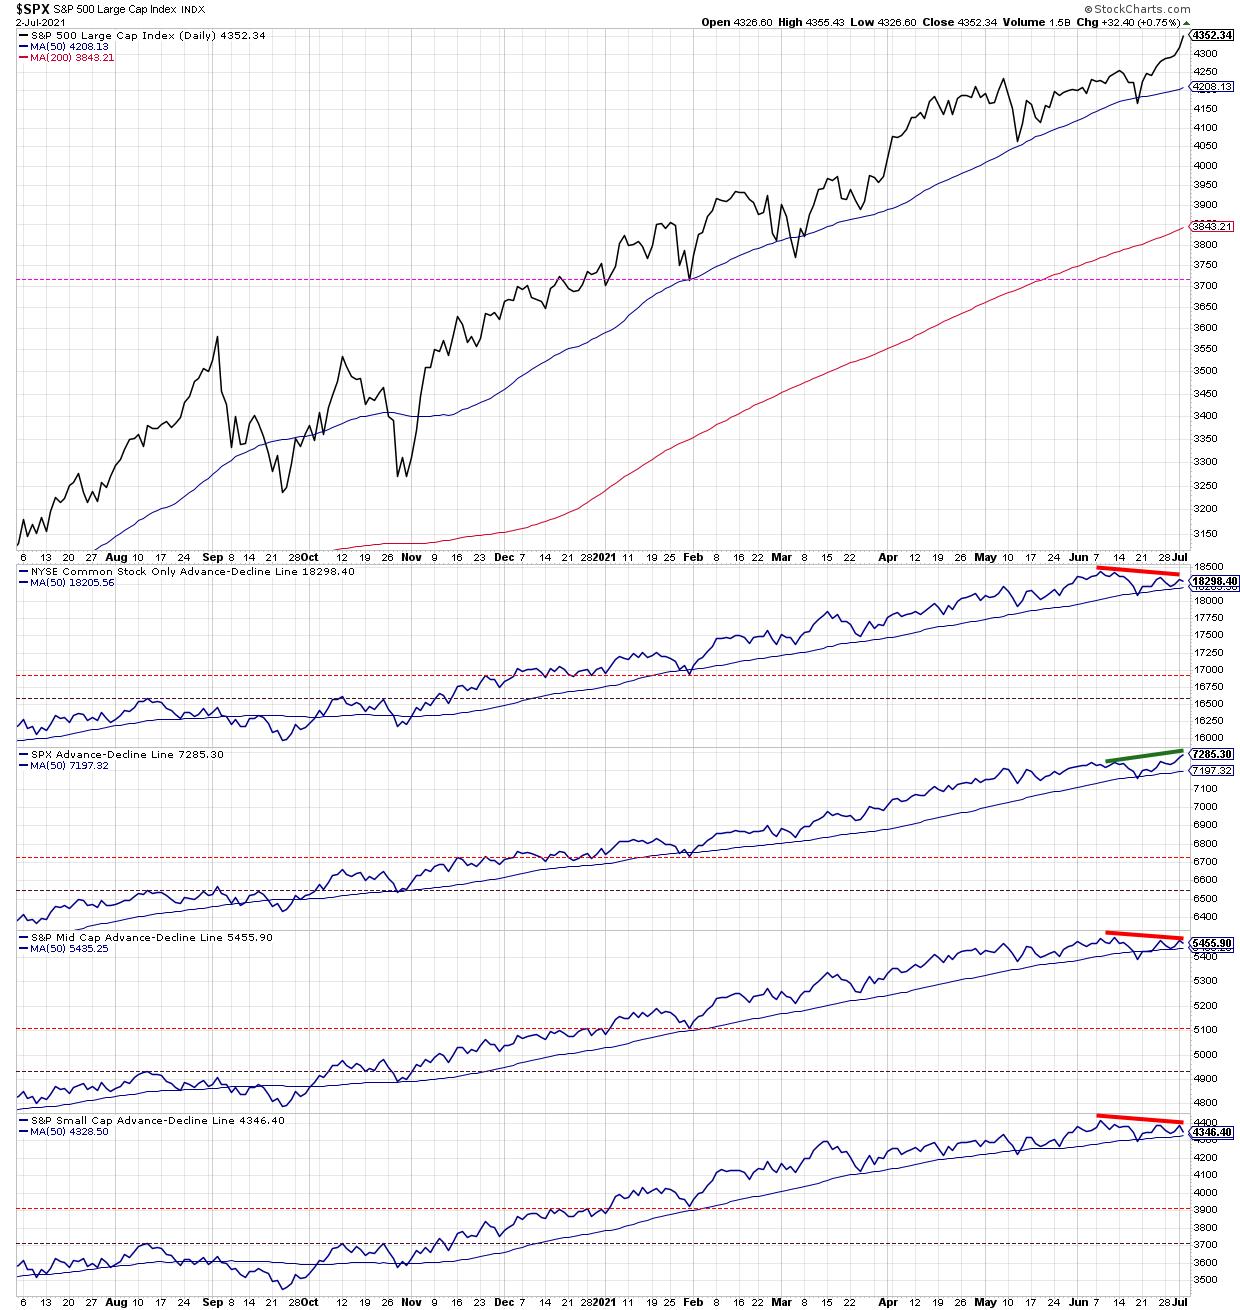
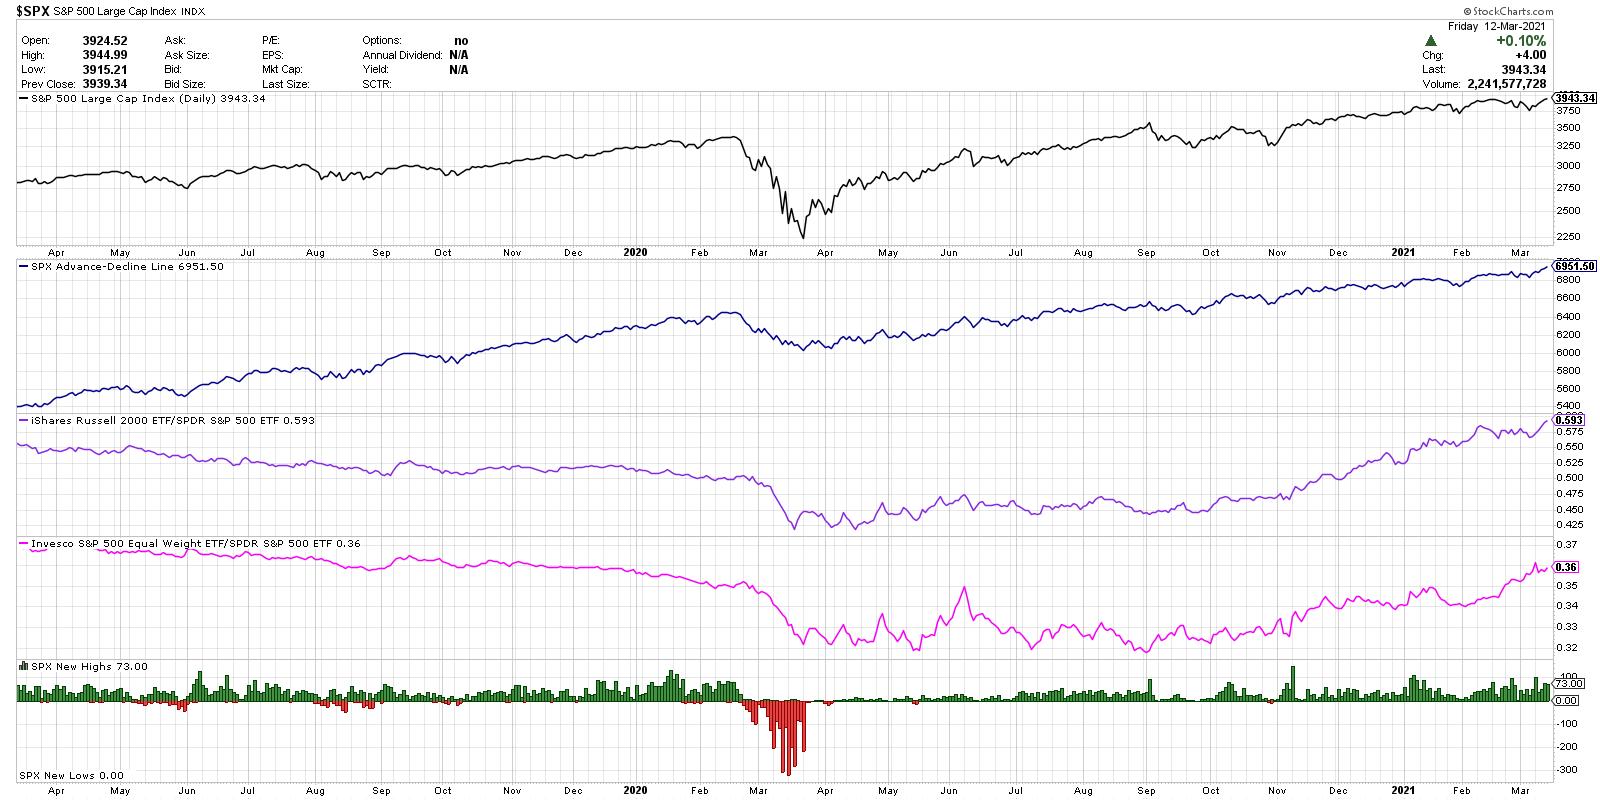
Advance-Decline Lines Suggest Further Downside
by David Keller,
President and Chief Strategist, Sierra Alpha Research
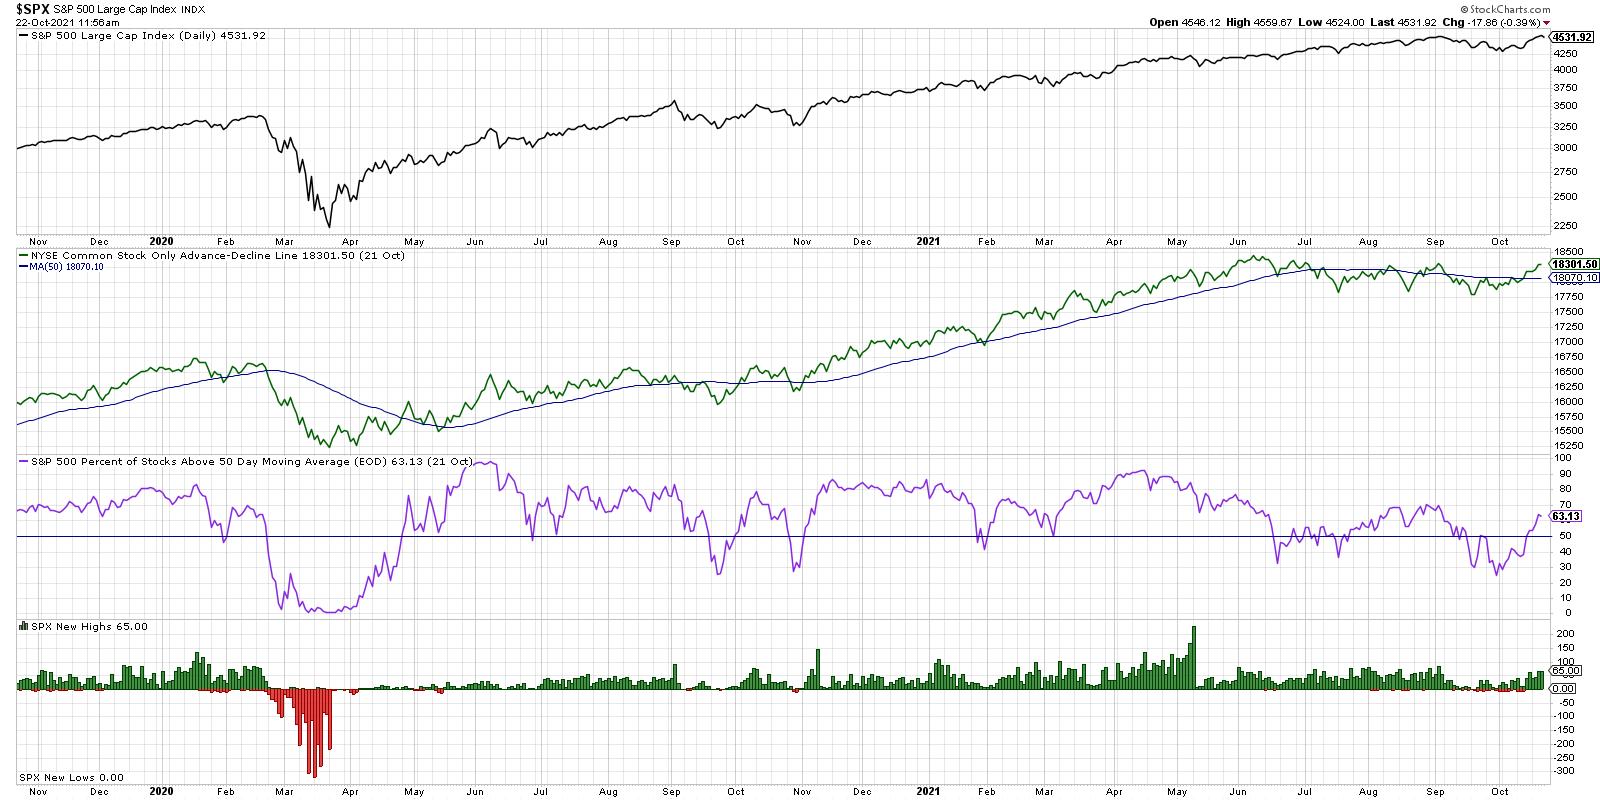
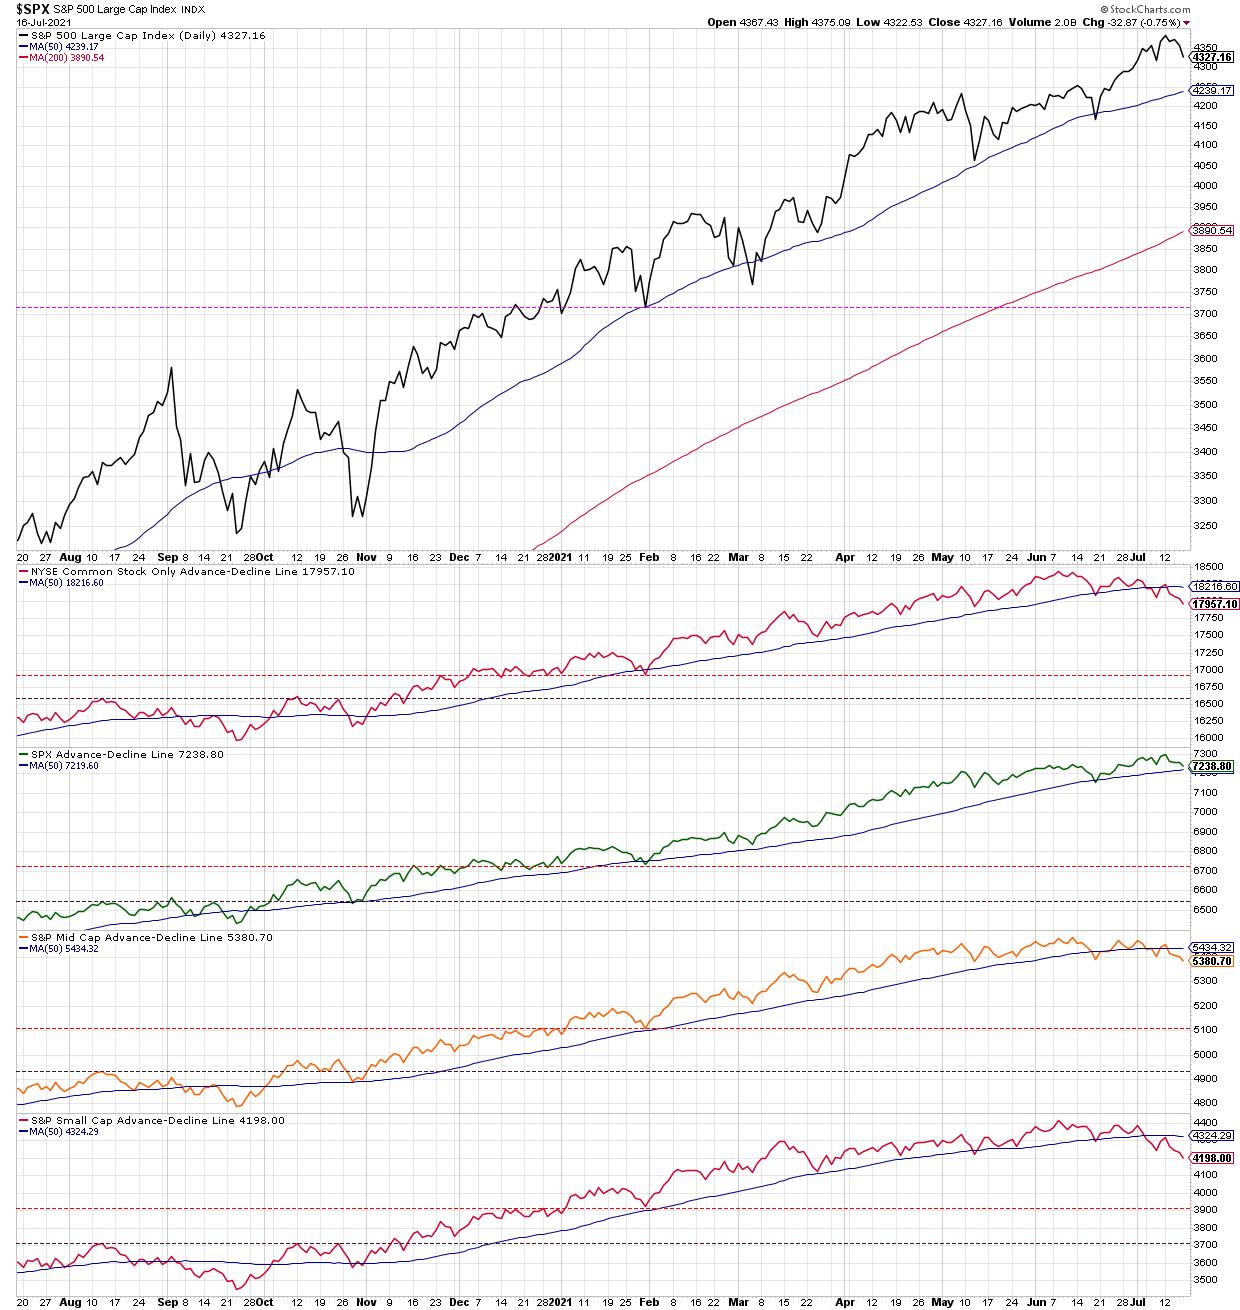
I've spoken recently of the bearish divergences emerging from breadth indicators, including the anemic new 52-week highs list, as well as a breakdown in the percent of stocks trading above their 50-day moving averages.
As we recorded Friday's episode of The Final Bar, it appeared that...
READ MORE
MEMBERS ONLY
Advance Decline Lines Flash Warning
by David Keller,
President and Chief Strategist, Sierra Alpha Research
I've spoken recently of the bearish divergences emerging from breadth indicators,including the anemic new 52-week highs list, as well as a breakdown in the percent of stocks trading above their 50-day moving averages.
As we recorded Friday's episode of The Final Bar, it appeared that...
READ MORE
MEMBERS ONLY
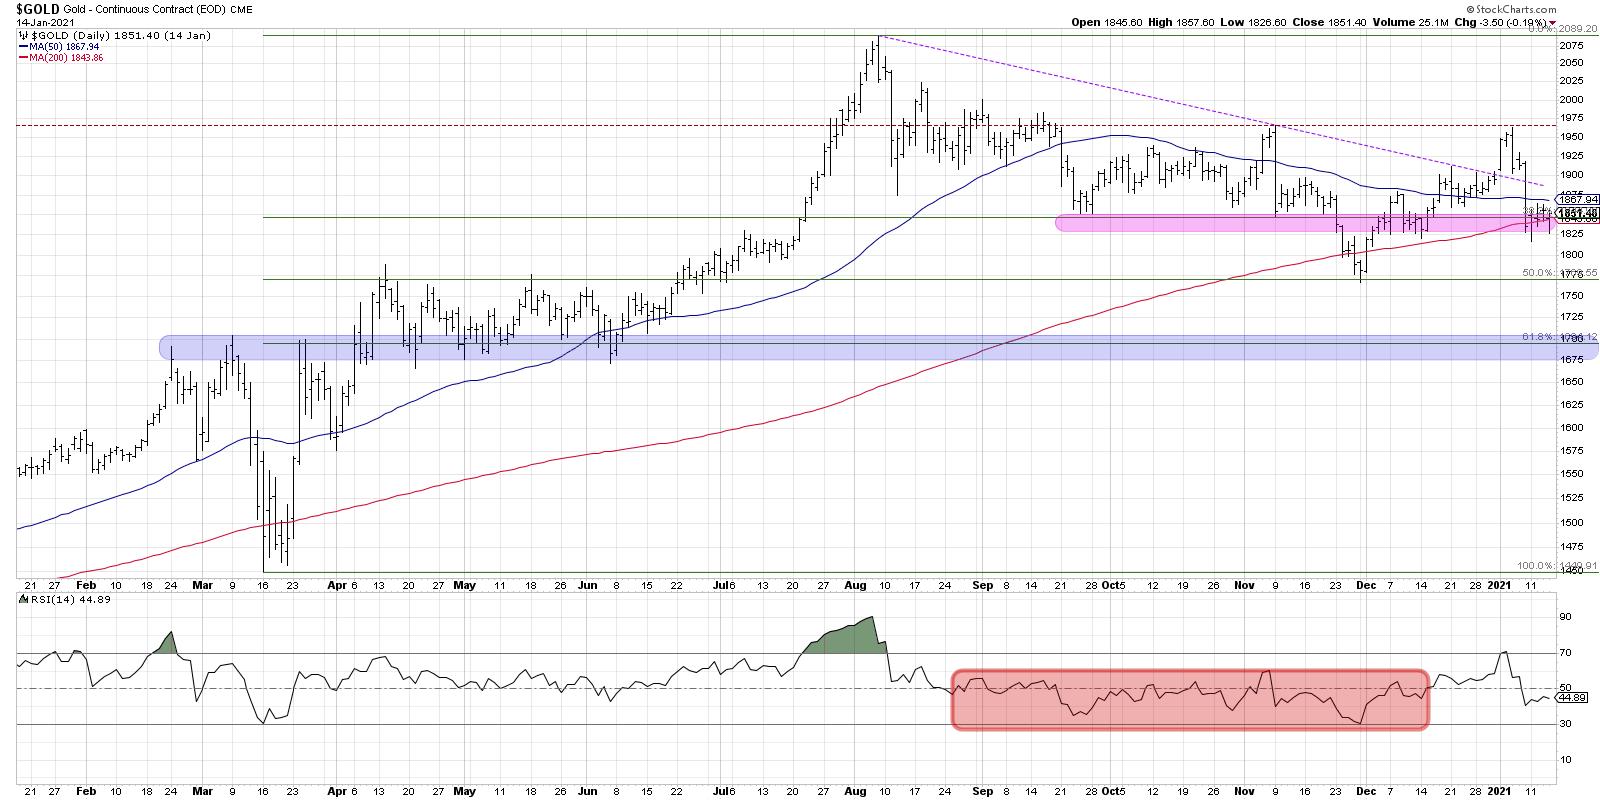
Further Downside for Gold?
by David Keller,
President and Chief Strategist, Sierra Alpha Research
Back in early December, we discussed the three signals we would need to see to turn bullish on gold and gold stocks. Although the picture for gold turned more positive that month, a failure at resistance and a return below the 200-day moving average suggest further weakness may be in...
READ MORE
MEMBERS ONLY
Gold Hints at Further Downside
by David Keller,
President and Chief Strategist, Sierra Alpha Research
Back in early December, we discussed the three signals we would need to see to turn bullish on gold and gold stocks. Although the picture for gold turned more positive that month, a failure at resistance and a return below the 200-day moving average suggest further weakness may be in...
READ MORE
MEMBERS ONLY
Will 2021 Be Another 2010?
by David Keller,
President and Chief Strategist, Sierra Alpha Research
The end of the year tends to provide the perfect opportunity to reflect, renew and refocus. Hopefully, you've taken advantage of the Reflections 2020 specials on StockCharts TV, including my session on the Ten Questions You Should Ask Yourself at Year End!
I was asked recently by my...
READ MORE