MEMBERS ONLY
Breakouts, Pullbacks & Setups: 10 Must-Watch Charts for November
by Grayson Roze,
Chief Strategist, StockCharts.com
by David Keller,
President and Chief Strategist, Sierra Alpha Research
Grayson Roze and David Keller share ten charts to watch for November, including setups in Celsius, Regeneron, Caterpillar, Eli Lilly, and Shopify. Learn how they use StockCharts tools and trend analysis to locate strength and manage risk in a stretched bull market....
READ MORE
MEMBERS ONLY
When Market Leaders Falter: What Recent Moves in the Magnificent 7 Mean for Investors
by David Keller,
President and Chief Strategist, Sierra Alpha Research
As the Magnificent 7 dictate the tone for the S&P 500, their charts reveal early signs of fatigue amid mixed earnings reactions. Technical discipline remains essential as investors assess whether these former leaders can sustain their uptrends into year-end....
READ MORE
MEMBERS ONLY
Head and Shoulders Tops: Classic Signals, Key Phases, and a Surprise Reversal
by David Keller,
President and Chief Strategist, Sierra Alpha Research
Dave Keller explores the classic head and shoulders top, breaking down its three key phases with examples from JNJ and Dominion, plus a failed pattern in Nucor that turned into a bullish reversal....
READ MORE
MEMBERS ONLY
This Head and Shoulders Pattern Looked Perfect… Until It Failed!
by David Keller,
President and Chief Strategist, Sierra Alpha Research
Learn how to spot valid head and shoulders patterns and when to walk away. David Keller, CMT, shows how failed setups can signal strength and potential bullish reversals....
READ MORE
MEMBERS ONLY
Three Charts That Prove the Power of Process Over Prediction
by David Keller,
President and Chief Strategist, Sierra Alpha Research
Technical analysis is about having a consistent process of evaluating the evidence. Dave revisits three charts he highlighted at the end of September, reviews how the technical picture has changed, and updates his thesis using price and momentum techniques....
READ MORE
MEMBERS ONLY
Will These Broken Charts Overcome Bearish Divergences?
by David Keller,
President and Chief Strategist, Sierra Alpha Research
Bearish momentum divergences can help provide a game plan for confirming potential price breakdowns. We review three charts to see how they have evolved since a bearish rotation, and focus on identifying potential entry points for the next rally phase....
READ MORE
MEMBERS ONLY
The Dreaded Hindenburg Omen Fires Again
by David Keller,
President and Chief Strategist, Sierra Alpha Research
The Hindenburg Omen is a macro technical indicator which was designed by reviewing the common characteristics of previous bull market tops. Dave breaks down the components of this indicator, reviews signals from the last 10 years, and discusses implications for the S&P 500 in Q4 2025....
READ MORE
MEMBERS ONLY
Four Roads Diverge in the Market: Which Will the S&P 500 Take?
by David Keller,
President and Chief Strategist, Sierra Alpha Research
We outline four potential scenarios for the S&P 500 index through the end of November 2025, along with our probabilities for each of the scenarios. Which one do you feel is most likely to occur?...
READ MORE
MEMBERS ONLY
Will These Three Promising Charts Hold Key Support?
by David Keller,
President and Chief Strategist, Sierra Alpha Research
We highlight three stocks that have experienced strong gains since August, but are now testing key support levels. Will support hold, or will the bull market be brought into question?...
READ MORE
MEMBERS ONLY
10 Must-See Charts for October 2025
by Grayson Roze,
Chief Strategist, StockCharts.com
by David Keller,
President and Chief Strategist, Sierra Alpha Research
Join Grayson and Dave as they reveal their top 10 stock charts to watch this October....
READ MORE
MEMBERS ONLY
Dave's September 2025 Stock Picks: 3 Charts That Worked… and 2 That Didn’t
by David Keller,
President and Chief Strategist, Sierra Alpha Research
Dave revisits five stocks from the September Top Ten Charts episode to see how they’ve evolved. He reviews NVDA, AXP, MSI, MRK, and the SIL, explaining which setups worked, which failed, and the lessons to carry forward. From short ideas that didn’t pan out to breakout patterns and...
READ MORE
MEMBERS ONLY
Dow Theory Bearish, But Some Transports Are Thriving
by David Keller,
President and Chief Strategist, Sierra Alpha Research
Dow Theory has flashed a bearish non-confirmation signal. Dave breaks down the implications of this ominous pattern and analyzes some of the key transportation stocks that have caused this macro divergence....
READ MORE
MEMBERS ONLY
Offense Still Crushing Defense
by David Keller,
President and Chief Strategist, Sierra Alpha Research
While technology stocks have stalled out over the last six weeks, other growth sectors have stepped into a leadership role. Here are the charts Dave uses regularly to track leadership themes, and identify when new sectors are improving in relative strength terms....
READ MORE
MEMBERS ONLY
RSI Overbought? Why That Could Signal Big Gains Ahead
by David Keller,
President and Chief Strategist, Sierra Alpha Research
Join Dave as he explains how traders often get into trouble by thinking of “overbought” stocks as being bearish setups. While an RSI over 70 can often lead to short-term pullbacks, Dave explains that they can also signal the strength of a long-term uptrend phase. He uses Motorola Solutions (MSI)...
READ MORE
MEMBERS ONLY
Pullback or Pitfall? Let the 21-Day EMA Be Your Guide
by David Keller,
President and Chief Strategist, Sierra Alpha Research
Dave explains how the 21-day exponential moving average can help confirm trend phases, validate signals from other moving averages, and serve as an essential risk management tool for traders....
READ MORE
MEMBERS ONLY
Mapping the Road Ahead: Four Scenarios for the Nasdaq 100
by David Keller,
President and Chief Strategist, Sierra Alpha Research
While August and September are traditionally a weak period for stocks, the Nasdaq 100 has continued to drive higher. We lay out four potential scenarios for the QQQ over the next six weeks, from the very bullish to the super bearish....
READ MORE
MEMBERS ONLY
Two Volume Indicators Every Investor Should Know
by David Keller,
President and Chief Strategist, Sierra Alpha Research
Dave explains why volume indicators, including the Accumulation/Distribution Line and Chaikin Money Flow, still matter in today’s markets. Using NVDA’s earnings, the S&P 500, WMT, and EAT as examples, he shows how volume trends can reveal accumulation or distribution beneath the surface, even when price...
READ MORE
MEMBERS ONLY
New Stocks Breaking Out While Big Tech Falters!
by David Keller,
President and Chief Strategist, Sierra Alpha Research
Mega-cap growth stocks like META, MSFT, and AAPL are showing weakness, but breadth conditions remain strong as other areas of the market push higher. In this episode, David Keller, CMT explores leadership rotation in August 2025, highlighting failed breakouts, key breadth indicators, and how to use scans on StockCharts to...
READ MORE
MEMBERS ONLY
Three Key Macro Charts I’m Watching on Vacation
by David Keller,
President and Chief Strategist, Sierra Alpha Research
Here are the key levels to watch in the S&P 500 as well as META, MSFT, and AAPL. As long as the index and stocks hold above key support levels, the uptrend in stocks is in good shape. ...
READ MORE
MEMBERS ONLY
The Good, the Bad, and the Sideways
by David Keller,
President and Chief Strategist, Sierra Alpha Research
As U.S. equity indexes hit new highs, not all stocks are keeping pace. Explore these three stocks that are at key technical junctures with charts that highlight trend shifts, risk levels, and actionable signals....
READ MORE
MEMBERS ONLY
Top 10 Stock Charts for August 2025 You Need to Watch Now
by David Keller,
President and Chief Strategist, Sierra Alpha Research
Join Dave as he shares ten actionable stock charts for August 2025 that he’s watching closely. From breakout setups to key reversals, David highlights tickers like Tesla, Meta, Caterpillar, Motorola, and Newmont Mining that show compelling technical patterns. He also walks through how to manage the full trading process...
READ MORE
MEMBERS ONLY
3 Types of Breakouts To Upgrade Your Portfolio
by David Keller,
President and Chief Strategist, Sierra Alpha Research
Use this StockCharts scan to identify three categories of stocks and ETFs that are making new three-month highs....
READ MORE
MEMBERS ONLY
Catch Big Moves Early With This Breakout Scan!
by David Keller,
President and Chief Strategist, Sierra Alpha Research
Follow along as Dave shares the one stock scan he runs every week to uncover potential breakout candidates. He explains the three types of chart setups that frequently appear, each with their own trading implications, and walks through how he structures trades according to type. He also illustrates how to...
READ MORE
MEMBERS ONLY
Is META Breaking Out or Breaking Down?
by David Keller,
President and Chief Strategist, Sierra Alpha Research
The chart of Meta Platforms, Inc. (META) has completed a roundtrip from the February high around $740 to the April low at $480 – and all the way back again. Over the last couple weeks, META has pulled back from its retest of all-time highs, leaving investors to wonder what may...
READ MORE
MEMBERS ONLY
A Wild Ride For the History Books: 2025 Mid-Year Recap
by Grayson Roze,
Chief Strategist, StockCharts.com
by David Keller,
President and Chief Strategist, Sierra Alpha Research
Markets don't usually hit record highs, then risk falling into bearish territory, and spring back to new highs within six months. But that's what happened in 2025.
In this special mid-year recap, Grayson Roze sits down with David Keller, CMT, to show how disciplined routines, price-based...
READ MORE
MEMBERS ONLY
Three Bearish Candle Patterns Every Investor Should Know
by David Keller,
President and Chief Strategist, Sierra Alpha Research
KEY TAKEAWAYS
* The shooting star pattern indicates a short-term rotation from accumulation to distribution.
* The bearish engulfing pattern suggests sellers have taken control, suggesting further weakness.
* The evening star pattern is a three-candle formation that illustrates an exhaustion of buying power.
There is no denying that the broad markets remain...
READ MORE
MEMBERS ONLY
From Hammer to Harami: Using StockCharts to Crack the Candlestick Code
by David Keller,
President and Chief Strategist, Sierra Alpha Research
Join Dave as he reviews three common candle patterns traders can use to identify potential turning points. From bullish engulfing patterns to evening star patterns, Dave gives insights on how to leverage these powerful candle signals to anticipate market shifts. He also shows combining candle patterns with conventional technical analysis...
READ MORE
MEMBERS ONLY
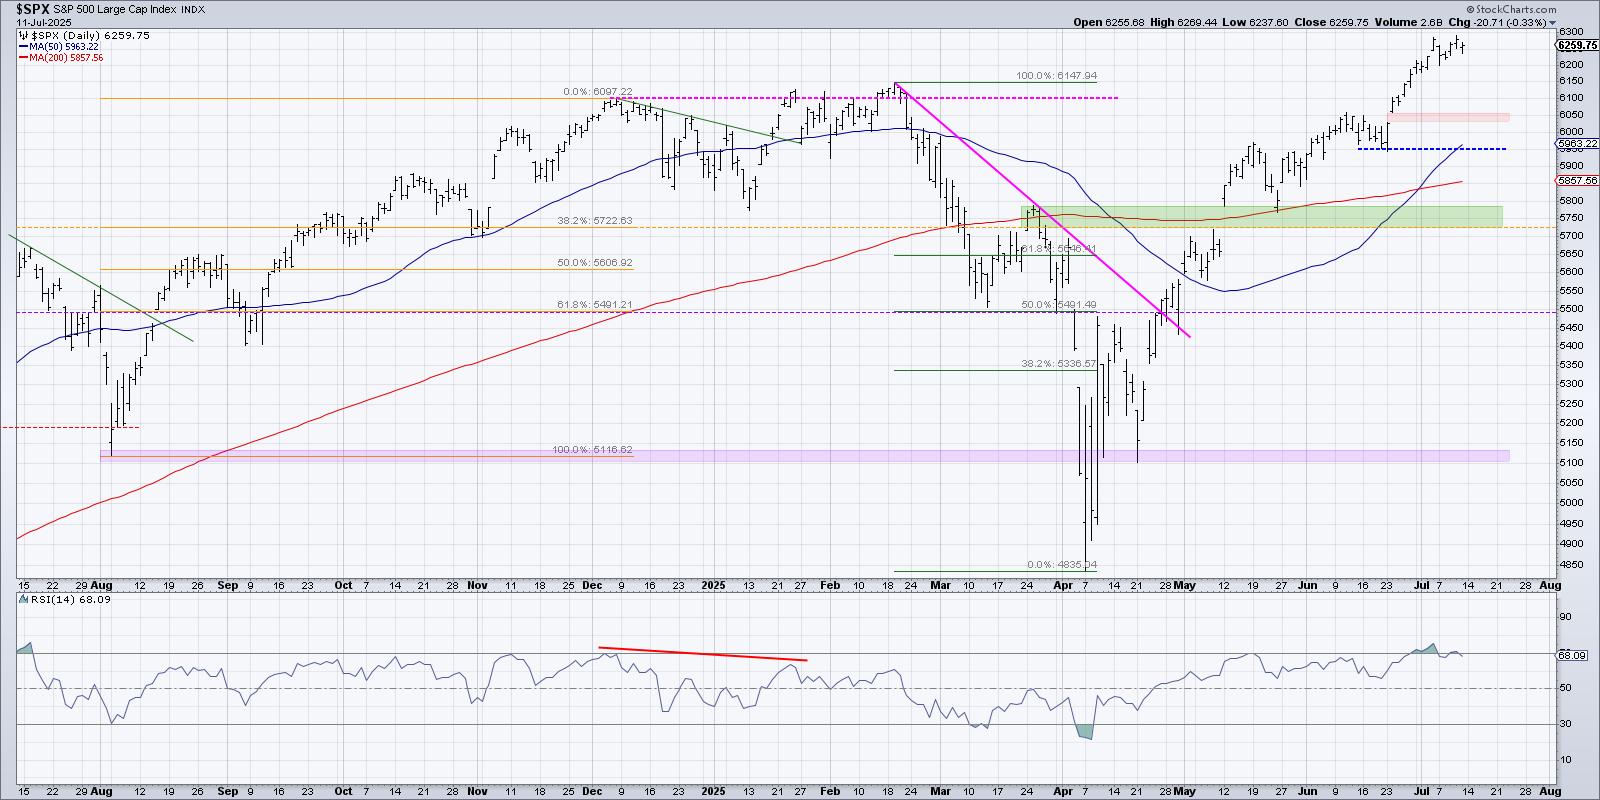
What Happens Next for the S&P 500? Pick Your Path!
by David Keller,
President and Chief Strategist, Sierra Alpha Research
The S&P continues to push higher, with the equity benchmark almost reaching 6300 this week for the first time in history. With so many potential macro headwinds still surrounding us, how can the market continue to reflect so much optimism? On the other hand, when will bulls wake...
READ MORE
MEMBERS ONLY
How to Find Compelling Charts in Every Sector
by David Keller,
President and Chief Strategist, Sierra Alpha Research
Over a number of years working for a large money manager with a rich history of stock picking, I became more and more enamored with the benefits of scanning for constructive price charts regardless of the broad market conditions. Earlier in my career, as I was first learning technical analysis,...
READ MORE
MEMBERS ONLY
Breakout Watch: One Stock in Each Sector to Watch Now
by David Keller,
President and Chief Strategist, Sierra Alpha Research
When sector performance shifts gears from one day to the next, it's best to be prepared with a handful of stocks from the each of the sectors.
In this hands-on video, David Keller, CMT, highlights his criteria for picking the top stocks in 10 of the 11 S&...
READ MORE
MEMBERS ONLY
Fibonacci Retracements: The Key to Identifying True Breakouts
by David Keller,
President and Chief Strategist, Sierra Alpha Research
If you've looked at enough charts over time, you start to recognize classic patterns that often appear. From head-and-shoulders tops to cup-and-handle patterns, they almost jump off the page when you bring up the chart. I would definitely include Fibonacci Retracements on that list, because before I ever...
READ MORE
MEMBERS ONLY
How to Use Fibonacci Retracements to Spot Key Levels
by David Keller,
President and Chief Strategist, Sierra Alpha Research
Join Dave as he shares how he uses the power of Fibonacci retracements to anticipate potential turning points. He takes viewers through the process of determining what price levels to use to set up a Fibonacci framework, and, from there, explains what Fibonacci retracements are telling him about the charts...
READ MORE
MEMBERS ONLY
Bearish Divergence Suggests Caution For S&P 500
by David Keller,
President and Chief Strategist, Sierra Alpha Research
With Friday's pullback after a relatively strong week, the S&P 500 chart appears to be flashing a rare but powerful signal that is quite common at major market tops. The signal in question is a bearish momentum divergence, formed by a pattern of higher highs in...
READ MORE