MEMBERS ONLY
Is the S&P 500 Flashing a Bearish Divergence?
by David Keller,
President and Chief Strategist, Sierra Alpha Research
Unlock the power of divergence analysis! Join Dave as he breaks down what a bearish momentum divergence is and why it matters. Throughout this video, Dave illustrates how to confirm (or invalidate) the signal on the S&P500, Nasdaq100, equal‑weighted indexes, semiconductors, and even defensive names like AT&...
READ MORE
MEMBERS ONLY
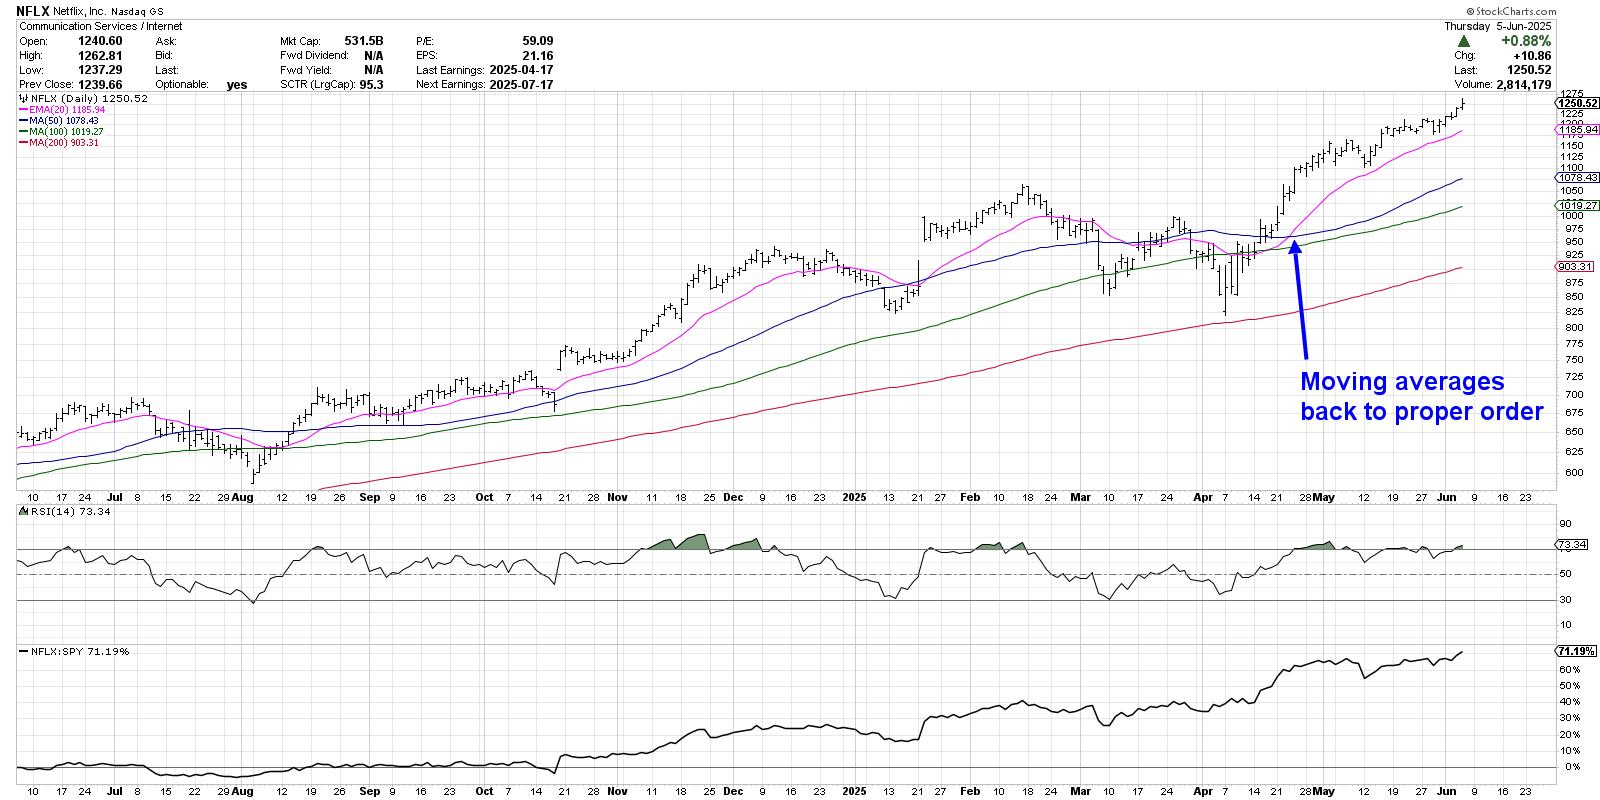
Three Charts Showing Proper Moving Average Alignment
by David Keller,
President and Chief Strategist, Sierra Alpha Research
I'm a huge fan of using platforms like StockCharts to help make my investment process more efficient and more effective. The StockCharts Scan Enginehelps me identify stocks that are demonstrating constructive technical configuration based on the shape and relationship of multiple moving averages.
Today, I'll share...
READ MORE
MEMBERS ONLY
How I Find Up-trending Stocks Every Week (Step-by-Step Scan Tutorial)
by David Keller,
President and Chief Strategist, Sierra Alpha Research
In this video, Dave shares his weekly stock scan strategy used to identify bullish stock trends. He illustrates how to set up this powerful scan, reveals the tips and tricks he uses to identify the most constructive patterns, and explains the four winning chart setups that tend to come up...
READ MORE
MEMBERS ONLY
Breakouts, Momentum & Moving Averages: 10 Must-See Stock Charts Right Now
by David Keller,
President and Chief Strategist, Sierra Alpha Research
by Grayson Roze,
Chief Strategist, StockCharts.com
Discover the top 10 stock charts to watch this month with Grayson Roze and David Keller, CMT. From breakout strategies to moving average setups, the duo walk through technical analysis techniques using relative strength, momentum, and trend-following indicators.
In this video, viewers will also gain insight into key market trends...
READ MORE
MEMBERS ONLY
Leadership Rotation Could Confirm Corrective Phase
by David Keller,
President and Chief Strategist, Sierra Alpha Research
There's no denying that the equity markets have taken on a decisively different look and feel in recent weeks.
We've compared the charts of the S&P 500 and Nasdaq 100, as well as leading growth stocks like Nvidia, to an airplane experiencing a "...
READ MORE
MEMBERS ONLY
What Happens When the S&P 500 Breaks Below Gap Support?
by David Keller,
President and Chief Strategist, Sierra Alpha Research
My main question going into this weekend was, "Will the S&P 500 finish the week above its 200-day moving average?" And while the S&P 500 did indeed finish the week above this long-term trend barometer, our main equity benchmark is now within the gap...
READ MORE
MEMBERS ONLY
Not All Price Gaps Are the Same! Here's How to Trade Them
by David Keller,
President and Chief Strategist, Sierra Alpha Research
Learn how to analyze stock price gaps with Dave! In this video, Dave discusses the different types of price gaps, why all price gaps are not the same, and how you can use the StockCharts platform to identify key levels and signals to follow on charts where price gaps occur....
READ MORE
MEMBERS ONLY
S&P 500 Now in Weakest Seasonal Period... Or Is It?
by David Keller,
President and Chief Strategist, Sierra Alpha Research
KEY TAKEAWAYS
* "Sell in May" is less about weakness in the spring and more about weakness in the autumn months.
* Since the COVID low, the S&P 500 has usually been quite strong in May-June-July.
* We're watching the SPX 5750 level along with other indicators...
READ MORE
MEMBERS ONLY
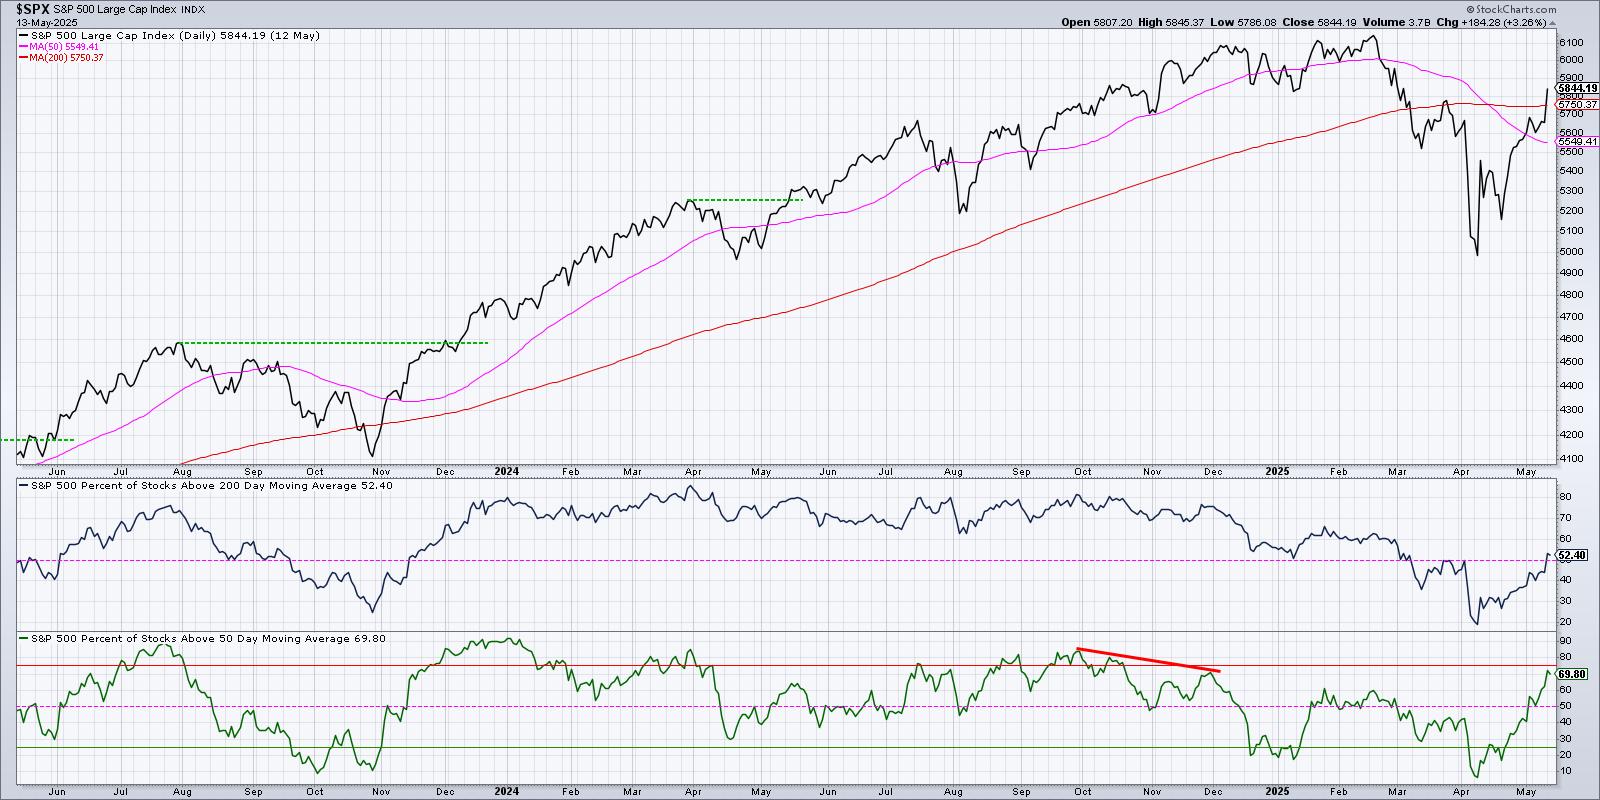
Bullish Breadth Improvement Suggests Further Upside for Stocks
by David Keller,
President and Chief Strategist, Sierra Alpha Research
KEY TAKEAWAYS
* For the first time since early March, over 50% of S&P 500 members are above their 200-day moving average.
* When this long-term breadth indicator has gone from below 25% to above 50%, forward 12-month returns have been positive.
* Investors should keep a watchful eye on the...
READ MORE
MEMBERS ONLY
50% of S&P 500 Stocks Just Turned Bullish – What Happens Next?
by David Keller,
President and Chief Strategist, Sierra Alpha Research
Bullish signal alert! Over 50% of S&P 500 stocks are now above their 200-day moving average.
In this video, Dave explains this key market breadth indicator and what it means for stock market trends. He shows how moving average breadth has reached a bullish milestone, what this means...
READ MORE
MEMBERS ONLY
Which Will Hit First: SPX 6100 or SPX 5100?
by David Keller,
President and Chief Strategist, Sierra Alpha Research
Last Friday, the S&P 500 finished the week just below 5700. The question going into this week was, "Will the S&P 500 get propelled above the 200-day?" And as I review the evidence after Friday's close, I'm noting that the...
READ MORE
MEMBERS ONLY
Three Charts to Watch for an "All Clear" Signal
by David Keller,
President and Chief Strategist, Sierra Alpha Research
KEY TAKEAWAYS
* If our medium-term Market Trend Model turns bullish this Friday, that would mean the first bullish reversal since October 2023.
* Less than 50% of S&P 500 members are above their 200-day moving average, and any reading above 50% could confirm bullish conditions.
* Offensive sectors like Consumer...
READ MORE
MEMBERS ONLY
Four Charts to Track a Potential Market Top
by David Keller,
President and Chief Strategist, Sierra Alpha Research
In this video, Dave reveals four key charts he's watching to determine whether the S&P 500 and Nasdaq 100 will be able to power through their 200-day moving averages en route to higher highs. Using the recently updated StockCharts Market Summary page, he covers moving average...
READ MORE
MEMBERS ONLY
Three Stocks With Post-Earnings Upside Potential
by David Keller,
President and Chief Strategist, Sierra Alpha Research
With the major averages logging a strong up week across the board, and with the Nasdaq 100 finallyretesting its 200-day moving averagefrom below, it can feel like a challenging time to take a shot at winning charts. You may ask yourself, "Do I really want to be betting on...
READ MORE
MEMBERS ONLY
Top 10 Stock Charts For May 2025: Breakouts, Trends & Big Moves!
by David Keller,
President and Chief Strategist, Sierra Alpha Research
by Grayson Roze,
Chief Strategist, StockCharts.com
Discover the top 10 stock charts to watch this month with Grayson Roze and David Keller, CMT. They break down breakout strategies, moving average setups, and technical analysis strategies using relative strength, momentum, and trend-following indicators. This analysis covers key market trends that could impact your trading decisions. You don&...
READ MORE
MEMBERS ONLY
Tesla: The Breakout to Bolster the Bulls
by David Keller,
President and Chief Strategist, Sierra Alpha Research
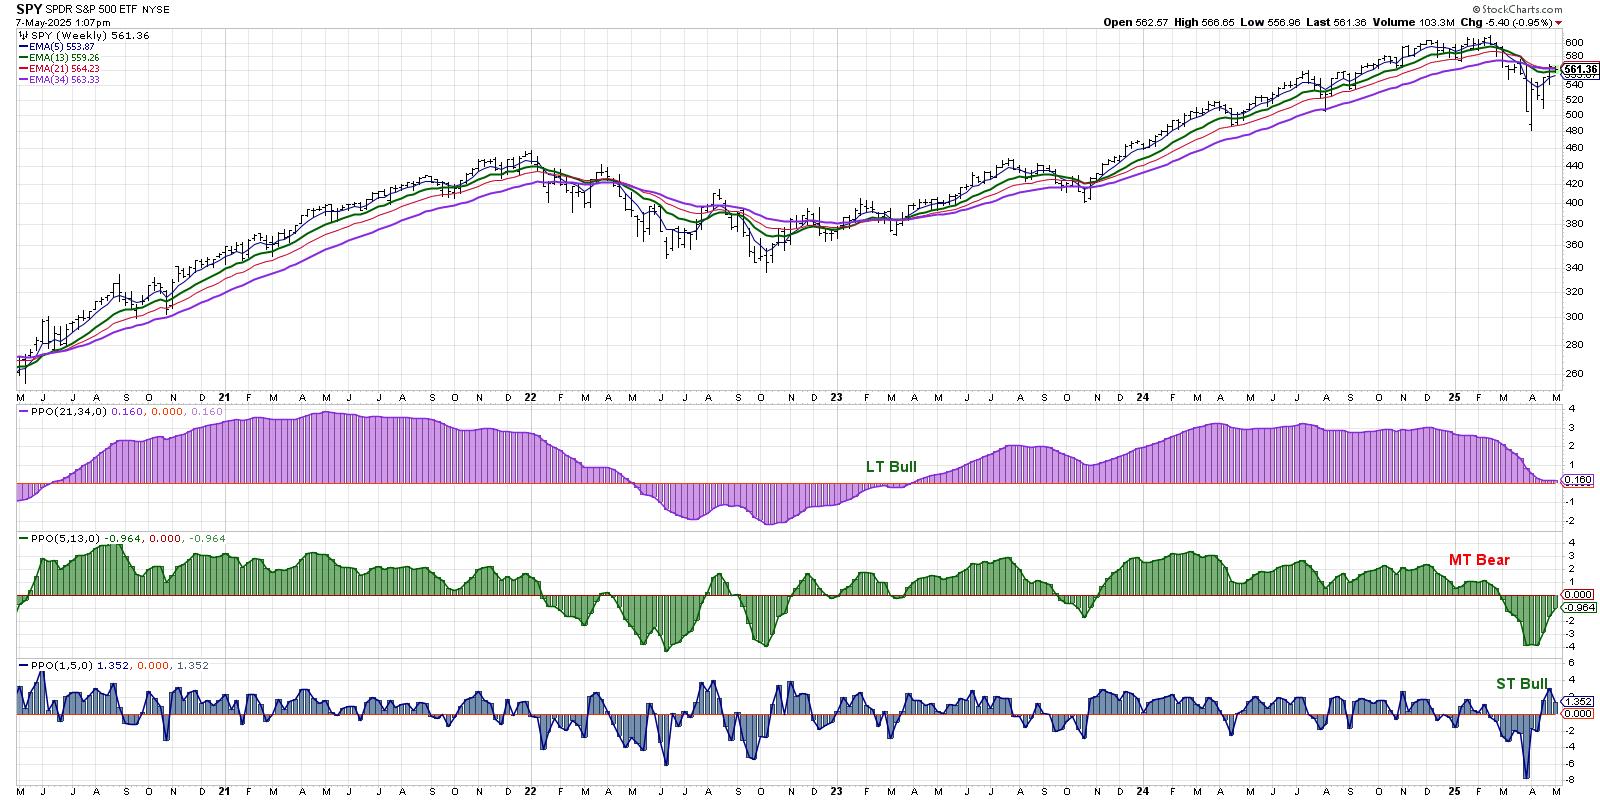
KEY TAKEAWAYS
* An absence of strong momentum tells us to be patient and wait for a better entry point on the chart.
* Momentum indicators like RSI can help us define the trend phase and better identify when buyers are taking control.
* A breakout above $290 could indicate a new accumulation...
READ MORE
MEMBERS ONLY
S&P 500 Rises from Bearish to Neutral, But Will It Last?
by David Keller,
President and Chief Strategist, Sierra Alpha Research
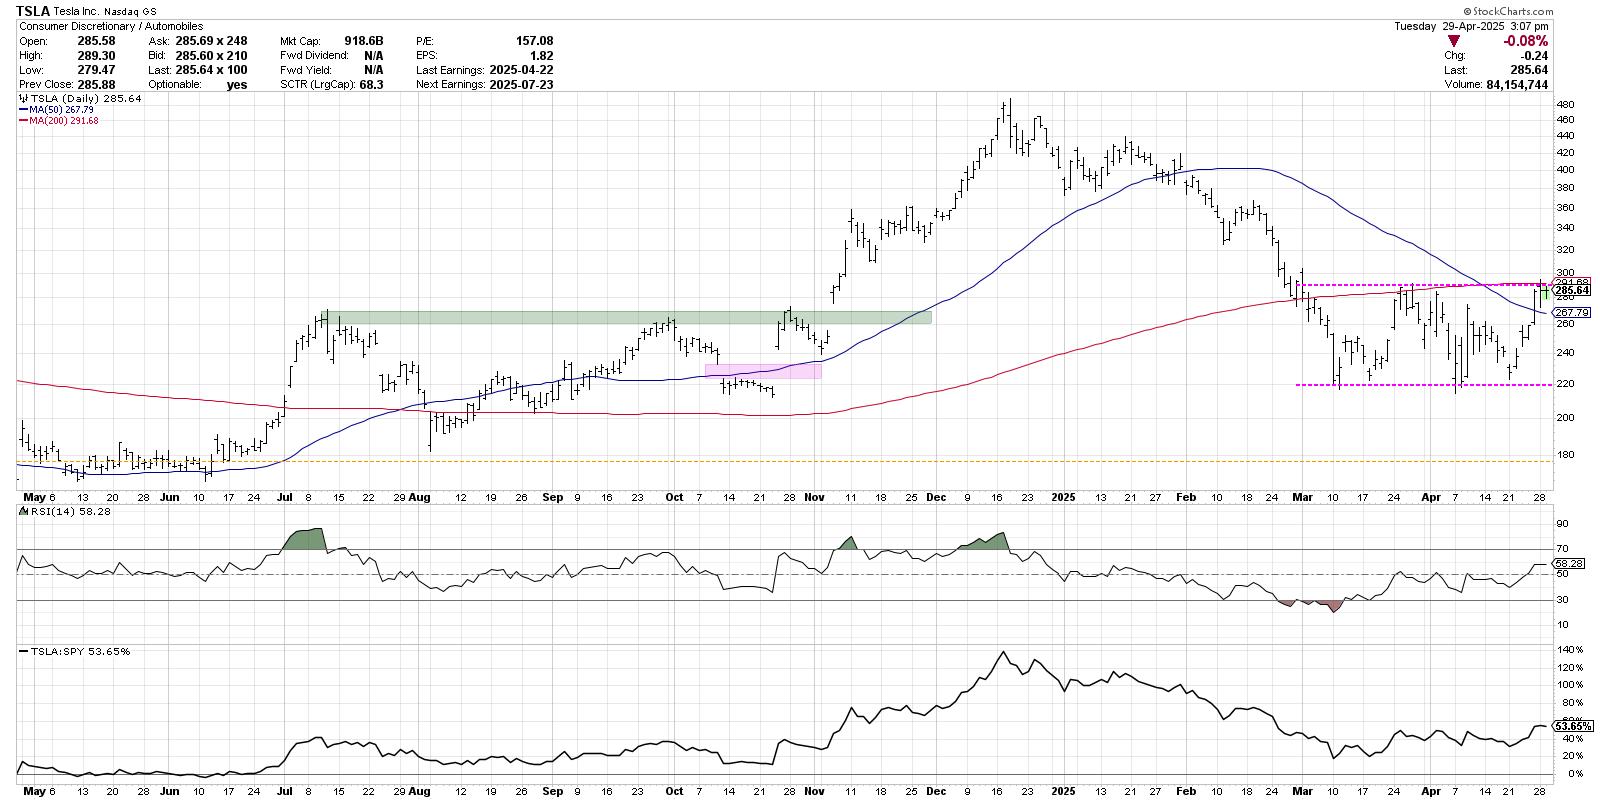
KEY TAKEAWAYS
* This week's rally pushed the S&P 500 above an important trendline formed by the major highs in 2025.
* Improving market breadth indicators confirm a broad advance off the early April market low.
* Using a "stoplight" technique, we can better assess risk and...
READ MORE
MEMBERS ONLY
Sentiment Signals Suggest Skepticism
by David Keller,
President and Chief Strategist, Sierra Alpha Research
KEY TAKEAWAYS
* The AAII survey demonstrates a lack of bullish optimism after the recent bounce higher.
* The NAAIM Exposure Index suggests that money managers remain skeptical of the recent advance.
* While Rydex fund flows show a rotation to defensive positions, previous bearish cycles have seen much larger rotations.
When I...
READ MORE
MEMBERS ONLY
Bearish Warning: 3 Market Sentiment Indicators You Can't Ignore
by David Keller,
President and Chief Strategist, Sierra Alpha Research
In this video, market sentiment, investor psychology, and stock market trends take center stage as David Keller, CMT, shares three powerful sentiment indicators that he tracks every week. He explains how the values are derived, what the current readings say about the market environment in April 2025, and how these...
READ MORE
MEMBERS ONLY
When in Doubt, Follow the Leadership
by David Keller,
President and Chief Strategist, Sierra Alpha Research
KEY TAKEAWAYS
* The Consumer Discretionary sector has underperformed the Consumer Staples sector since February, indicating defensive positioning for investors.
* The Relative Rotation Graphs (RRG) show a clear rotation from "things you want" to "things you need" as investors fear weakening economic conditions.
* We remain focused on...
READ MORE
MEMBERS ONLY
200-Day Moving Average Confirms Bearish Phase
by David Keller,
President and Chief Strategist, Sierra Alpha Research
KEY TAKEAWAYS
* The S&P 500 currently sits about 8% below its 200-day moving average, even with a strong upswing on last week's tariff news.
* The newly updated Market Summary page on StockCharts.com allows investors to compare key market indexes to their 200-day moving averages.
* Three...
READ MORE
MEMBERS ONLY
Bullish Percent Index Confirms Short-Term Rebound
by David Keller,
President and Chief Strategist, Sierra Alpha Research
KEY TAKEAWAYS
* The Bullish Percent Index for both the Nasdaq 100 and S&P 500 have made moves similar to previous swing lows.
* A long-term review of these signals yields mixed results, especially during sustained bearish market regimes.
One of my favorite market breadth indicators remained in an extreme...
READ MORE
MEMBERS ONLY
Is the Stock Market Getting Ready to Bounce? Key Market Breadth Signal Explained
by David Keller,
President and Chief Strategist, Sierra Alpha Research
When the stock market slides significantly, it's natural to question if the market has bottomed and getting ready to bounce.
In this video, David Keller, CMT highlights the Bullish Percent Index (BPI) as a key indicator to monitor during corrective moves. Learn more about how the BPI is...
READ MORE
MEMBERS ONLY
Three Defensive Plays for Post-Tariff Survival
by David Keller,
President and Chief Strategist, Sierra Alpha Research
KEY TAKEAWAYS
* Kroger remains in a primary uptrend of higher highs and higher lows, a rare feature for S&P 500 members in April 2025.
* Keurig Dr Pepper has overcome gap resistance and now demonstrates strong technical characteristics.
* The Utilities sector has show improving relative strength in 2025, outperforming...
READ MORE
MEMBERS ONLY
Top 10 Stock Charts for April 2025: Big Breakouts Ahead?
by David Keller,
President and Chief Strategist, Sierra Alpha Research
by Grayson Roze,
Chief Strategist, StockCharts.com
Finding stocks that show promising opportunities can be challenging in a market that goes up and down based on news headlines. But, it's possible.
In this video, watch how Grayson Roze and David Keller, CMT use the tools available in StockCharts to find stocks that are breaking out,...
READ MORE
MEMBERS ONLY
Bear Flag Alert - Downside S&P 500 Target Update
by David Keller,
President and Chief Strategist, Sierra Alpha Research
KEY TAKEAWAYS
* A confirmed bear flag pattern would imply a minimum downside objective around $SPX 5200.
Friday's overheated inflation data appears to have initiated a new downward leg for the major equity averages. This could mean a confirmed bear flag pattern for the S&P 500, and...
READ MORE
MEMBERS ONLY
Three Growth Stocks Testing the Ultimate Trend Barometer
by David Keller,
President and Chief Strategist, Sierra Alpha Research
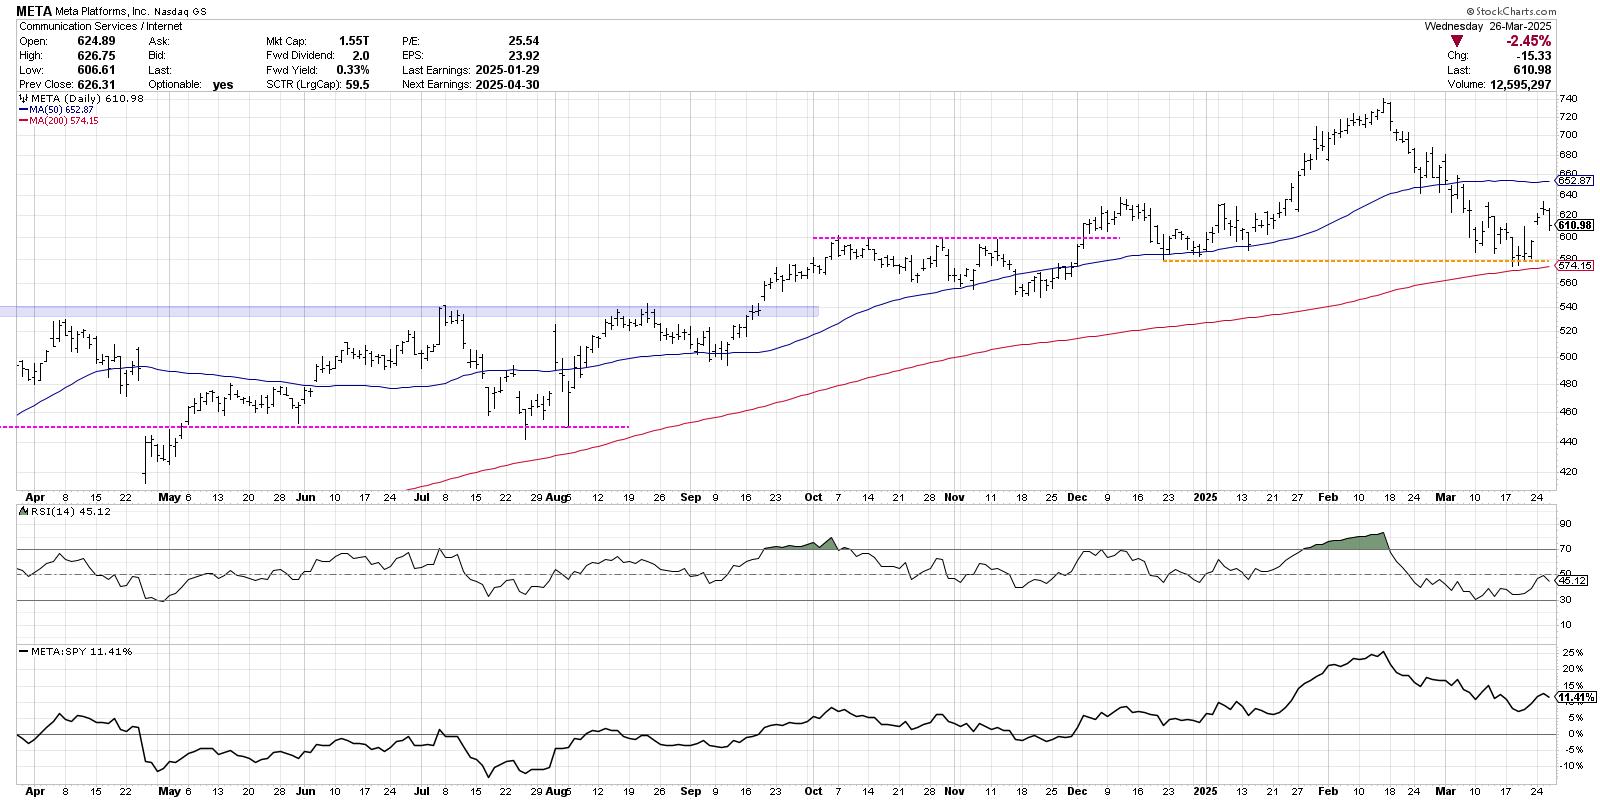
KEY TAKEAWAYS
* META remains above an upward-sloping 200-day moving average.
* If AMZN fails to hold its 200-day, this could mean bad things for AMZN and bad things for the markets.
* TSLA has rallied up to its 200-day moving average, but so far has failed to gain a foothold above this...
READ MORE
MEMBERS ONLY
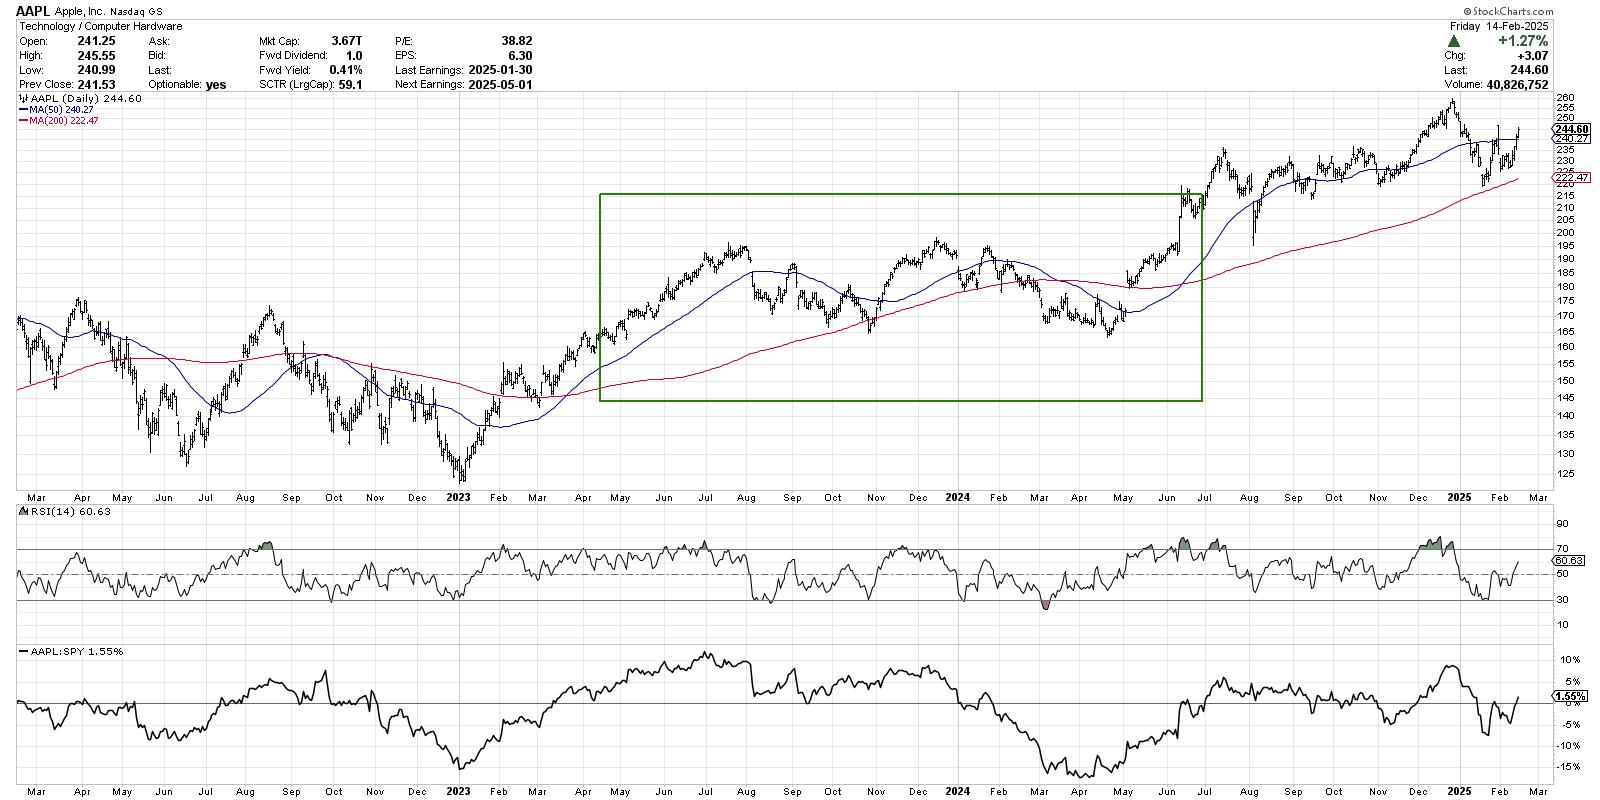
Key Levels for AAPL, AMZN, NVDA — Will This Market Rally Hold?
by David Keller,
President and Chief Strategist, Sierra Alpha Research
In this video, Dave breaks down the upside bounce in the Magnificent 7 stocks — AAPL, AMZN, NVDA, and more — highlighting key levels, 200-day moving averages, and top trading strategies using the StockCharts platform. Find out whether these leading growth stocks are set for a bullish reversal or more downside. Will...
READ MORE
MEMBERS ONLY
Will QQQ Retest All-Time Highs By End of April?
by David Keller,
President and Chief Strategist, Sierra Alpha Research
After reaching an all-time around $540 in mid-February, the Nasdaq 100 ETF (QQQ) dropped almost 14% to make a new swing low around $467. With the S&P 500 and Nasdaq bouncing nicely this week, investors are struggling to differentiate between a bearish dead-cat bounce and a bullish full...
READ MORE
MEMBERS ONLY
4 Scenarios for Nasdaq 100: Bullish Surge or Bearish Collapse?
by David Keller,
President and Chief Strategist, Sierra Alpha Research
Can the Nasdaq 100 rally to all-time highs or break down below key support? In this video, Dave uses probabilistic analysis to explore 4 possible scenarios for the QQQ over the next 6 weeks — from a super bullish surge to a bearish breakdown below the August 2024 low. Discover the...
READ MORE
MEMBERS ONLY
Three Reasons to Consider Gold
by David Keller,
President and Chief Strategist, Sierra Alpha Research
KEY TAKEAWAYS
* Gold has dramatically outperformed the S&P 500 and Nasdaq in 2025.
* Gold prices remain in a primary uptrend, with our Market Trend Model reading bullish on all time frames.
* Gold stocks are outperforming physical gold, and could represent a "catch up" trade going into...
READ MORE
MEMBERS ONLY
Five Stocks Showing Strength in a Bearish Tape
by David Keller,
President and Chief Strategist, Sierra Alpha Research
KEY TAKEAWAYS
* There's strength in the financial sector, but it's not the banks.
* Auto parts remains a strong group in a struggling sector.
* Three-month highs often signal renewed strength.
Where can investors find a safe haven during a period of market uncertainty? Personally, I think it&...
READ MORE
MEMBERS ONLY
5 Strong Stocks Defying the Bearish Market!
by David Keller,
President and Chief Strategist, Sierra Alpha Research
In this video, Dave analyzes the bearish rotation in his Market Trend Model, highlighting the S&P 500 breakdown below the 200-day moving average and its downside potential. He also identifies five strong stocks with bullish technical setups despite market weakness. Watch now for key technical analysis insights to...
READ MORE
MEMBERS ONLY
My Downside Target for the S&P 500
by David Keller,
President and Chief Strategist, Sierra Alpha Research
KEY TAKEAWAYS
* Once our "line in the sand" of SPX 5850 was broken, that confirmed a likely bear phase for stocks.
* We can use Fibonacci Retracements to identify a potential downside objective based on the strength of the previous bull trend.
* A confirmed sell signal from the Newer...
READ MORE
MEMBERS ONLY
S&P 500 Selloff: Bearish Rotation & Key Downside Targets!
by David Keller,
President and Chief Strategist, Sierra Alpha Research
In this video, Dave analyzes market conditions, bearish divergences, and leadership rotation in recent weeks. He examines the S&P 500 daily chart, highlighting how this week's selloff may confirm a bearish rotation and set downside price targets using moving averages and Fibonacci retracements. To validate a...
READ MORE
MEMBERS ONLY
3 Compelling Charts in the Financial Sector
by David Keller,
President and Chief Strategist, Sierra Alpha Research
KEY TAKEAWAYS
* ICE pushed to a new all-time high this week, completing a bullish rotation after finding Fibonacci support.
* V has experienced a series of bullish breakouts after completing a cup-and-handle pattern in 2024.
* JPM has pulled back to an ascending 50-day moving average, suggesting a potential short-term low during...
READ MORE
MEMBERS ONLY
Bearish Signals & Risk Management: Protect Your Portfolio!
by David Keller,
President and Chief Strategist, Sierra Alpha Research
In this video, Dave breaks down bearish macro signals and risk management using the "line in the sand" technique! Learn how to spot key support levels, set alerts on StockCharts, and protect your portfolio!
This video originally premiered on February 26, 2025. Watch on StockCharts' dedicated David...
READ MORE
MEMBERS ONLY
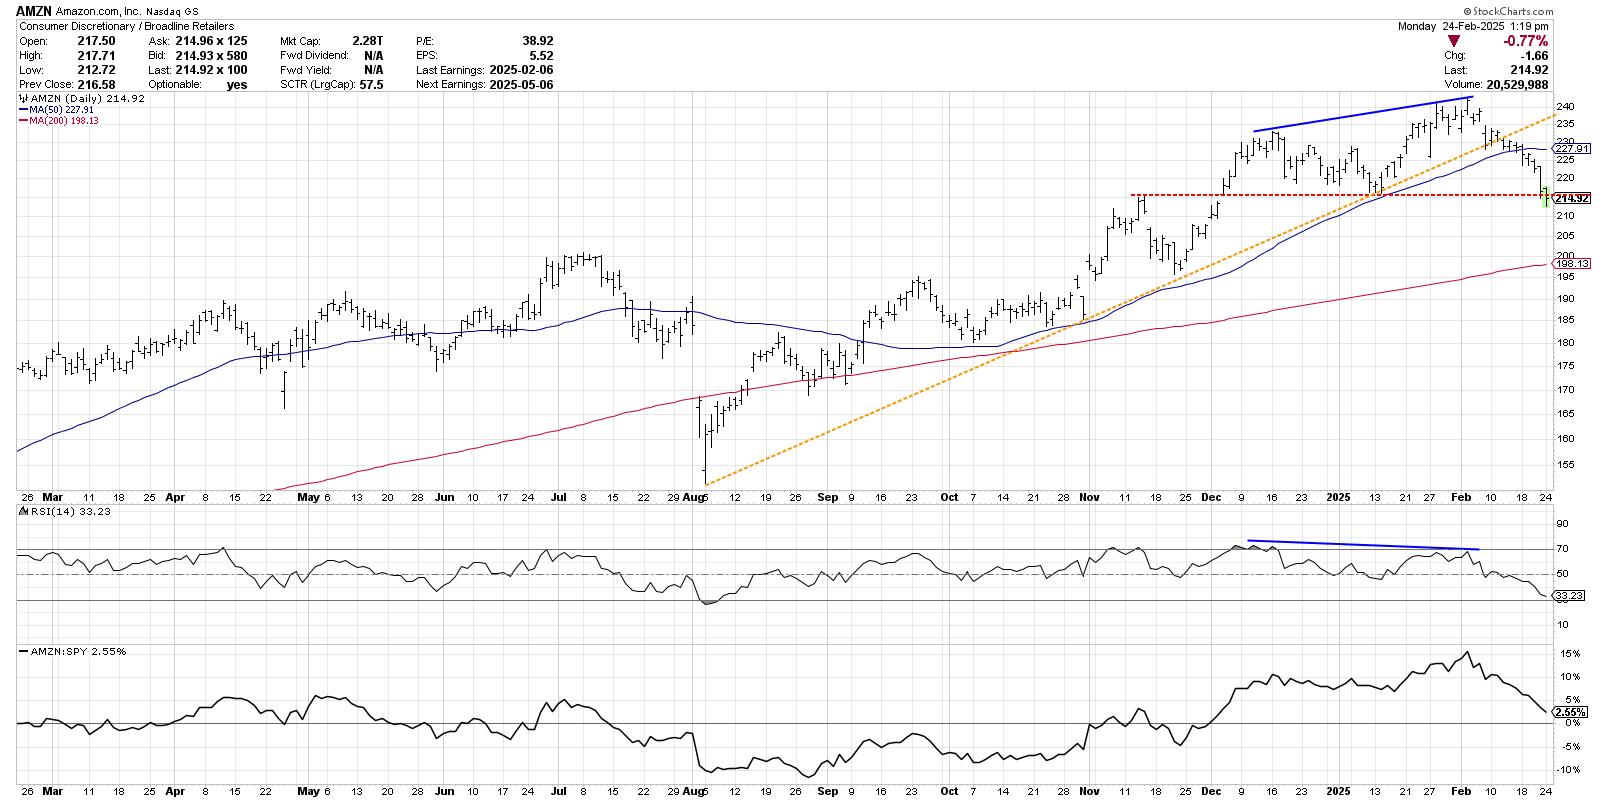
AMZN: A Case Study in Bearish Divergence
by David Keller,
President and Chief Strategist, Sierra Alpha Research
In the later stages of a bull market cycle, we will often observe a proliferation of bearish momentum divergences. As prices continue higher, the momentum underneath the advance begins to wane, representing an exhaustion of buyers.
We've identified a series of bearish momentum divergences in the early days...
READ MORE
MEMBERS ONLY
Three Signs of the Bear and What May Come Next!
by David Keller,
President and Chief Strategist, Sierra Alpha Research
KEY TAKEAWAYS
* Bearish momentum divergences suggest potential exhaustion of the bulls and limited upside.
* Market breadth indicators have not confirmed recent highs, reflecting a lack of support outside the leading performers.
* Dow Theory non-confirmation, a pattern first identified by Charles Dow, shows that market indexes are not confirming one another....
READ MORE
MEMBERS ONLY
Master Multiple Timeframe Analysis With This Simple Method
by David Keller,
President and Chief Strategist, Sierra Alpha Research
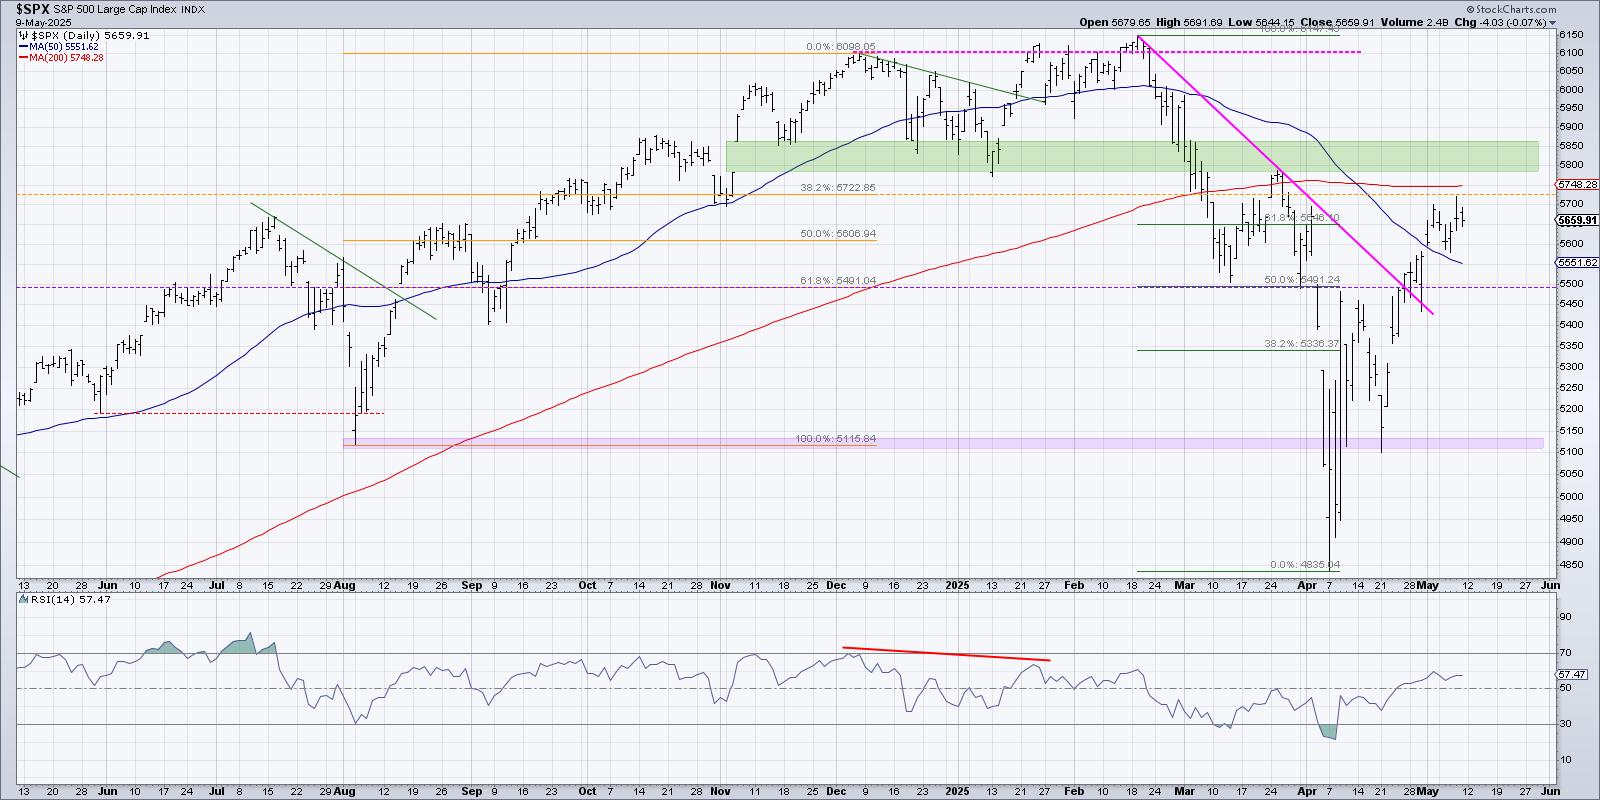
KEY TAKEAWAYS
* We can use the slope of moving averages, as well as a simple crossover technique, to define trends and identify trend changes.
* Our Market Trend Model uses exponential moving averages, as they are more sensitive to changes in market direction.
* Based on our Market Trend Model, the S&...
READ MORE