MEMBERS ONLY
Three Behavioral Biases You're Probably Struggling With Right Now
by David Keller,
President and Chief Strategist, Sierra Alpha Research
I've spent much of my career helping investors become more like pilots. Why is this such an important mindset to adopt? Well, pilots have to maintain good situational awareness, understanding what is happening around them. They need to make difficult decisions and recognize when conditions are changing. And,...
READ MORE
MEMBERS ONLY
Viewer Questions: How Does the Fed Manipulate the Yield Curve?
by David Keller,
President and Chief Strategist, Sierra Alpha Research
In this edition of StockCharts TV'sThe Final Bar, Dave hosts a special all-mailbag edition, answering viewer questions on leading vs. lagging indicators, arithmetic vs. log scale charts, and how the Fed manipulates the yield curve. He digs into specific trading strategies using RSI, MACD, On Balance Volume, and...
READ MORE
MEMBERS ONLY
Why SMALL CAPS MATTER in January 2024
by David Keller,
President and Chief Strategist, Sierra Alpha Research
In this edition of StockCharts TV'sThe Final Bar, guest John Kolovos, CFA CMT of Macro Risk Advisors describes how the market is reacting to "good overbought" conditions in late 2023, and why the Russell 2000 small cap ETF may be the chart to watch in Q1...
READ MORE
MEMBERS ONLY
The Case for a Tactical Stock Selloff
by David Keller,
President and Chief Strategist, Sierra Alpha Research
In this edition of StockCharts TV'sThe Final Bar, guest Adam Turnquist of LPL Financial lays out the case for a tactical selloff for stocks, as well as why long-term indicators remain constructive in early 2024. Dave breaks down the bearish momentum divergence prevalent in the technology sector, and...
READ MORE
MEMBERS ONLY
S&P 4300 by End of February?
by David Keller,
President and Chief Strategist, Sierra Alpha Research
We kicked off the new year of 2024 with an overheated stock market, excessively bullish breadth indicators, and euphoric sentiment levels. While the first week in January felt like a "wake-up call" pullback for awestruck bulls, this last week saw the S&P 500 push right back...
READ MORE
MEMBERS ONLY
Your Questions Answered! Moving Averages, Chart Patterns, Inflation & More
by David Keller,
President and Chief Strategist, Sierra Alpha Research
In this edition of StockCharts TV'sThe Final Bar, Dave presents a special all-mailbag episode, answering viewer questions on simple vs. exponential moving averages, the benefits of analyzing sector rotation, and a good first chart for beginners learning technical analysis.
This video originally premiered on January 12, 2024. Watch...
READ MORE
MEMBERS ONLY
From Selloff to Surge: Growth Stocks Rebound After CPI
by David Keller,
President and Chief Strategist, Sierra Alpha Research
In this edition of StockCharts TV'sThe Final Bar, Dave highlights three leading growth stocks continuing to push to new swing highs. He also breaks down key market sentiment indicators, including the VIX, AAII survey, NAAIM Exposure Index, Rydex fund flows, and put/call ratios.
This video originally premiered...
READ MORE
MEMBERS ONLY
SPOT ETFs APPROVED!! The Technical Case for Bitcoin
by David Keller,
President and Chief Strategist, Sierra Alpha Research
In this edition of StockCharts TV'sThe Final Bar, Adrian Zduńczyk, CMT of The Birb Nest discusses upside potential for Bitcoin and Ethereum based on expectations around new Bitcoin ETFs, as well as a bullish technical configuration. Dave highlights leading growth stocks, like META scoring new 52-week highs, as...
READ MORE
MEMBERS ONLY
Don't Miss Out! 2 Promising Sectors in Early 2024
by David Keller,
President and Chief Strategist, Sierra Alpha Research
In this edition of StockCharts TV'sThe Final Bar, Julius de Kempenaer of RRG Research talks stocks over bonds and highlights two sectors with upside potential based on improvements in their relative strength. Dave unveils a bearish momentum divergence for Netflix and reveals two technology stocks that could still...
READ MORE
MEMBERS ONLY
January 2024: The Final Bar's Top 10 Must See Charts
by David Keller,
President and Chief Strategist, Sierra Alpha Research
by Grayson Roze,
Chief Strategist, StockCharts.com
In this edition of StockCharts TV'sThe Final Bar, Grayson Roze and Dave break down the trends for the top ten stocks and ETF charts for December 2023. They'll identify key levels and signals to watch for using technical analysis tools including moving averages, relative strength, RSI,...
READ MORE
MEMBERS ONLY
Three Charts to Track Impending Doom
by David Keller,
President and Chief Strategist, Sierra Alpha Research
KEY TAKEAWAYS
* January through March is the weakest three-month period for stocks in an election year.
* The McClellan Oscillator turned bearish this week, suggesting at least a short-term pullback for stocks.
* The VIX remains low, but a push above 15 could indicate further downside, retracing the gains from Q4.
Okay,...
READ MORE
MEMBERS ONLY
Growth Stocks Drop Again -- and That's Just the Beginning?!?
by David Keller,
President and Chief Strategist, Sierra Alpha Research
In this edition of StockCharts TV'sThe Final Bar, guest Jeff Huge, CMT of JWH Investments speaks to how extreme breadth conditions, sky-high valuations and overly bullish sentiment readings could indicate the beginning of a bear phase in 2024. Dave highlights two value sectors showing renewed signs of strength...
READ MORE
MEMBERS ONLY
Technology Shares PLUNGE to Kick Off 2024
by David Keller,
President and Chief Strategist, Sierra Alpha Research
In this edition of StockCharts TV'sThe Final Bar, guest Mish Schneider of MarketGauge talks strength in small caps, leadership in retail, and the importance of watching junk bonds for risk-on conditions. Dave charts pullbacks in AAPL and NVDA, and shares two names pushing higher as value beats growth...
READ MORE
MEMBERS ONLY
Unlocking Russell 2000 SECRETS & Volatility INSIGHTS!
by David Keller,
President and Chief Strategist, Sierra Alpha Research
In this special all-Mailbag edition of StockCharts TV'sThe Final Bar, Dave answers viewers' burning questions, ranging from the effectiveness of short-term moves with the 5-day MA to deciphering the mysteries of the Russell 2000's growth or value positioning and much more!
Click here to take...
READ MORE
MEMBERS ONLY
The Top Five Charts of 2023
by David Keller,
President and Chief Strategist, Sierra Alpha Research
KEY TAKEAWAYS
* 2023 was dominated by mega cap growth stocks, but the fourth quarter saw a potential change as other sectors experienced renewed vigor.
* Three breadth indicators provided great clarity to the up and down cycles over the course of the year, as extreme readings tended to coincide with major...
READ MORE
MEMBERS ONLY
Top Five Charts of 2023 #5: Bitcoin
by David Keller,
President and Chief Strategist, Sierra Alpha Research
In the fifth of a five-part special series on StockCharts TV'sThe Final Bar, Dave dives into the fascinating world of Bitcoin. Discover the incredible growth and performance of cryptocurrencies in 2023, surpassing even the stock market. Find out why Bitcoin's sudden breakouts and significant rallies make...
READ MORE
MEMBERS ONLY
Top Five Charts of 2023 #4: Leadership Themes
by David Keller,
President and Chief Strategist, Sierra Alpha Research
In the fourth of a five-part special series on StockCharts TV'sThe Final Bar, Dave discusses the top leadership trends of 2023. From the concept of narrow leadership to the rise of the Magnificent Seven, he explores the most important themes that shaped the year in this engaging episode....
READ MORE
MEMBERS ONLY
Top Five Charts of 2023 #3: Market Breadth Indicators
by David Keller,
President and Chief Strategist, Sierra Alpha Research
In the third of a five-part special series on StockCharts TV'sThe Final Bar, Dave breaks down three market breadth indicators that tell the story of market conditions in 2023. By analyzing the S&P 500 Bullish Percent Index, the percentage of stocks above their 50-day moving average,...
READ MORE
MEMBERS ONLY
Top Five Charts of 2023 #2: Ten-Year Treasury Yield
by David Keller,
President and Chief Strategist, Sierra Alpha Research
In the second of a five-part special series on StockCharts TV'sThe Final Bar, Dave takes a deep dive into the bond markets, talking rising rates, Fed rate hikes, value vs. growth, inverted yield curves, and what the bond markets in 2023 could tell us about potential future paths...
READ MORE
MEMBERS ONLY
Top Five Charts of 2023 #1: S&P 500
by David Keller,
President and Chief Strategist, Sierra Alpha Research
In the first of a five-part special series on StockCharts TV'sThe Final Bar, Dave walks through the S&P 500 index quarter by quarter. From the strong rally phase in the 2nd quarter to the dramatic reversal at the October low, 2023 has provided a perfect case...
READ MORE
MEMBERS ONLY
Extreme Breadth Readings Say Short-Term Bearish, Long-Term Bullish
by David Keller,
President and Chief Strategist, Sierra Alpha Research
By late October, the market conditions were dire indeed. The S&P 500 had broken below its 200-day moving average for the first time since March. Only 10% of S&P 500 members remained above their 50-day moving average, meaning a full 90% were below this key short-term...
READ MORE
MEMBERS ONLY
Larry Williams' 2024 Market Outlook
by Larry Williams,
Veteran Investor and Author
by David Keller,
President and Chief Strategist, Sierra Alpha Research
On this edition of StockCharts TV'sThe Final Bar, legendary trader and author Larry Williams joins Dave to share his lessons learned in 2023, his outlook for stocks in 2024, and which cycles he feels all investors should be following into the new year.
This video originally premiered on...
READ MORE
MEMBERS ONLY
Small-Caps Rocket to the Upside, Leave Large-Caps in the Dust
by David Keller,
President and Chief Strategist, Sierra Alpha Research
On this edition of StockCharts TV'sThe Final Bar,Julius de Kempenaer of RRG Research points out that growth vs. value is now more of a small vs. large question, with small caps rocketing to the upside in December. Host David Keller, CMT recaps the top charts of the...
READ MORE
MEMBERS ONLY
Blow-Off Top?! Market Reacts to the FED Announcement
by David Keller,
President and Chief Strategist, Sierra Alpha Research
Happy Fed Day on this edition of StockCharts TV'sThe Final Bar. There was quite a bit of movement leading into the FOMC announcement, with exceptional amounts of movement afterwards. Markets continued to push aggressively to the upside, with the S&P 500 closing the day out above...
READ MORE
MEMBERS ONLY
This Industry Group Outperformed the S&P 500 by OVER 120% in 2023!
by David Keller,
President and Chief Strategist, Sierra Alpha Research
In this edition of StockCharts TV'sThe Final Bar, guest Joe Rabil of Rabil Stock Research shares his biggest takeaway from investing in 2023 and also conducts a deep dive in the Consumer Discretionary sector with a focus on four stocks: SIG, TSLA, RL, and ABNB. Meanwhile, Dave unveils...
READ MORE
MEMBERS ONLY
Renewed UPTREND for Semis -- SMH and SOXX ETFs Breaking Out!
by David Keller,
President and Chief Strategist, Sierra Alpha Research
In this edition of StockCharts TV'sThe Final Bar, Dave recaps the renewed uptrend for semis, with ETFs like SMH and SOXX breaking out despite a lack of participation from the largest semiconductor name, Nvidia (NVDA). He answers viewer questions on QQQ, Netflix (NFLX), Resmed (RMD), Avis Budget Group...
READ MORE
MEMBERS ONLY
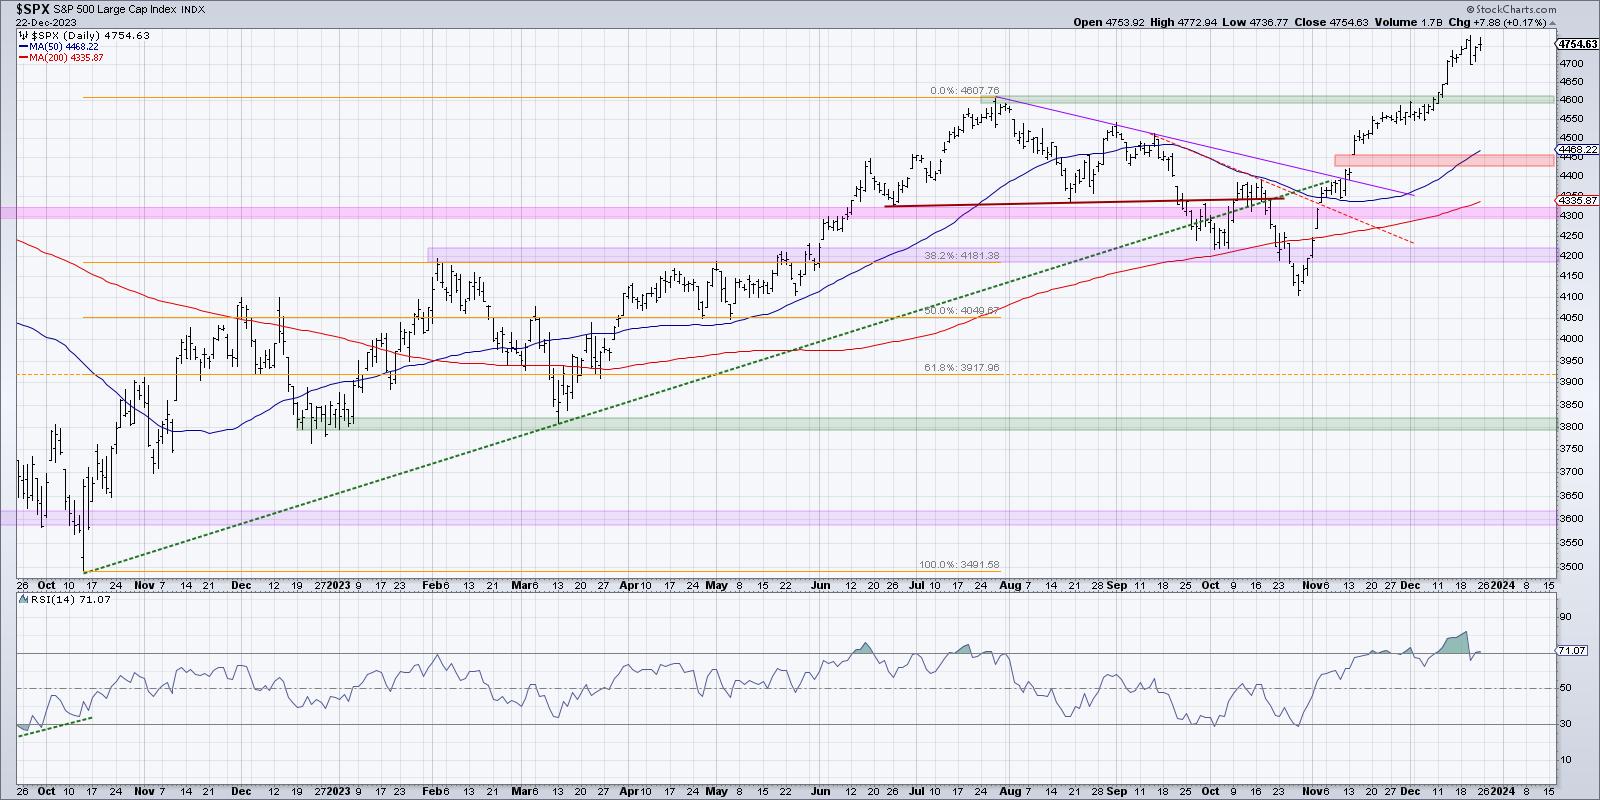
Will the S&P 500 Push Above 4600 Before Year-End?
by David Keller,
President and Chief Strategist, Sierra Alpha Research
KEY TAKEAWAYS
* The S&P 500 index has stalled out at its July high around 4600, and overbought readings from RSI indicate a likely pullback.
* Breadth indicators have reached bullish extreme readings, confirming the long-term bullish, short-term bearish thesis.
* Individual stocks from both growth and value sectors are overbought...
READ MORE
MEMBERS ONLY
Top 10 Charts to Watch in December 2023
by David Keller,
President and Chief Strategist, Sierra Alpha Research
by Grayson Roze,
Chief Strategist, StockCharts.com
In this edition of StockCharts TV'sThe Final Bar, Dave is joined by StockCharts' own Grayson Roze as they break down the trends for the top ten stocks and ETF charts for December 2023. Together, they identify key levels and signals to watch for using technical analysis tools...
READ MORE
MEMBERS ONLY
Lift Off! Aerospace and Defense Stocks Showing Multi-Year Breakout
by David Keller,
President and Chief Strategist, Sierra Alpha Research
In this edition of StockCharts TV'sThe Final Bar, guest Jeff Huge, CMT of JWH Investment Partners highlights one industry within the Industrial sector showing a multi-year breakout, and lays out the bull case for gold in 2024. Dave reviews travel and tourism charts, speaks to the strength in...
READ MORE
MEMBERS ONLY
High Risk of Market Downside in December?
by David Keller,
President and Chief Strategist, Sierra Alpha Research
In this edition of StockCharts TV'sThe Final Bar, guest John Kosar, CMT of Asbury Research updates his Asbury Six tactical market model and shares how investors can be better positioned for market uncertainty into 2024. Host Dave highlights the strong rally in financials and airlines, and reveals one...
READ MORE
MEMBERS ONLY
Trend Channels Help Define Stock Pullback Scenarios
by David Keller,
President and Chief Strategist, Sierra Alpha Research
In this edition of StockCharts TV'sThe Final Bar, guest Sam Burns, CFA of Mill Street Research focuses on strength in financials, weakness in crude oil, and key macro themes he'll be tracking into 2024. Meanwhile, Dave tracks the relentless upswing for Bitcoin, the pullback in gold...
READ MORE
MEMBERS ONLY
Is Every Stock on the Planet Overbought?!
by David Keller,
President and Chief Strategist, Sierra Alpha Research
In this edition of StockCharts TV'sThe Final Bar, host David Keller, CMT shows how mega-cap growth stocks like NFLX and GOOGL have pulled back from overbought conditions, and reviews how other market segments like gold and small caps are experiencing a similar pattern of upside exhaustion. He takes...
READ MORE
MEMBERS ONLY
Pullback Imminent for Nasdaq 100
by David Keller,
President and Chief Strategist, Sierra Alpha Research
KEY TAKEAWAYS
* The recent upside gap around $380 was a key moment for the QQQ, but if leading growth stocks continue to drop, this level may come into question.
* While a new all-time high for the Nasdaq 100 is a possibility over the next six to eight weeks, the overbought...
READ MORE
MEMBERS ONLY
Follow This Powerful Seasonal Playbook in Election Years
by David Keller,
President and Chief Strategist, Sierra Alpha Research
In this edition of StockCharts TV'sThe Final Bar, guest Jeff Hirsch of theStock Trader's Almanacshares the suggested seasonal pattern for 2024 and breaks down how previous election years have played out. Host David Keller, CMT highlights a breakout in gold miners, regional banks breaking above their...
READ MORE
MEMBERS ONLY
Market Secrets Revealed! Final Bar Mailbag -- US Dollar, S&P 500 ETF, Fibonacci Pivots
by David Keller,
President and Chief Strategist, Sierra Alpha Research
In this edition of StockCharts TV'sThe Final Bar, Dave devotes the show to the Mailbag. He answers viewer questions about the impact of the US Dollar on the stock market, why he uses the S&P 500 ETF rather than the S&P Index for relative...
READ MORE
MEMBERS ONLY
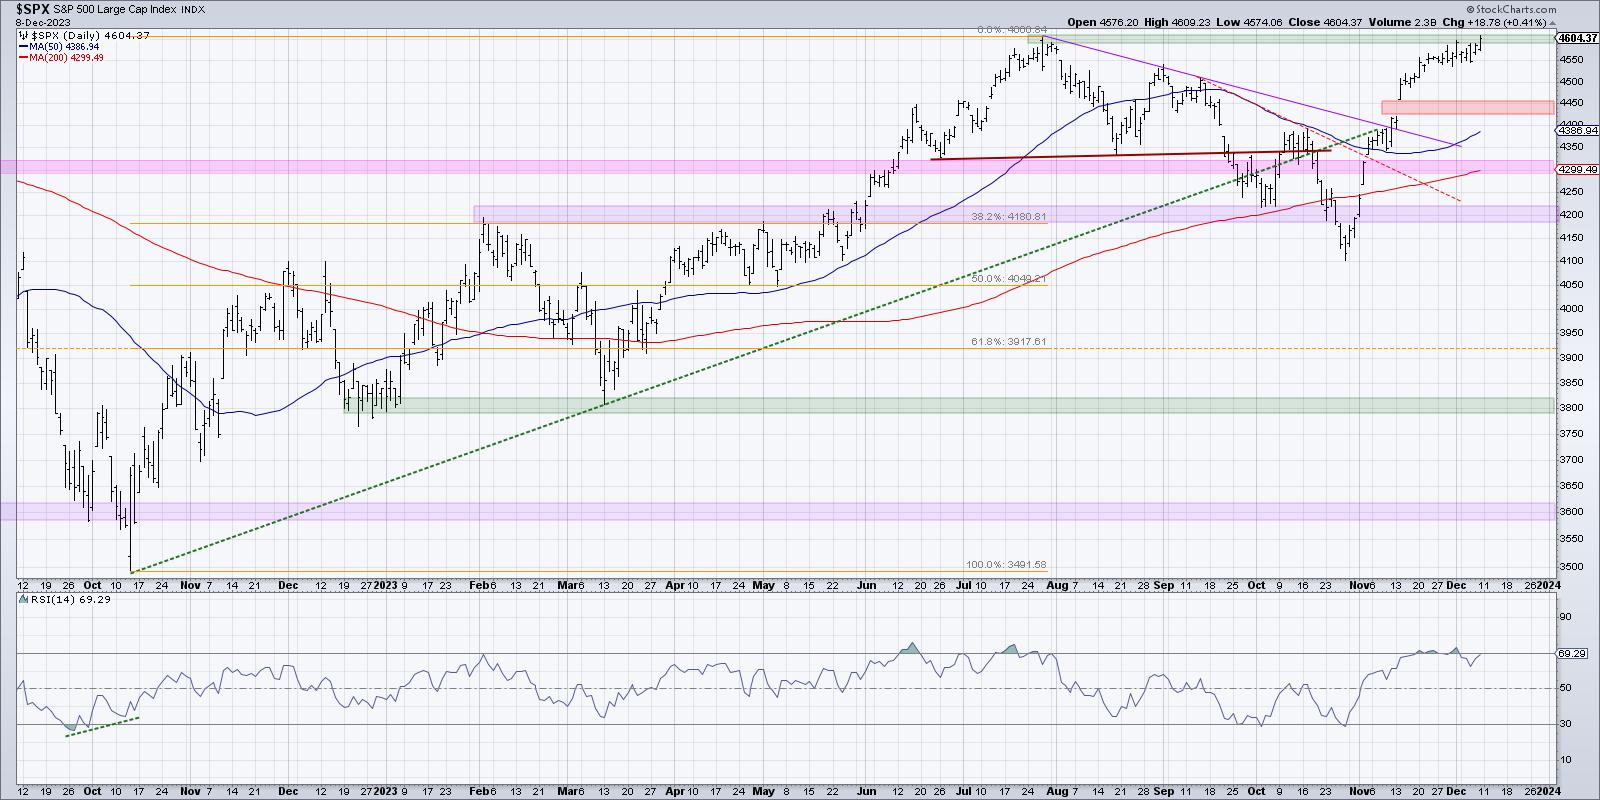
Breadth Analysis Suggests Pullback From S&P 4600
by David Keller,
President and Chief Strategist, Sierra Alpha Research
In this edition of StockCharts TV'sThe Final Bar, Dave reviews the latest market breadth indicators, some of which are indicating a likely pullback from resistance around the 4600 level for the S&P 500. He also focuses on stocks with actionable patterns including GOOGL, NFLX, SPOT, NVDA,...
READ MORE
MEMBERS ONLY
A NEW ERA of Growth Leadership?
by David Keller,
President and Chief Strategist, Sierra Alpha Research
In this edition of StockCharts TV'sThe Final Bar, guest Mary Ann Bartels of Sanctuary Wealth describes how falling interest rates could pave the way for another leadership by mega-cap growth stocks, including semiconductors. Host David Keller, CMT breaks down two market breadth indicators to watch into December and...
READ MORE
MEMBERS ONLY
Magnificent 7 Stocks Testing HUGE Resistance
by David Keller,
President and Chief Strategist, Sierra Alpha Research
In this edition of StockCharts TV'sThe Final Bar, Dave breaks down the technical setups on all of the Magnificent 7 stocks, addressing the balance between strong trends and overbought conditions. He answers viewer questions on investor sentiment, trailing stops, potential upside for TSLA, and the latest thinking on...
READ MORE
MEMBERS ONLY
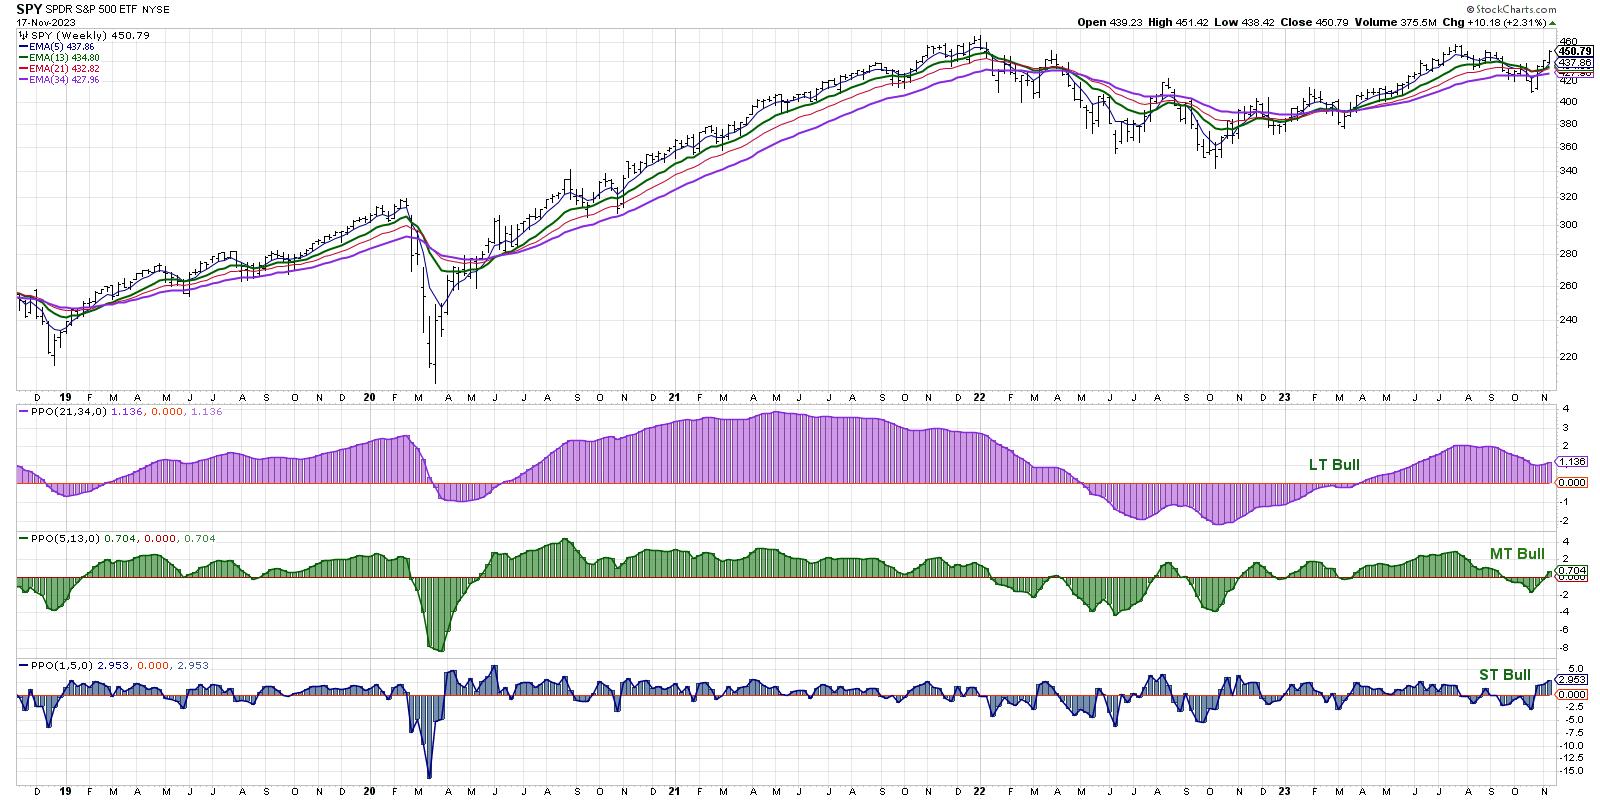
My Market Trend Model is Pretty Bulled Up
by David Keller,
President and Chief Strategist, Sierra Alpha Research
KEY TAKEAWAYS
* We use a series of weekly exponential moving averages to define the trend on three time frames.
* The medium-term model just turned bullish, suggesting a risk-on environment for stocks.
* Our Market Trend Model had a similar setup in March 2022, before a downturn eliminated the bullish configuration.
Am...
READ MORE
MEMBERS ONLY
Cutting-Edge Seasonality Insights & Bitcoin 2024 Halving Impact
by David Keller,
President and Chief Strategist, Sierra Alpha Research
In this special edition of StockCharts TV'sThe Final Bar, guest Adrien Zduńczyk, CMT, of The Birb Nest shares a groundbreaking seasonality study he created with Jeff Hirsch ofStock Trader's Almanac. Adrien and Dave explain how November and December tend to be seasonably strong for Bitcoin, why...
READ MORE