MEMBERS ONLY
Bear Market Rules Refresher
by Erin Swenlin,
Vice President, DecisionPoint.com
I spent a good portion of my Wednesday webinar, DecisionPoint LIVE! discussing "Bear Market Rules". Given the Dow has now officially entered a bear market (50-EMA cross below the 200-EMA) and other indexes preparing to follow, I thought it would be an excellent time for a refresher for...
READ MORE
MEMBERS ONLY
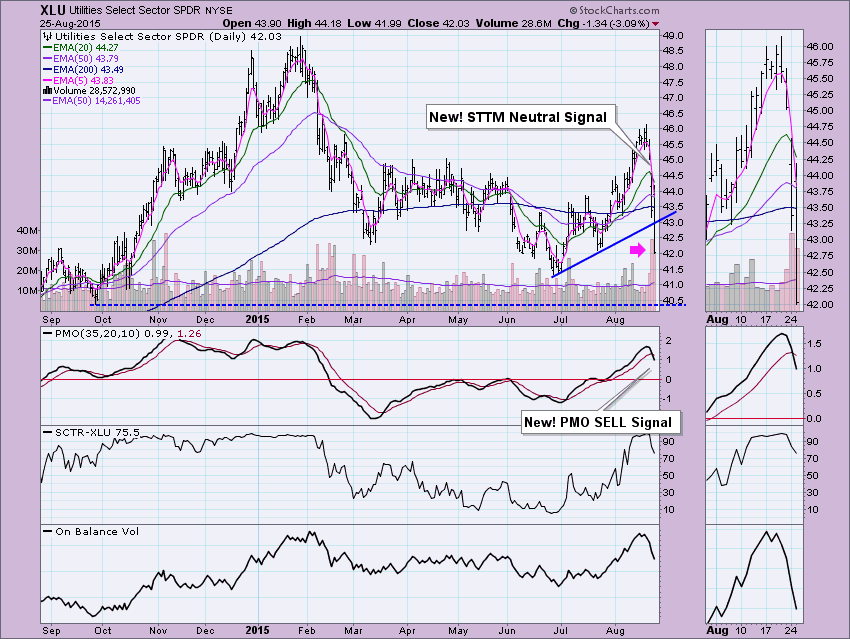
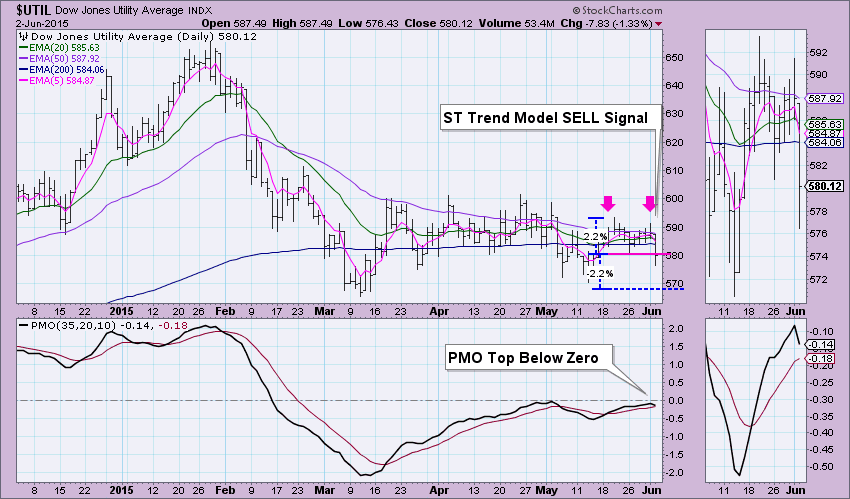
Utilities Washing Out
by Erin Swenlin,
Vice President, DecisionPoint.com
I receive technical alerts whenever there are DecisionPoint signal changes on the ETFs and Indexes that we cover in the DecisionPoint Market/Sector Summary. Today, while there were only a few, they were centered around the Utilities sector. The two utilities ETFs that we cover are the Utilities SPDR (XLU)...
READ MORE
MEMBERS ONLY
DecisionPoint Sentiment Charts Illustrate Bulls are Backing Down
by Erin Swenlin,
Vice President, DecisionPoint.com
There are many sources that DecisionPoint uses to develop the DP Sentiment charts. You'll find two of them in the free DecisionPoint Gallery: American Association of Individual Investors (AAII) Sentiment and Rydex Asset Ratio. I'm going to review the AAII, National Association of Active Investment Managers...
READ MORE
MEMBERS ONLY
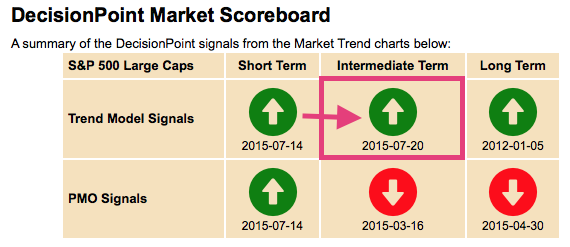
OEX Generates IT Trend Model Neutral - NDX Last One Standing
by Erin Swenlin,
Vice President, DecisionPoint.com
The DecisionPoint Scoreboard had an important signal change on the OEX. The DecisionPoint Trend Models have already triggered short-term Neutral and SELL signals on all four of the indexes we follow in our Scoreboard, but today, the OEX added an Intermediate-Term Trend Model (ITTM) Neutral signal. You'll note...
READ MORE
MEMBERS ONLY
Braided EMAs? Noisy PMO? Signal Ambiguities? DecisionPoint Market Barometers are the Cure!
by Erin Swenlin,
Vice President, DecisionPoint.com
Market action has been volatile but sideways. It's killing our shorter-term indicators and timing models. The DecisionPoint Trend Model generates BUY/SELL/Neutral signals based on the position of the 5/20/50/200-EMAs. When the EMAs have a thin margin between each other, the STTM, and even...
READ MORE
MEMBERS ONLY
Neutral! SELL! DecisionPoint Scoreboard Flip-Flops
by Erin Swenlin,
Vice President, DecisionPoint.com
This week the $SPX has been flip-flopping more than a sleazy politician. The Short-Term Trend Model (STTM) went from a BUY on Monday to Neutral on Tuesday to a BUY on Wednesday and today to a SELL signal. Ugh. There was a difference today. The STTM SELL signal on the...
READ MORE
MEMBERS ONLY
Taking a Byte Out of Apple
by Erin Swenlin,
Vice President, DecisionPoint.com
I'm sorry I simply couldn't resist the pun. Tom and Greg always seem to be having all the fun with their "punny" headlines so it's my turn. Apple could be entering correction mode. The question is whether it is only a short-term...
READ MORE
MEMBERS ONLY
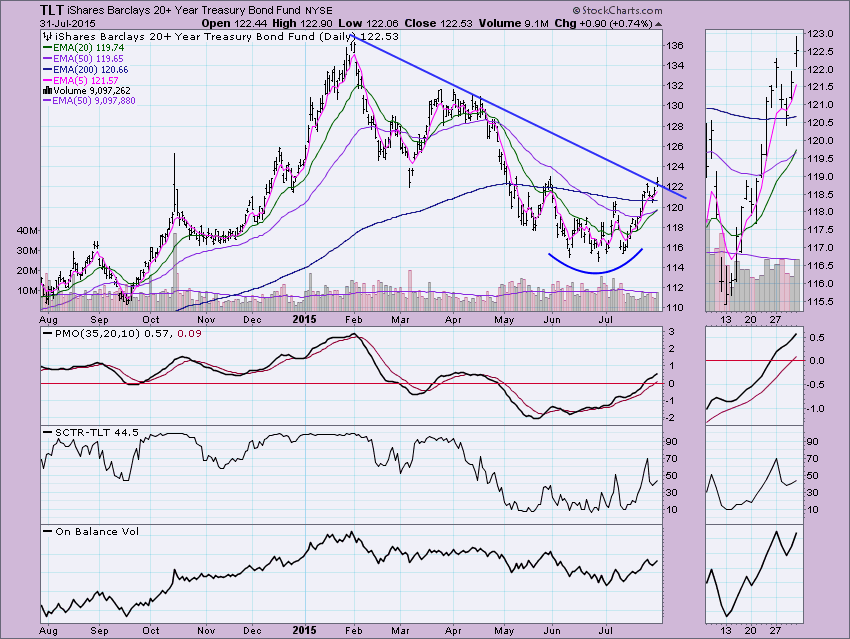
20-Year Treasuries ETF (TLT) Forms a Bullish Reversal Pattern
by Erin Swenlin,
Vice President, DecisionPoint.com
With the new Intermediate-Term Trend Model (ITTM) BUY signal on TLT and the breakout for the second time above the March low, I decided it was definitely time to abort the bearish Adam and Eve double-top pattern that I have been watching in earnest. Instead, I'm now seeing...
READ MORE
MEMBERS ONLY
What's Up with the Dow? Is it Leading or Lagging?
by Erin Swenlin,
Vice President, DecisionPoint.com
If you check out the DP Chart Gallery Scoreboards, you'll see that the picture for the Dow Industrials is bearish while the other indexes (SPX, NDX and OEX) are looking much more bullish. The question becomes, are the Dow Industrials lagging or will they lead the market lower?...
READ MORE
MEMBERS ONLY
Thrust and Parry Revisited
by Erin Swenlin,
Vice President, DecisionPoint.com
I recently received an email from one our DecisionPoint veterans who followed us in our early years. He asked about the Thrust/Trend Model (T/TM) which we used to employ instead of the Trend Model to determine our timing signals. Before we moved to StockCharts.com, Carl opted out...
READ MORE
MEMBERS ONLY
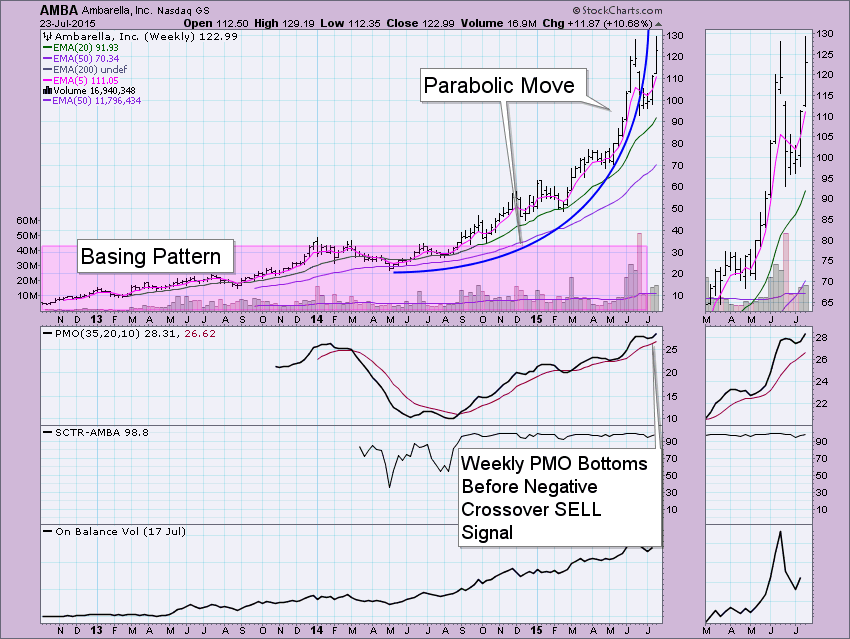
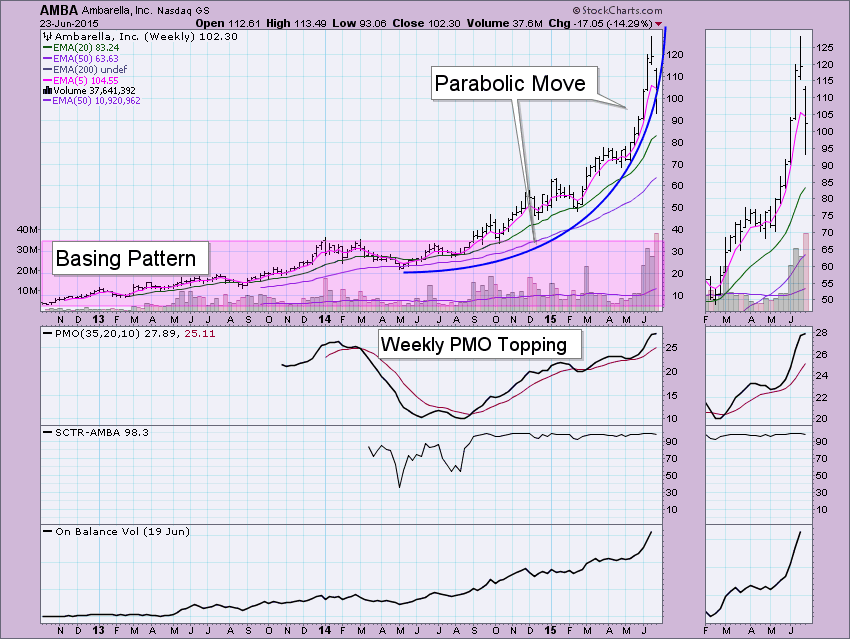
Ambarella (AMBA) Resolves Upward After Parabolic Breakdown
by Erin Swenlin,
Vice President, DecisionPoint.com
My obsession with this stock has not abated. It was one of the more "fun" stocks I've owned in a long time, so I keep revisiting it. After having ridden the parabolic move higher, I, like many, was wiping my brow and letting out a long...
READ MORE
MEMBERS ONLY
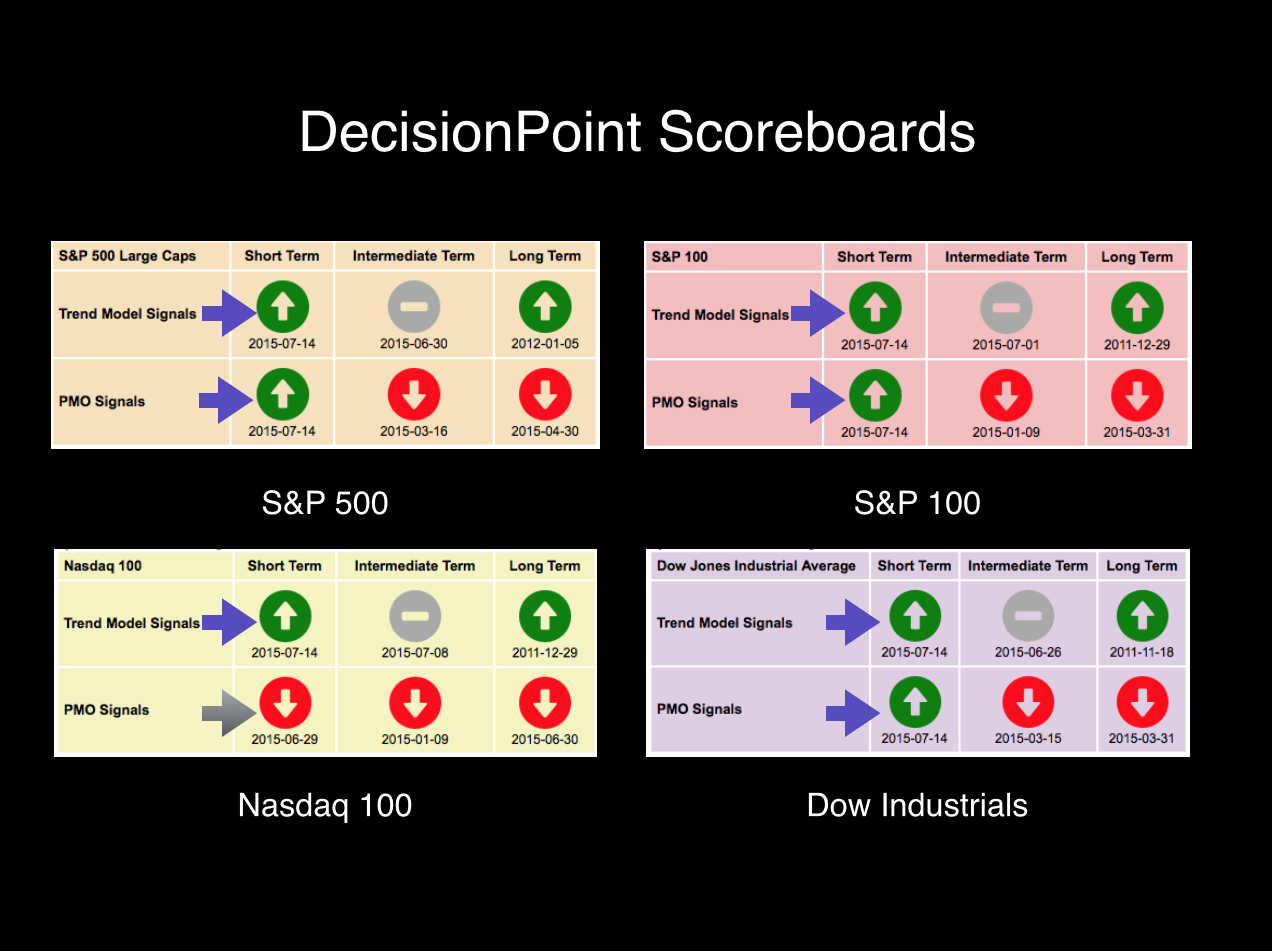
$SPX Puts New ITTM BUY Signal on DecisionPoint Scoreboard
by Erin Swenlin,
Vice President, DecisionPoint.com
It's nice to be back from vacation (if you call driving your daughter from Auburn, AL to California with a trailer attached to a small compact car in three days, a vacation) and see the market begin to make all-time highs again. Today we had a DecisionPoint Scoreboard...
READ MORE
MEMBERS ONLY
DP Scoreboard Flips Out!! Short-Term Signals Turn Bullish
by Erin Swenlin,
Vice President, DecisionPoint.com
I will admit to you that when I get the Technical Alert emails from the StockCharts.com ScanEngine regarding changes for all of the DP Sector ETFs and Indexes we follow in the DP Market/Sector Summary, I cringe a little. I'm excited to know the changes but...
READ MORE
MEMBERS ONLY
"Hangers-On" - The Last BUY Signals
by Erin Swenlin,
Vice President, DecisionPoint.com
As I perused the DecisionPoint Market/Sector Summary found in the DP Reports blog, I noticed that there are still some very old Intermediate-Term Trend Model (ITTM) BUY signals. I wrote in my last DecisionPoint blog article, "DP Scoreboard, Market/Sector Summary and Participation Suggest Internal Weakness", that...
READ MORE
MEMBERS ONLY
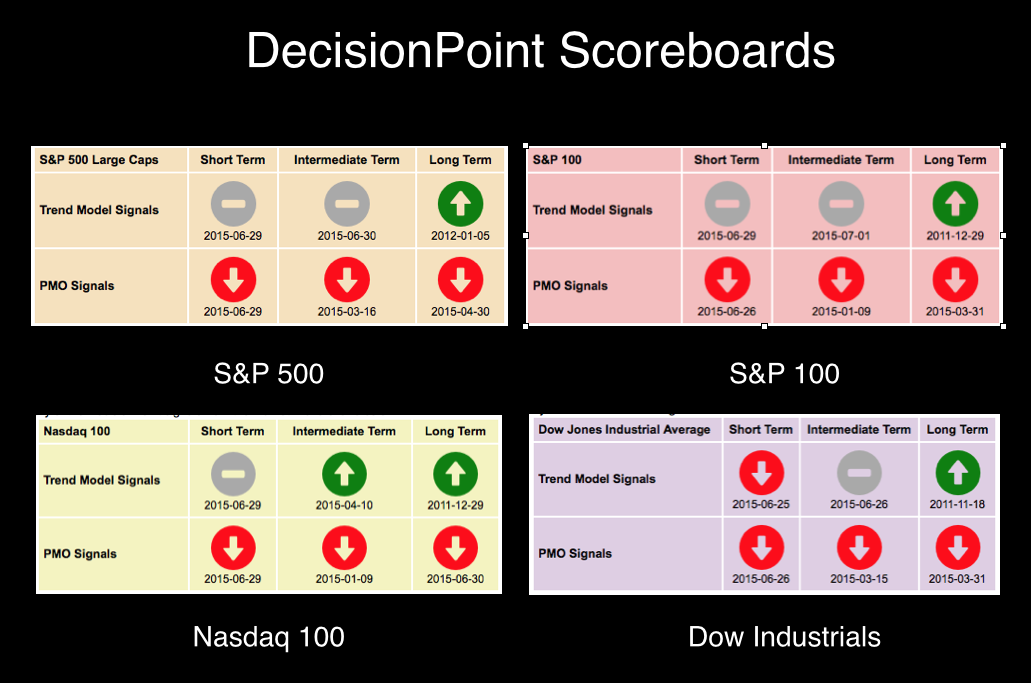
DP Scoreboard, Market/Sector Summary and Participation Suggest Internal Weakness
by Erin Swenlin,
Vice President, DecisionPoint.com
The DecisionPoint Scoreboard, located in the DP Chart Gallery, has been slowly flipping signals. Similarly we have seen a flip of Intermediate-Term Trend Model (ITTM) signals to Neutral or SELL. Typically when we see this type of movement of signals it is a sign of internal weakness in the market...
READ MORE
MEMBERS ONLY
Long-Term PMO SELL Signal for NDX and Intermediate-Term Trend Model Neutral on SPX
by Erin Swenlin,
Vice President, DecisionPoint.com
There were two important signal changes in the DP Scoreboards in the DecisionPoint Chart Gallery. The NDX finally submitted to a long-term Price Momentum Oscillator (PMO) SELL signal. The other three in the gallery were already on long-term PMO SELL signals. Additionally, the Intermediate-Term Trend Model (ITTM) generated a Neutral...
READ MORE
MEMBERS ONLY
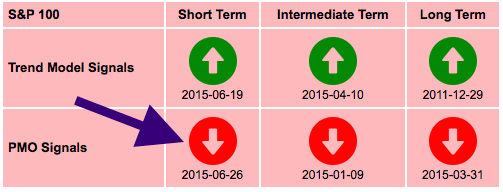
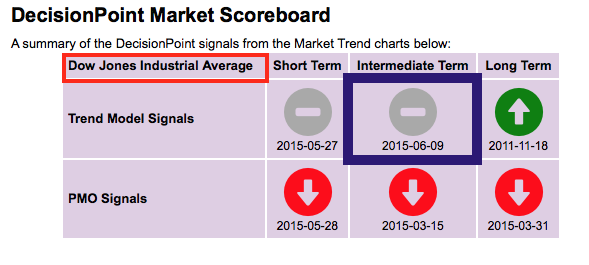
DP Scoreboard Update! $OEX, $INDU New PMO SELL Signals
by Erin Swenlin,
Vice President, DecisionPoint.com
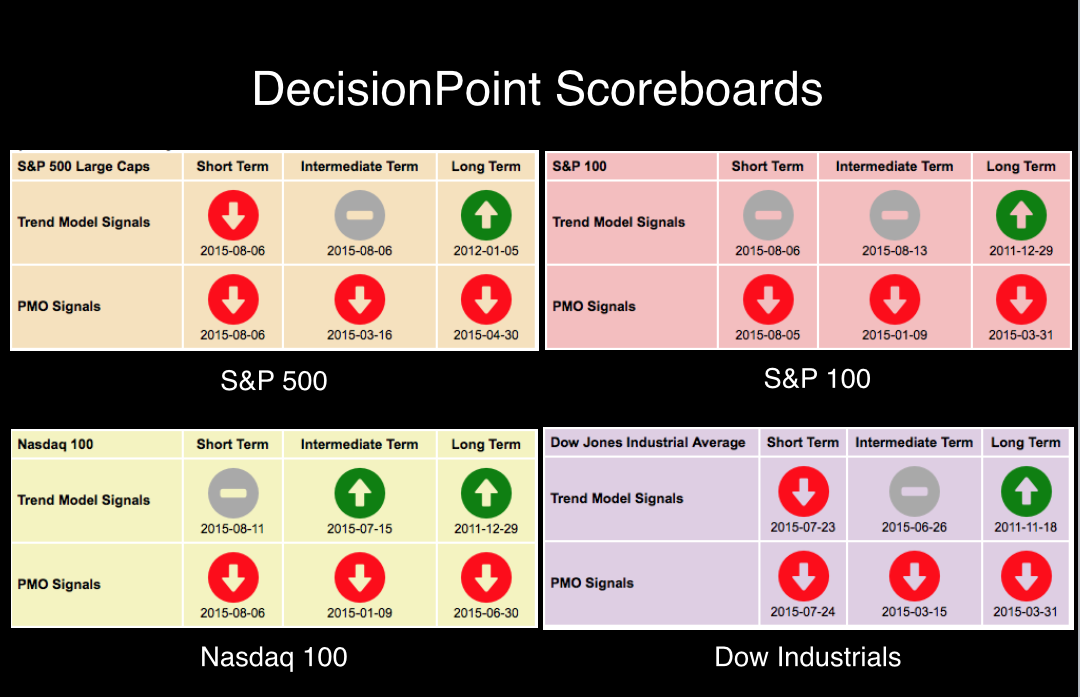
Just a quick article to alert you that we had some important DP Scoreboard Updates today. The S&P 100 and Dow Industrials both generated Price Momentum Oscillator (PMO) SELL signals. Additionally, the Dow had a Short-Term Trend Model (STTM) and Intermediate-Term Trend Model (ITTM) Neutral signals update. Here...
READ MORE
MEMBERS ONLY
Warning: DP Ultra-Short and Short-Term Indicators Display Very Bearish Readings
by Erin Swenlin,
Vice President, DecisionPoint.com
In today's DecisionPoint Alert, I warned of very bearish readings appearing on our shorter-term indicators. When these indicators get very elevated readings in either direction, it is an attention getter. Climactic readings, as we call them at DP, can be an indication of an "exhaustion" of...
READ MORE
MEMBERS ONLY
Parabolic FAIL for Ambarella (AMBA)?
by Erin Swenlin,
Vice President, DecisionPoint.com
Did I not mention in my previous article "Picture Perfect: Ambarella" that AMBA was in a "jinx" situation or possible sentiment trap? It appears the cash cow is dying. Yes, it was up over 8% today, but it was down nearly 20% yesterday. Carl and I...
READ MORE
MEMBERS ONLY
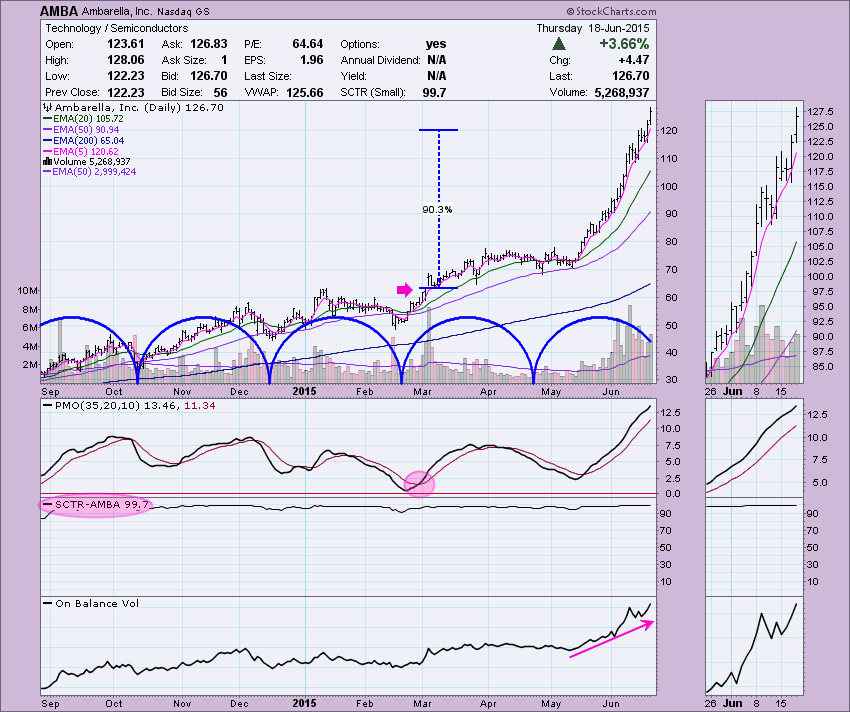
AMBA Scan Revealed - Webinar Charts from 6/17
by Erin Swenlin,
Vice President, DecisionPoint.com
I have received numerous blog comments, emails, etc. asking me to publish the scan that I used to find Ambarella back in February. First, as far as making this stock pick, I told one subscriber that it's nice to get lucky on top of being smart! However, this...
READ MORE
MEMBERS ONLY
Picture Perfect: Ambarella (AMBA)
by Erin Swenlin,
Vice President, DecisionPoint.com
News has been picking up on a once little known company, Ambarella, Inc. (AMBA). For those unfamiliar, AMBA is a leading developer of low-power, high-definition (HD) and Ultra HD video compression and image processing solutions. The company’s products are used in a variety of professional and consumer applications including...
READ MORE
MEMBERS ONLY
Scanning the DecisionPoint Way - June 10th Webinar Scan Revisited
by Erin Swenlin,
Vice President, DecisionPoint.com
Yesterday during the DecisionPoint LIVE! webinar (link here), I demonstrated how to 'pick' stocks the DecisionPoint way using the Scanning Workbench available to Extra, ExtraRT and Pro members. I've created quite a few different scans that take advantage of the DecisionPoint Price Momentum Oscillator (PMO) and...
READ MORE
MEMBERS ONLY
New Intermediate-Term Neutral Signal on the Dow Industrials
by Erin Swenlin,
Vice President, DecisionPoint.com
A subscriber recently wrote to me questioning why I had written and changed the signal on the $SPX Scoreboard to neutral yesterday, but it wasn't on the most recent DecisionPoint Market/Sector Summary. This is because DecisionPoint timing signals that are tracked by the professional publication, Timer Digest,...
READ MORE
MEMBERS ONLY
DP Scoreboards Detect Market Deterioration
by Erin Swenlin,
Vice President, DecisionPoint.com
If you haven't checked out the new DP Scoreboard in the DP Chart Gallery, I highly recommend you click over there soon. In fact, here is an article I wrote about the Scoreboard and how the signals are determined right here. For those of you who are very...
READ MORE
MEMBERS ONLY
Plethora of Short-Term Trend Model Neutral Signals
by Erin Swenlin,
Vice President, DecisionPoint.com
In my last article, I explained how I set up StockCharts.com Technical Alerts to email me when any Trend Model or Price Momentum Oscillator (PMO) signal changes occur. I started it so that I could keep our DP Scoreboard up to date, but I'm finding it to...
READ MORE
MEMBERS ONLY
Short-Term Trend Model SELL on $UTIL and BUY on $SML
by Erin Swenlin,
Vice President, DecisionPoint.com
I'm alerted whenever there is a Short-Term Trend Model signal change on the major indexes. In fact, I downloaded the "StockCharts Essentials" ChartPack and I run my alerts on the "1010 Essential Major Market Indexes" ChartList in particular. The alert scan is included below:...
READ MORE
MEMBERS ONLY
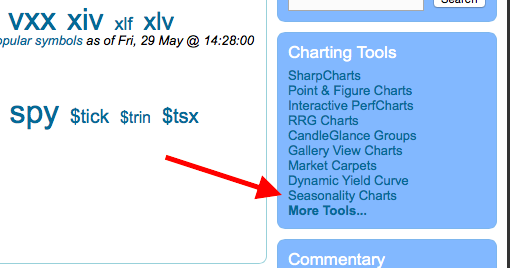
What Does the Seasonality Tool Say About "Sell in May, Go Away"?
by Erin Swenlin,
Vice President, DecisionPoint.com
Everyone is bandying around the term, "Sell in May, Go Away". But how true is it? Given we are seeing bearish patterns on the SPY, overhead resistance has held on strongly, long-term indicators are bearish and it's the end of May; it makes sense that the...
READ MORE
MEMBERS ONLY
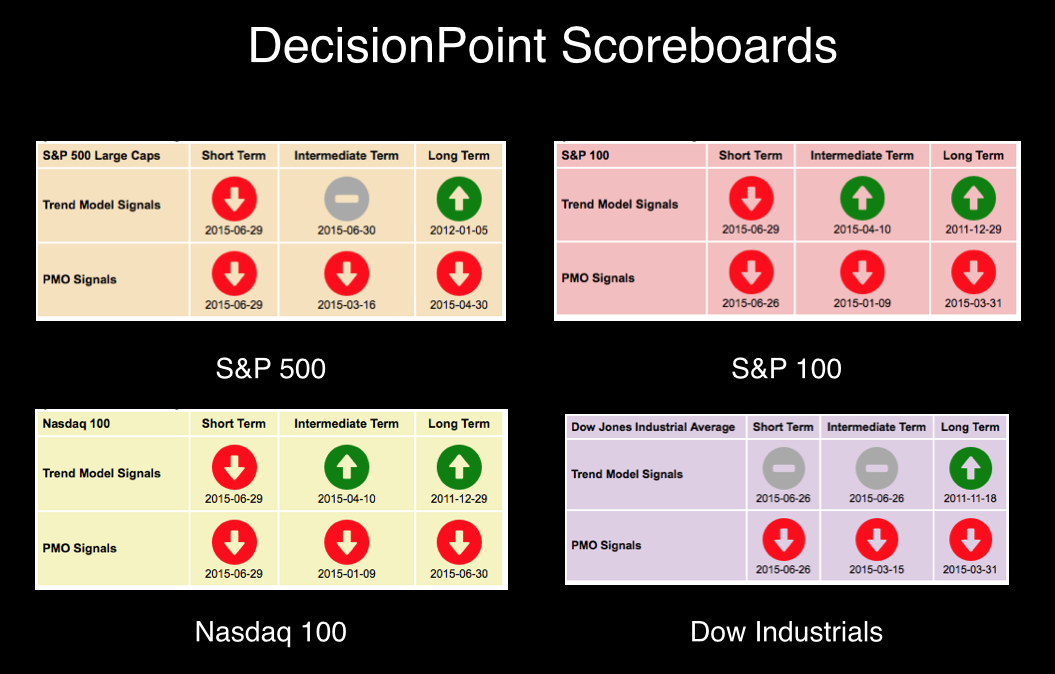
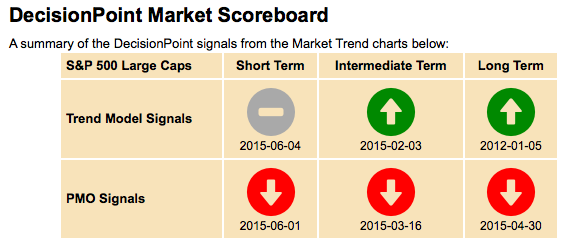
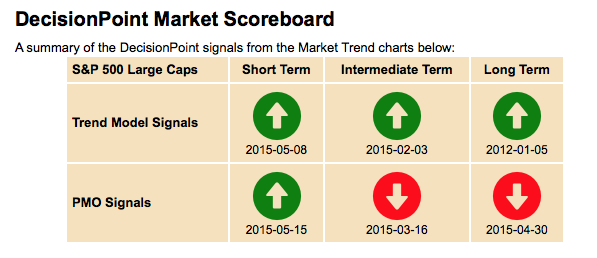
Check Out the NEW DP Scoreboard in the DP Chart Gallery!
by Erin Swenlin,
Vice President, DecisionPoint.com
We gave our webinar viewers a sneak peek at the new scoreboard and now it is LIVE! A picture of the SPX scoreboard is below:
For members, there is a drop-down menu on the side where you can switch between the NDX, OEX and DJIA. You'll find the...
READ MORE
MEMBERS ONLY
Small Caps Get On Board with PMO BUY Signals
by Erin Swenlin,
Vice President, DecisionPoint.com
I noticed today in the DP Reports paid blog that IJR, the S&P 600 ETF, generated a Price Momentum Oscillator (PMO) BUY signal on the DecisionPoint Market/Sector Summary Report. So I followed the rabbit down the hole and decided to check the iShares Russell 2000 ETF, IWM...
READ MORE
MEMBERS ONLY
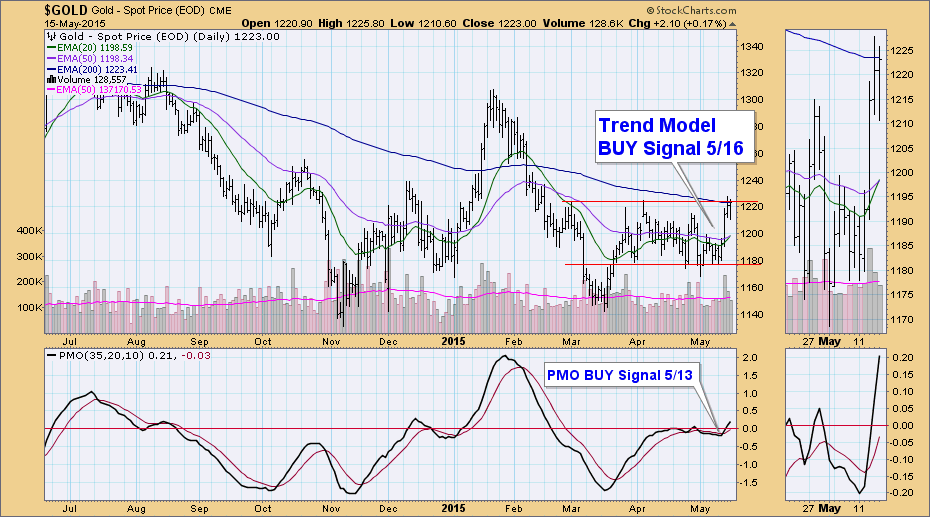
Trend Model Joins PMO with BUY Signal on Gold
by Erin Swenlin,
Vice President, DecisionPoint.com
As of 5/16/2015 Gold is on a Trend Model BUY signal. The 20-EMA crossed above the 50-EMA triggering the new intermediate-term Trend Model to initiate a BUY signal. The long-term Trend Model, which informs our long-term outlook, is on a SELL signal as of 2/15/2013, so...
READ MORE
MEMBERS ONLY
Five Blogs I Subscribe to that You Should Too!
by Erin Swenlin,
Vice President, DecisionPoint.com
Don't get me wrong, EVERY blog on StockCharts.com is brilliant, but when my time is limited, there are five blogs that I make a point NEVER to miss! How can I make sure that I know right away when those blogs contain a new article? I click...
READ MORE
MEMBERS ONLY
Announcing the NEW DecisionPoint Alert Blog!
by Erin Swenlin,
Vice President, DecisionPoint.com
Back by popular demand and reinvented, the DP Daily Market Updates will return in theNEW "DecisionPoint Alert Blog". The free "DecisionPoint" Blog will continue as before with feature articles by both me and Carl. The new content-rich "DecisionPoint Alert" blog will only be available...
READ MORE
MEMBERS ONLY
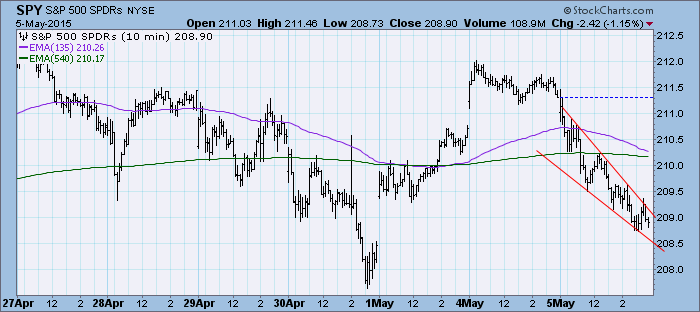
DP Market Update: All-Time Highs Prove Difficult to Achieve - May 5, 2015
by Erin Swenlin,
Vice President, DecisionPoint.com
Price snapped back toward the Friday low today. It appeared at the end of the day it might break out from the descending wedge. It's a bullish formation so that is the expectation. A wedge tells us the direction to expect a move. Unfortunately, it doesn't...
READ MORE
MEMBERS ONLY
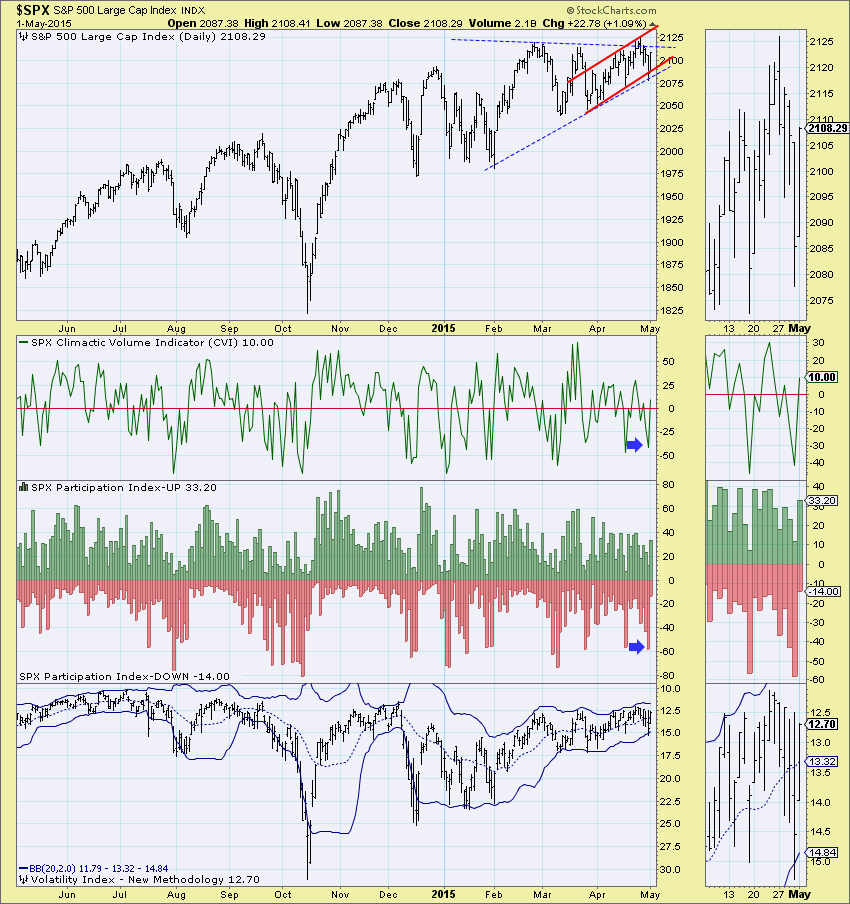
Ultra-Short Term Spikes Bullish
by Erin Swenlin,
Vice President, DecisionPoint.com
Last week was not only an interesting for price, ultra-short-term indicators finally woke up. With indicators staying mostly mum this week, it was exciting to see movement in the shorter-term.
Below is a chart of our ultra-short-term indicators taken from the DP Chart Gallery (available free here). When observing our...
READ MORE
MEMBERS ONLY
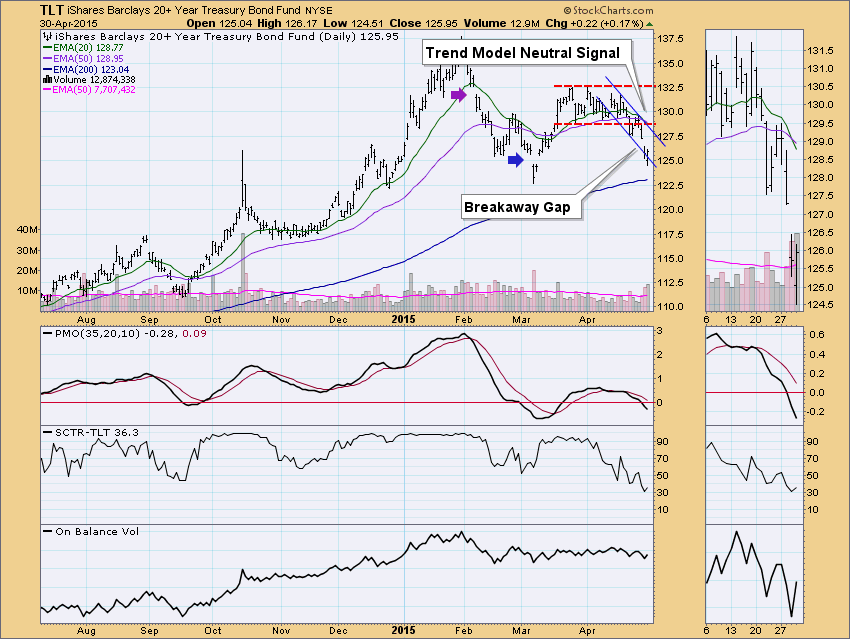
Bonds (TLT) Generate Trend Model Neutral Signal on Breakaway Gap
by Erin Swenlin,
Vice President, DecisionPoint.com
Yesterday an Intermediate-Term Trend Model Neutral signal was generated on TLT, the ETF we use to calculate our official Trend Model signal. This combined with a breakdown from the congestion zone and a what appears to be a breakaway gap tells us there is likely more downside to come for...
READ MORE
MEMBERS ONLY
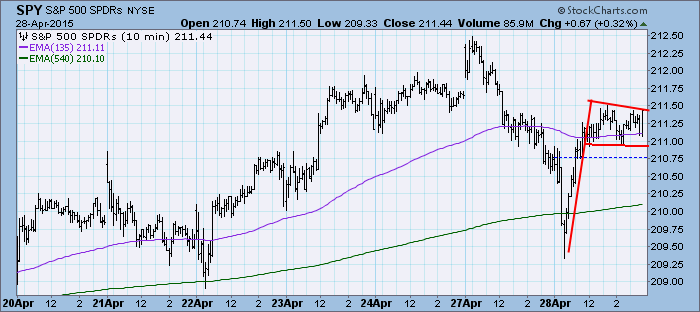
DP Market Update: Tiny Breakout from Bullish Ascending Triangle - April 28, 2015
by Erin Swenlin,
Vice President, DecisionPoint.com
It was a volatile morning but price consolidated in the afternoon, resting as investors contemplate upcoming news from the Fed on Wednesday. Yesterday, price disintegrated. It appeared this morning as if the market planned on continuing into a strong correction; however, upon reaching support near Wednesday's low, it...
READ MORE
MEMBERS ONLY
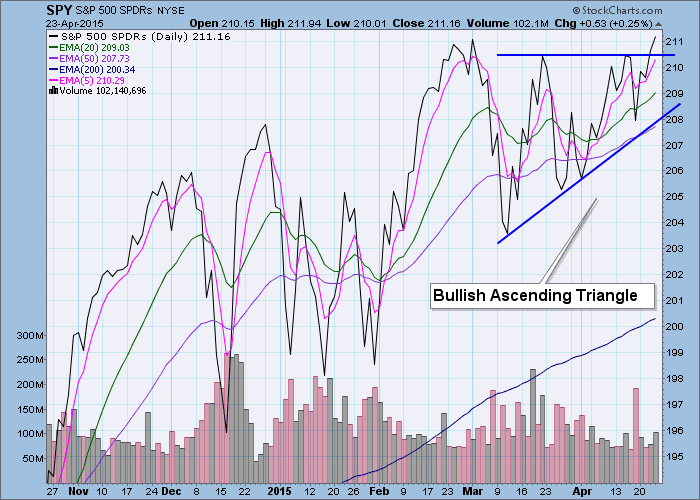
What's the Difference Between an Ascending Wedge and an Ascending Triangle?
by Erin Swenlin,
Vice President, DecisionPoint.com
I recently received a question from one of the attendees of yesterday's webinar (recording available here). I was reviewing the charts in our DP Chart Gallery as well as symbol requests and often referred to ascending triangle patterns and ascending wedge patterns. Here is the question:
"Erin....
READ MORE
MEMBERS ONLY
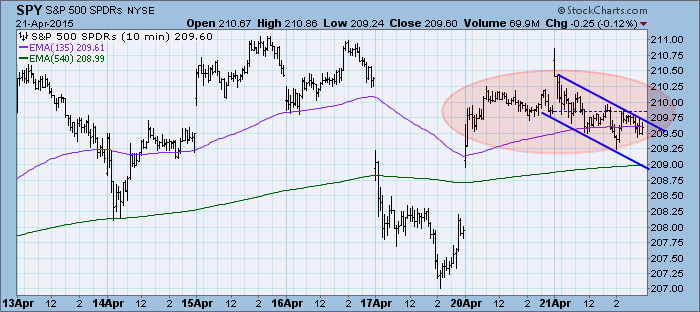
DP Market Update: Trend Model BUY Signal on USO - April 21, 2015
by Erin Swenlin,
Vice President, DecisionPoint.com
The market has been in a continuation pattern as price consolidates. Of possible interest is the ultra-short-term declining trend channel, I'm curious how it will resolve.
The purpose of the DecisionPoint Daily Update is to quickly review the day's action, internal condition, and Trend Model status...
READ MORE
MEMBERS ONLY
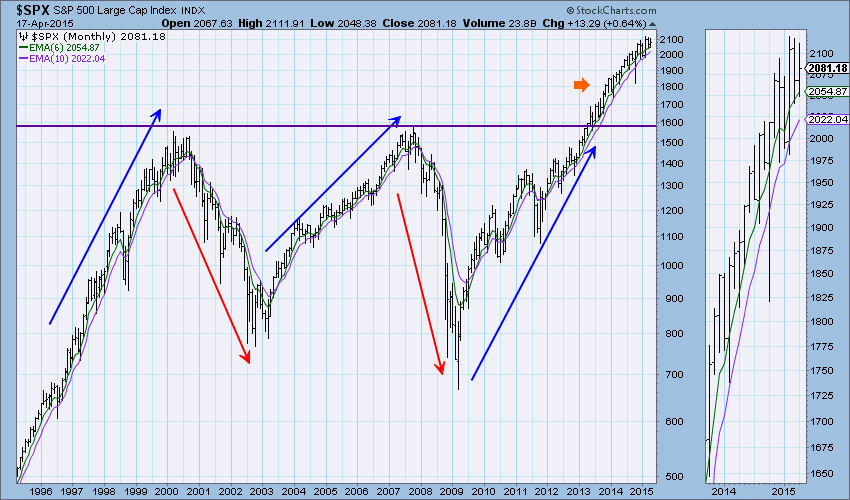
Cycle Chart from Last Week's DecisionPoint LIVE! Webinar
by Erin Swenlin,
Vice President, DecisionPoint.com
Carl presented his chart that illustrates typical market cycles at our DecisionPoint LIVE! Webinar last Wednesday (Here is a link to that broadcast). (P.S. Don't miss the next episode! Watch for the link on the homepage this week under "What's New"') As...
READ MORE
MEMBERS ONLY
Now is it a Triple-Top?
by Erin Swenlin,
Vice President, DecisionPoint.com
Carl always told me that usually when bloggers state a question as the title of their blog, they never end up answering it. I plan on answering the question. We know that technical analysis is not a science, it is an art. Meaning that two people can look at the...
READ MORE