MEMBERS ONLY
WHY Some Make Forecasts
by Greg Morris,
Veteran Technical Analyst, Investor, and Author
Why are there entire businesses setup to make forecasts? The answer is quite simple; forecasting exists because there is a giant market for it. Investors/traders thirst for forecasts. Here is the real question; why do investors want to hear/read forecasts?
“Those who have knowledge don’t predict. Those...
READ MORE
MEMBERS ONLY
WHY Price is so Important
by Greg Morris,
Veteran Technical Analyst, Investor, and Author
I often hear technical analysts performing their craft on economic data, derivative data such as the AD line, and a host of other data sets that do not trade. Why would you do that? The most basic premise of technical analysis is PRICE, the price that is determined in the...
READ MORE
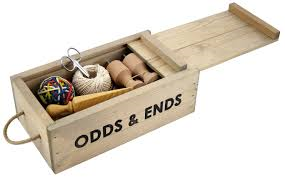
MEMBERS ONLY
Odds and Ends
by Greg Morris,
Veteran Technical Analyst, Investor, and Author
Webster defines Odds and Ends as different kinds of things that are usually small and unimportant. I would prefer to define them as sort of important. I’ll use this format for issues that I cannot justify an entire article on. So expect Odds and Ends II at some point....
READ MORE
MEMBERS ONLY
WHY Technical Analysis Works
by Greg Morris,
Veteran Technical Analyst, Investor, and Author
From the dictionary: Why – a noun - a reason or explanation.
I’m going to write a few articles on why technical analysis is valuable – I’m calling it the WHY series. I spent 15 years in front of advisors at the large wire houses and insurance companies selling them...
READ MORE
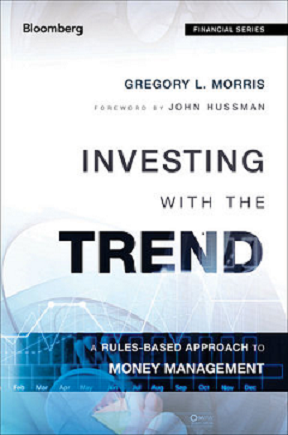
MEMBERS ONLY
Investing with the Trend
by Greg Morris,
Veteran Technical Analyst, Investor, and Author
Warning! This is a sales pitch for my latest and last book, Investing with the Trend. Instead of hearing from me, I have included a few actual reviews from readers. I basically tell people that I dumped 40+ years of experience in this book. There are many things in this...
READ MORE
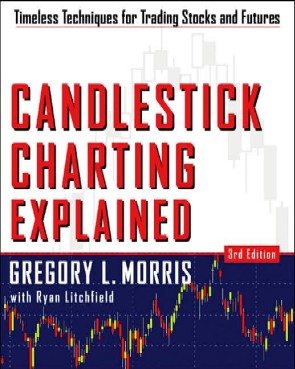
MEMBERS ONLY
Candlestick Analysis - Putting it All Together
by Greg Morris,
Veteran Technical Analyst, Investor, and Author
Here we are at the end of the Candlestick Analysis series; hopefully a few of you are still with me. I’m going to show in this article the process I would use to incorporate candle patterns into my trading even though I am no longer a trader; not sure...
READ MORE
MEMBERS ONLY
Candlestick Analysis - Performance
by Greg Morris,
Veteran Technical Analyst, Investor, and Author
The following tables of data reflect the performance of 14 different technical indicators using the perceived popular parameters for each one (see Table A). However, each table uses a different setting for analyzing the candle patterns. The success or failure of a candle pattern is determined by the price relative...
READ MORE
MEMBERS ONLY
Candlestick Analysis - Filtering
by Greg Morris,
Veteran Technical Analyst, Investor, and Author
Candle pattern filtering offers a method of trading with candlesticks that is complemented by other popular technical tools for analysis. Filtering is a concept that has been used in many other forms of technical analysis and is now a proven method with candle patterns.
Since any one indicator on its...
READ MORE
MEMBERS ONLY
Know Thyself II
by Greg Morris,
Veteran Technical Analyst, Investor, and Author
The first article on Know Thyself generated a lot of interest, so here is the second one. Welcome to being human! Do you really know that person you see while shaving or applying makeup? If you are going to be a successful investor/trader, you better get to know him/...
READ MORE
MEMBERS ONLY
Candlestick Analysis - Statistics III
by Greg Morris,
Veteran Technical Analyst, Investor, and Author
Additional information in regard to the determination of the suitability of candle patterns is to look at the Net Profit divided by the Net Loss per Trade. This would be a measure of the overall profitability of candle patterns based upon the prediction interval. Table A shows this data with...
READ MORE
MEMBERS ONLY
Article Summaries 12-2015 to 3-2016
by Greg Morris,
Veteran Technical Analyst, Investor, and Author
Most blog authors on StockCharts.com are writing about the current markets and do an exceptional job. I do not write about the current markets as I wanted to share my experiences after 40+ years as a technical analyst. Not only experiences with trading and investing, but model building and...
READ MORE
MEMBERS ONLY
Candlestick Analysis - Statistics II
by Greg Morris,
Veteran Technical Analyst, Investor, and Author
Candle patterns are predictable psychological trading pictures (windows) that produce reasonable forecasting results when used in the proper manner. This article will explain the technique used to determine the various statistics developed to show the success of candle patterns. Note that no magnitude of success is used, only a relative...
READ MORE
MEMBERS ONLY
Candlestick Analysis - Statistics I
by Greg Morris,
Veteran Technical Analyst, Investor, and Author
The candle pattern statistics in Table A below show the amount of data used in this analysis, the type of data used, and various other pertinent statistics. All common stocks on the New York Stock Exchange, the Nasdaq market, and the American Stock Exchange were used over a 13-year period....
READ MORE
MEMBERS ONLY
Are Mutual Fund Statistics in the Dark Ages?
by Greg Morris,
Veteran Technical Analyst, Investor, and Author
Since the dawning of the Internet in the early 1990s, investors now have access to volumes of data and statistics that were only reserved for a select group before. There are some things you need to know about financial data that is readily available for your use. There are some...
READ MORE
MEMBERS ONLY
Candlestick Analysis - Recognition Reliability
by Greg Morris,
Veteran Technical Analyst, Investor, and Author
Using the pattern identification philosophy developed in the previous article on Pattern Identification, one can now adapt a method of determining just how successful candle patterns are? The techniques I used are quite analytical and I find they are somewhat difficult to explain, so here goes.
Measures of Success
The...
READ MORE
MEMBERS ONLY
Candlestick Analysis - Pattern Identification
by Greg Morris,
Veteran Technical Analyst, Investor, and Author
All books on candlesticks offer detailed descriptions of the relationships among the open, high, low, and close. They also deal with the concepts of trend determination which I did in the previous article; while this article focuses on pattern identification. In addition, a method of determining long days, short days,...
READ MORE
MEMBERS ONLY
Candlestick Analysis - Trend Determination
by Greg Morris,
Veteran Technical Analyst, Investor, and Author
In the first few minutes of the trading day, a great deal of overnight emotion is captured. Sometimes special events cause chaos. For example, on the New York Stock Exchange it may take several minutes for the market maker (used to be a specialist) to open a stock for trading...
READ MORE
MEMBERS ONLY
Secular Bulls
by Greg Morris,
Veteran Technical Analyst, Investor, and Author
This is a complementary article to Secular Bears that I wrote on May 14, 2015. To be perfectly honest (that is how someone usually leads into telling a lie) I planned on doing this article shortly after the first one and totally forgot. Secular Bulls and Secular Bears is terminology...
READ MORE
MEMBERS ONLY
Candlestick Analysis
by Greg Morris,
Veteran Technical Analyst, Investor, and Author
In 1988 I attended a Market Technician’s Association (MTA) meeting in Phoenix at the Camelback Inn. There were two wonderful highlights that occurred at that meeting: one was an introduction to Japanese candle pattern analysis/charting, and the other was meeting Ian McAvity who published Deliberations newsletter for over...
READ MORE
MEMBERS ONLY
Blinded by the Noise
by Greg Morris,
Veteran Technical Analyst, Investor, and Author
I’ve discussed noise a few times in the past but it needs to be brought up again. Just in the course of a normal week, we are bombarded with information from sources such as the FED, television analysts, brokerage firm analysts, economists’ projections, newspapers, junk mail, neighbors, war reporters,...
READ MORE
MEMBERS ONLY
Fundamentally Flawed Analysis
by Greg Morris,
Veteran Technical Analyst, Investor, and Author
Literally hundreds of millions of dollars are spent each year on the analysis of individual securities by Wall Street brokerage firms and independent firms (Zacks, Hoovers, Value Line, etc). Most brokerage firms have a large staff of analysts, which make huge salaries, and are widely summoned to television shows each...
READ MORE
MEMBERS ONLY
Article Summaries 9-2015 to 11-2015
by Greg Morris,
Veteran Technical Analyst, Investor, and Author
Most blog authors on StockCharts.com are writing about the current markets and do an exceptional job. I do not write about the current markets as I want to share my experiences after 40+ years as a technical analyst. Not only experiences with trading and investing, but model building and...
READ MORE
MEMBERS ONLY
Deficient Frontier
by Greg Morris,
Veteran Technical Analyst, Investor, and Author
It is almost impossible to see any performance comparisons that not only show a benchmark, but also show a mix of 60% equity and 40% fixed income, known as 60/40 in the fund industry. The Efficient Frontier is one of those terms that came from a theory developed decades...
READ MORE
MEMBERS ONLY
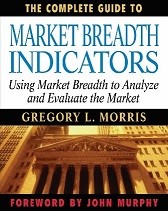
CGMBI-Non-Internal Breadth Indicators-Chap 11
by Greg Morris,
Veteran Technical Analyst, Investor, and Author
This is the final article highlighting the chapters and indicators in my new second edition of The Complete Guide to Market Breadth Indicators. This is a completely new chapter as I did not include non-internal breadth in the first edition; I stuck with internal breadth only. Don’t ask me...
READ MORE
MEMBERS ONLY
Article Summaries: 6-2015 to 8-2015
by Greg Morris,
Veteran Technical Analyst, Investor, and Author
Most blog authors on StockCharts.com are writing about the current markets and do an exceptional job. I do not write about the current markets as I wanted to share my experiences after 40+ years as a technical analyst. Not only experiences with trading and investing, but model building and...
READ MORE
MEMBERS ONLY
Benchmarking and Taxes
by Greg Morris,
Veteran Technical Analyst, Investor, and Author
Many funds/strategies are tied to a benchmark. In fact, I think most are tied to a benchmark. The goal of these managers is to try to beat the benchmark. Some do and most don’t; yet when the number beating or failing to beat the benchmark is usually not...
READ MORE
MEMBERS ONLY
A New Breadth of Fresh Air
by Greg Morris,
Veteran Technical Analyst, Investor, and Author
StockCharts.com has vastly updated not only its raw breadth database but now there are hundreds and hundreds of new market breadth indicators available to everyone. This is not really an article but an information piece about StockCharts.com’s vast amount of breadth material and where to find it;...
READ MORE
MEMBERS ONLY
CGMBI-Composite Indicators-Chap 9
by Greg Morris,
Veteran Technical Analyst, Investor, and Author
Before we being the review of Chapter 9 for the 2nd Edition of The Complete Guide to Market Breadth Indicators, I am proud to announce that after over a year of work with many of the fine folks at StockCharts.com, the book is now available in Kindle format from...
READ MORE
MEMBERS ONLY
Past Performance is no Guarantee of Future Results
by Greg Morris,
Veteran Technical Analyst, Investor, and Author
There is no doubt that investors are attracted by positive performance. Unfortunately, most investors stop there and never accomplish the due diligence to confirm that the returns are meaningful. In most cases they usually place entirely too much emphasis on performance without putting it into the context of the market...
READ MORE
MEMBERS ONLY
Article Summaries: 3-2015 to 5-2015
by Greg Morris,
Veteran Technical Analyst, Investor, and Author
Most blog authors on StockCharts.com are writing about the current markets and do an exceptional job. I do not write about the current markets as I wanted to share my experiences after 40+ years as a technical analyst. Not only experiences with trading and investing, but model building and...
READ MORE
MEMBERS ONLY
Up Volume Down Volume Indicators (Chap 8 - CGMBI)
by Greg Morris,
Veteran Technical Analyst, Investor, and Author
CH 8 Up Volume Down Volume Indicators
As a reminder these articles about the chapters in the upcoming book are only samples of what are in each chapter; they are not the entire chapter.
The breadth indicators in this section utilize either up volume, down volume, or both in their...
READ MORE
MEMBERS ONLY
A Different Perspective on Standard Deviation
by Greg Morris,
Veteran Technical Analyst, Investor, and Author
Warning: This article is for nerds only!
I have often stated that Standard Deviation (Sigma) is an inappropriate measure of risk. For example, October 19, 1987 was a 22 Sigma event. The Dow Industrials fell 508 points. An event that based upon the tools of modern finance, was impossible to...
READ MORE
MEMBERS ONLY
Mean Shifting
by Greg Morris,
Veteran Technical Analyst, Investor, and Author
I’m quite sure the title had you thinking. Is it about driving a manual transmission automobile aggressively? Or is It a personality trait that is not good? Neither of those are even close, it is about the average (mean) of a strategy’s return distributions.
My Dance with the...
READ MORE
MEMBERS ONLY
New High, New Low Indicators (CGMBI - Chap 7)
by Greg Morris,
Veteran Technical Analyst, Investor, and Author
Please remember, these articles that cover various chapters in the upcoming book are not the complete chapter, only highlights that I have selected. The book is nearing completion.
CH 7 New High New Low Indicators
This Chapter contains all the indicators that are dedicated to using New Highs and/or...
READ MORE
MEMBERS ONLY
Questions from Readers - 3rd Qtr. 2015
by Greg Morris,
Veteran Technical Analyst, Investor, and Author
The first article of each calendar quarter will contain the best 10-12 questions posed by readers over the past 3 months. This is the second one in this Q&A series; the first one is here. This hopefully will encourage asking questions via the Comments section. Of course, the...
READ MORE
MEMBERS ONLY
Article Summaries 9-2014 to 3-2015
by Greg Morris,
Veteran Technical Analyst, Investor, and Author
Most blog authors on StockCharts.com are writing about the current markets and do an exceptional job. Erin Heim has become a chip off the old block – her Dad, Carl Swenlin. I do not write about the current markets as wanted to share my experiences after 40+ years as a...
READ MORE
MEMBERS ONLY
Technical Analysis Magic II
by Greg Morris,
Veteran Technical Analyst, Investor, and Author
This is the second part of the Technical Analysis Magic article published a while back – click here. I wanted to wait to see if there were any remaining readers. Apparently I did not offend everyone. Some of the introductory material is the same as last time just in case someone...
READ MORE
MEMBERS ONLY
Risk is More than a Four Letter Word
by Greg Morris,
Veteran Technical Analyst, Investor, and Author
Dictionary.com says: The exposure to the chance of injury or loss; a hazard or dangerous chance. American Heritage Dictionary says: The possibility of suffering harm or loss; danger. These are just two of the many entries and these were just for the noun. Risk in the world of investments...
READ MORE
MEMBERS ONLY
Zahorchak Measure II
by Greg Morris,
Veteran Technical Analyst, Investor, and Author
In a previous article entitled, “Zahorchak Measure” I introduced a process that was one of the first I read about back in the 1970s that hooked me on technical analysis. The article generated a lot of interest so with this article I’m going to add more detail on the...
READ MORE
MEMBERS ONLY
The Misnamed Indicator and More
by Greg Morris,
Veteran Technical Analyst, Investor, and Author
My good friend George Schade, the lawyer, the excellent technical analyst, the market historian, the superb researcher, and the one who has dampened a few of my brusque writings into less offensive prose has given me permission to reproduce an article he wrote in 2011 about an indicator I had...
READ MORE