MEMBERS ONLY
Sector Rotation Is Picking Up — Here’s What’s Improving
by Joe Rabil,
President, Rabil Stock Research
Joe Rabil highlights sector rotation and shows which sectors and industry groups are improving based on relative strength. He also reviews SPY market conditions, rising volatility, sentiment, and recent symbol requests like KO and DG....
READ MORE
MEMBERS ONLY
These Low ADX and Price Patterns Could Lead to the Next Breakouts!
by Joe Rabil,
President, Rabil Stock Research
Joe Rabil of Rabil Stock Research breaks down how low ADX and price patterns can signal emerging breakout setups. He also reviews SPY market conditions, rising bullish sentiment, and some recent symbol requests....
READ MORE
MEMBERS ONLY
Market Risk Is Rising — But These Stocks Look Better on Pullbacks
by Joe Rabil,
President, Rabil Stock Research
Joe Rabil of Rabil Stock Research explains why a pullback could create better stock opportunities, even as overall market risk rises. From there, he reviews SPY conditions, volatility, sentiment, and recent symbol requests....
READ MORE
MEMBERS ONLY
10-Year Yield at a Critical Juncture — What Happens Next?
by Joe Rabil,
President, Rabil Stock Research
Joe Rabil of Rabil Stock Research breaks down why the 10-year yield is at a critical juncture after months of quiet trading, along with what that might signal. He also reviews SPY market conditions, gold, silver, and recent stock requests....
READ MORE
MEMBERS ONLY
Momentum Is Building — These Stocks Stand Out!
by Joe Rabil,
President, Rabil Stock Research
Joe Rabil of Rabil Stock Research breaks down a momentum shift, highlighting stocks beginning to stand out based on trend, momentum, and relative strength. He also reviews SPY market conditions, including volatility, sentiment, and multi-timeframe trend analysis....
READ MORE
MEMBERS ONLY
Stocks Showing Early Market Rotation Using Relative Strength
by Joe Rabil,
President, Rabil Stock Research
Joe Rabil of Rabil Stock Research looks at stocks rotating after a long bearish, discusses the prospects of a Santa Claus rally, and breaks down viewer-requested stocks....
READ MORE
MEMBERS ONLY
Momentum Shift Starting — These Sectors Are Waking Up
by Joe Rabil,
President, Rabil Stock Research
Joe Rabil of Rabil Stock Research highlights a momentum shift taking shape across sectors, showing which ones are beginning to wake up as 2026 begins. He also reviews the S&P 500, market conditions, and individual stock setups showing improving structure and momentum....
READ MORE
MEMBERS ONLY
Bitcoin's Trend Is Changing — Key Levels You Need to Watch
by Joe Rabil,
President, Rabil Stock Research
In this video, Joe Rabil of Rabil Stock Research takes a fresh look at Bitcoin, breaking down how its trend is shifting and what the MACD and ADX signals could mean for the next big move. He also touches on the psychological 100K level and how the broader risk-on/risk-off...
READ MORE
MEMBERS ONLY
MACD Warning for S&P 500! Momentum Shift Underway
by Joe Rabil,
President, Rabil Stock Research
Joe Rabil breaks down the MACD warning and weakening momentum in the S&P 500 as the index tests support near its 18-week moving average. Additionally, he reviews Bitcoin’s reversal setup and highlights stocks with improving relative strength and trend structure....
READ MORE
MEMBERS ONLY
5 Stocks Showing Powerful ADX Signals
by Joe Rabil,
President, Rabil Stock Research
Joe Rabil explains how to use ADX to spot strength, trend, and breakout setups across different timeframes. He highlights five stocks with strong ADX patterns and reviews the latest S&P market conditions and stock requests to watch....
READ MORE
MEMBERS ONLY
5 Overlooked AI Stocks with BIG Upside Potential
by Joe Rabil,
President, Rabil Stock Research
Joe Rabil highlights five overlooked AI trading stocks showing strong trend and momentum setups. He also reviews the S&P market conditions and top stock market charts, including Apple, Nvidia, Oracle, and Teva....
READ MORE
MEMBERS ONLY
18-MA Trading Strategy: How to Spot Trends & Signals
by Joe Rabil,
President, Rabil Stock Research
Joe Rabil of Rabil Stock Research shows how to use the 18-MA to identify trend, momentum, and support/resistance, before then reviewing the latest S&P market conditions. He also covers the IWM and stock requests such as ACT, EQNR, FLNG, SAP, FCX, OSK, and VNT, pointing out setups...
READ MORE
MEMBERS ONLY
Energy Stocks Ready to Break Out? Key Setups to Watch
by Joe Rabil,
President, Rabil Stock Research
Joe highlights key setups in the energy sector, reviewing stocks such as XOM, CVX, VLO, and SU while explaining patterns like reverse divergence, zero line reversals, and low ADX conditions. He then analyzes the S&P market conditions, covering sentiment, volatility, trend, and momentum across multiple time frames, noting...
READ MORE
MEMBERS ONLY
Simple Yet Powerful RSI Pullback Signal
by Joe Rabil,
President, Rabil Stock Research
In this video, Joe shows viewers how to use a deep pullback in RSI as a buying opportunity. He uses two different settings for RSI in order to identify when a stock is a getting a great setup during an uptrend, and presents several examples on weekly and daily charts....
READ MORE
MEMBERS ONLY
Is the SPX Exhausted?
by Joe Rabil,
President, Rabil Stock Research
This week, Joe breaks down the importance of focusing on Price and using indicators as supporting tools. He shows how the daily SPX chart has continued to make higher highs and higher lows, explaining that, as the ADX shows weakness, we need price to confirm this signal. Joe then covers...
READ MORE
MEMBERS ONLY
MACD Reverse Divergence: Hidden Power in the Charts
by Joe Rabil,
President, Rabil Stock Research
Joe shares a lesson on the MACD reverse divergence pattern—also known as hidden divergence—and explains why it can be a powerful signal in combination with low ADX or strong ADX conditions. He highlights multiple stock examples showing this setup, then reviews the S&P market conditions, discussing...
READ MORE
MEMBERS ONLY
Unlock Explosive Breakouts with NR7 Bars!
by Joe Rabil,
President, Rabil Stock Research
Joe explains the NR7 compression bar pattern, showing how it builds energy for explosive breakout trading opportunities and how to apply it in swing trading and longer-term setups. He reviews the S&P (SPY) market conditions, covering sentiment, volatility, overbought/oversold signals, trend, and momentum. From there, he analyzes...
READ MORE
MEMBERS ONLY
How to Use the 4 MA for Better Timing in Trading & Investing
by Joe Rabil,
President, Rabil Stock Research
In this video, Joe demonstrates how to apply the 4 simple moving average (4 MA) as both a short-term trading tool and a longer-term timing guide. He explains how this moving average can help identify opportunities, manage pullbacks, and improve decision-making across multiple time frames. Joe then reviews the current...
READ MORE
MEMBERS ONLY
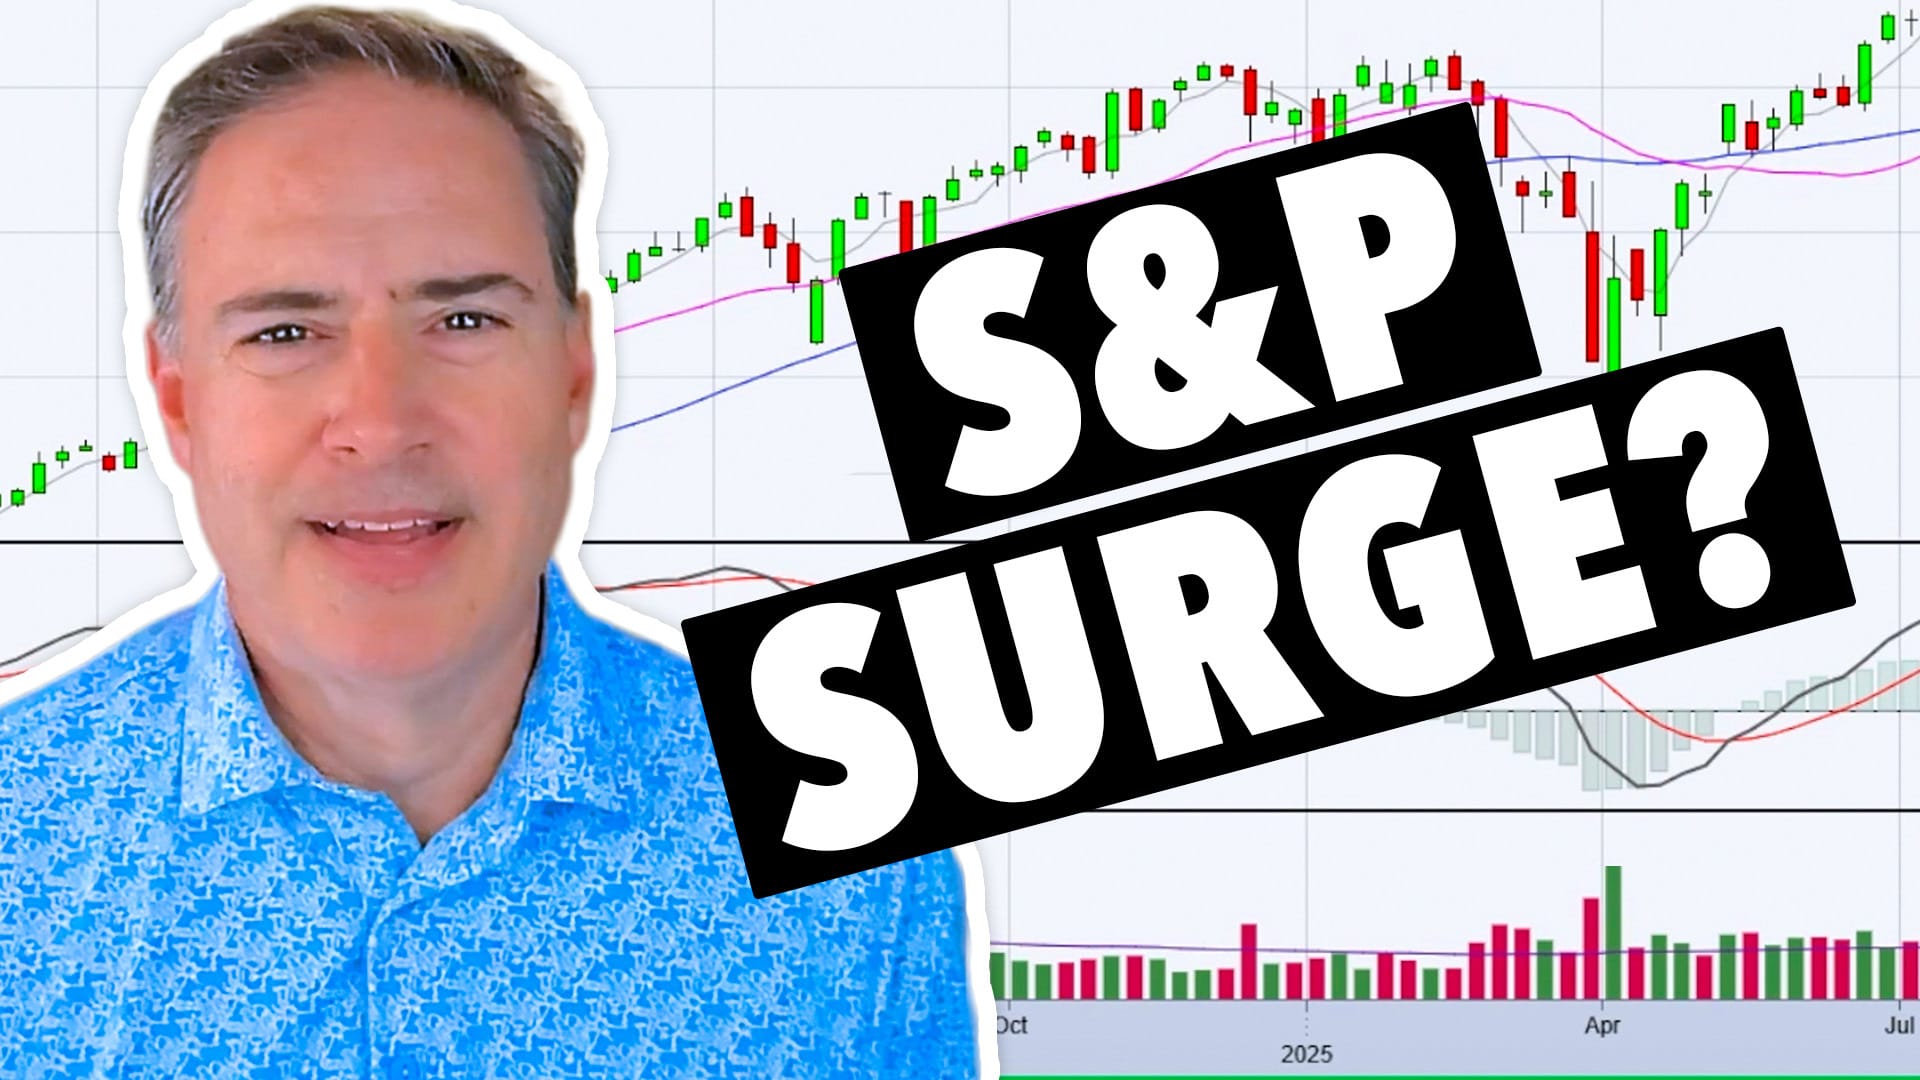
Is the S&P 500 About to Surge?
by Joe Rabil,
President, Rabil Stock Research
Joe analyzes the S&P 500’s current sequential wave pattern and, from there, explains how to spot a shift into a surging market phase. He breaks down key support and resistance levels on the SPY daily chart, evaluates the QQQ and IWM for signs of market strength, and...
READ MORE
MEMBERS ONLY
My Go-To ADX Scan for Finding Breakout Stocks
by Joe Rabil,
President, Rabil Stock Research
Joe shares his go-to ADX stock scan! Follow along as Joe uses the StockCharts platform to uncover strong long-term uptrends paired with low short-term momentum — the kind of setup that often precedes powerful breakouts. He walks through his “Strong Monthly / Low Weekly” scan criteria, explains how to apply it across...
READ MORE
MEMBERS ONLY
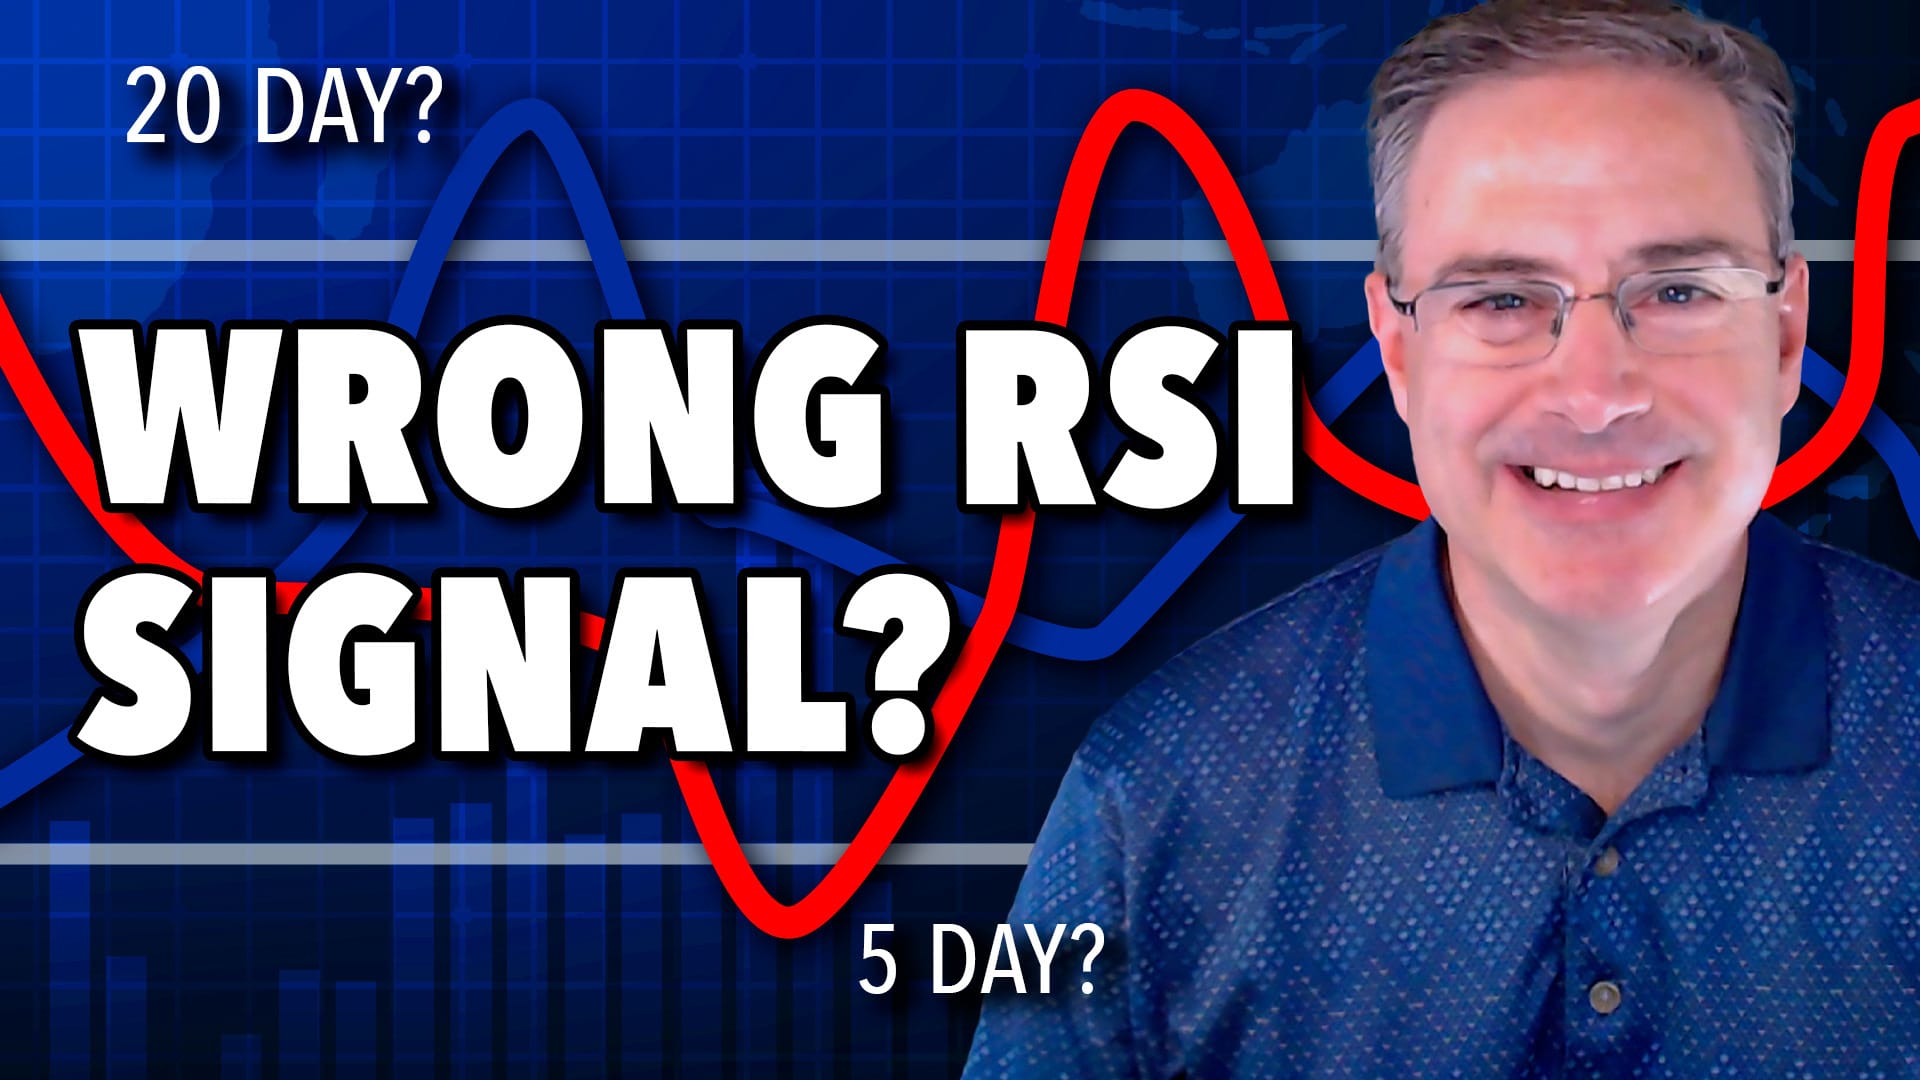
Avoid This Common RSI Mistake (And What to Do Instead)
by Joe Rabil,
President, Rabil Stock Research
Master RSI strategies with Joe! Follow along as Joe shares his refined method using dual timeframes and a two-RSI approach; see how he uses RSI-20 as a trend filter and RSI-5 as an entry signal to avoid common mistakes and enhance trading precision. Joe breaks down real chart examples on...
READ MORE
MEMBERS ONLY
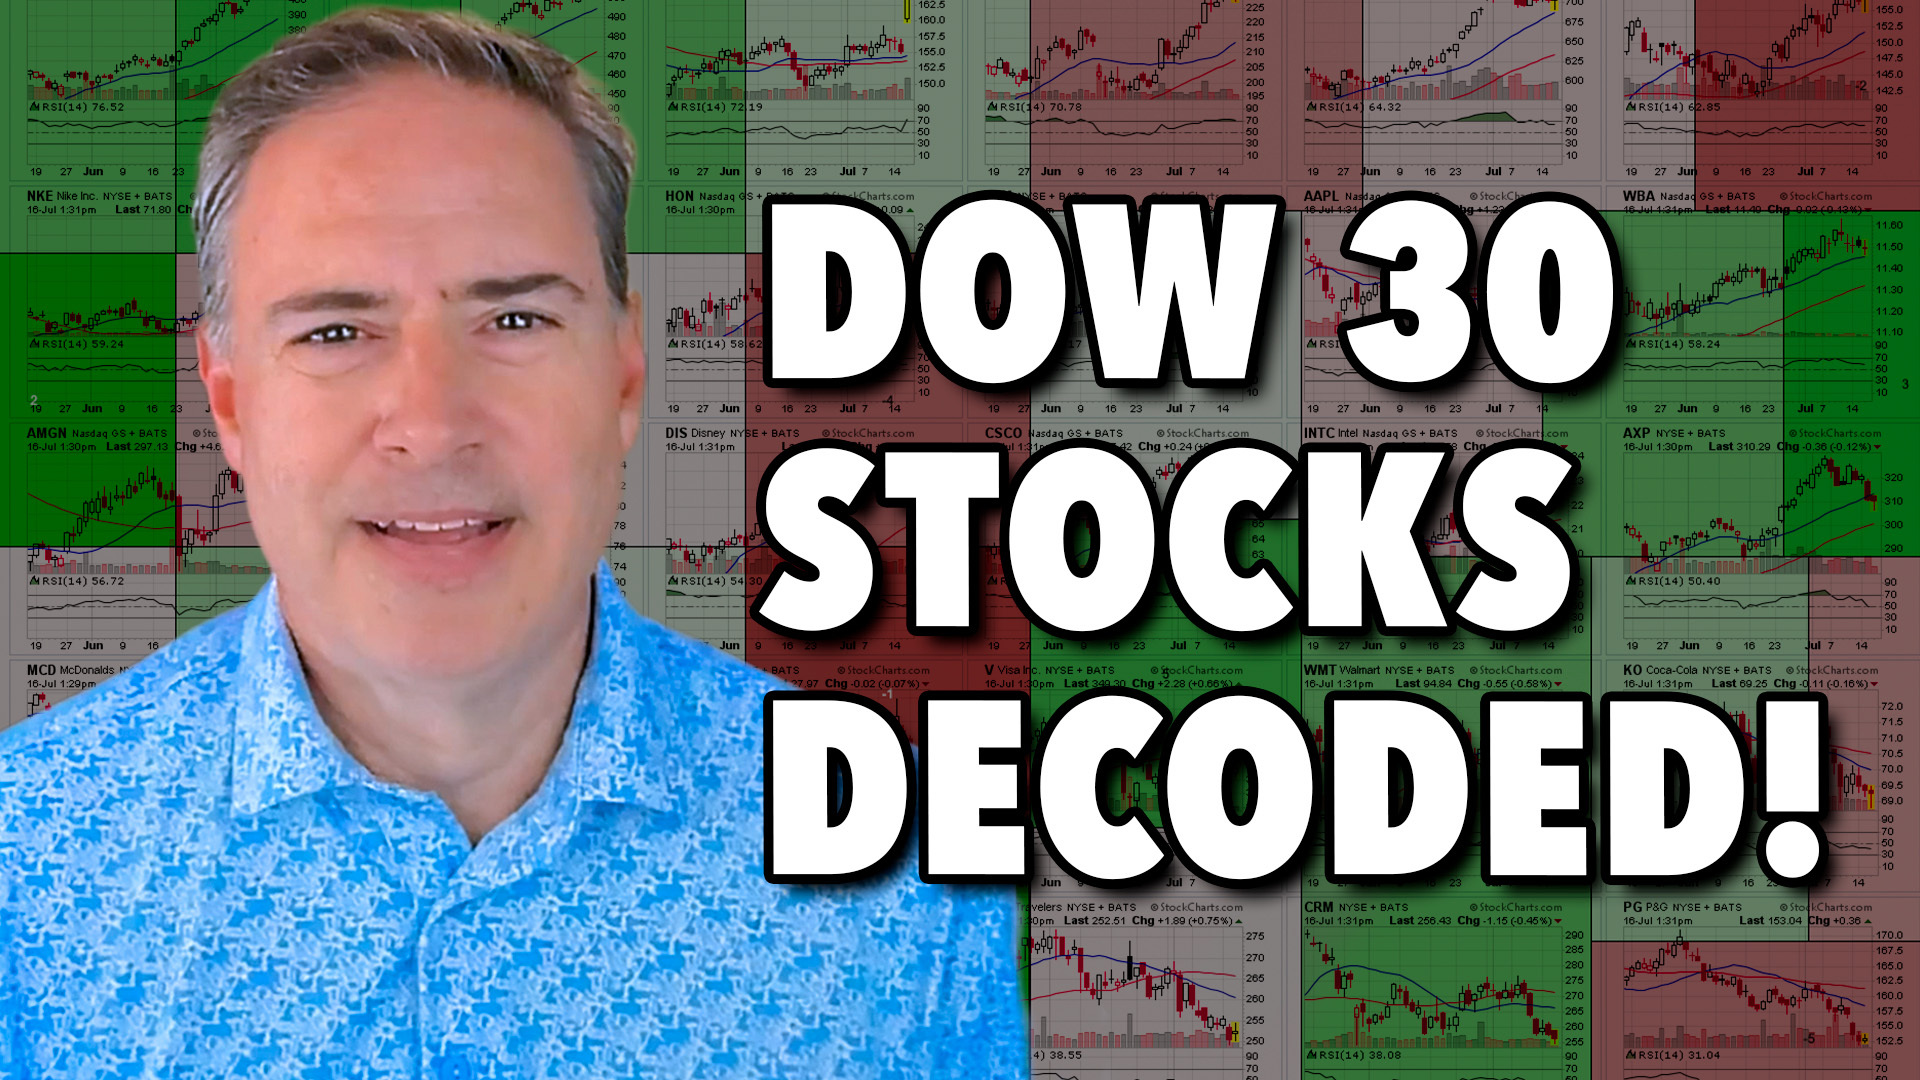
30 Dow Stocks in 20 Minutes: Joe Rabil's Mid-Year Technical Check
by Joe Rabil,
President, Rabil Stock Research
This week, Joe analyzes all 30 Dow Jones Industrial Average stocks in a rapid-fire format, offering key technical takeaways and highlighting potential setups in the process. Using his multi-timeframe momentum and trend approach, Joe shows how institutional investors assess relative strength, chart structure, ADX signals, and support zones. From Boeing&...
READ MORE
MEMBERS ONLY
Want Faster, Lower Risk Trades? Use This Setup
by Joe Rabil,
President, Rabil Stock Research
A good trade starts with a well-timed entry and a confident exit. But that's easier said than done.
In this video, Joe Rabil of Rabil Stock Research reveals his go-to two-timeframe setup he uses to gain an edge in his entry and exit timings and reduce his investment...
READ MORE
MEMBERS ONLY
MACD Crossovers: Why Most Traders Get It Wrong
by Joe Rabil,
President, Rabil Stock Research
Joe presents a deep dive into MACD crossovers, demonstrating how to use them effectively across multiple timeframes, establish directional bias, and improve trade timing. He explains why price action should confirm indicator signals, sharing how to identify "pinch plays" and zero-line reversals for higher-quality setups. Joe then analyzes...
READ MORE
MEMBERS ONLY
From Drift to Lift: Spotting Breakouts Before Momentum Hits
by Joe Rabil,
President, Rabil Stock Research
MACD, ADX and S&P 500 action frame Joe Rabil's latest show, where a drifting index push him toward single-stock breakouts. Joe spotlights the daily and weekly charts of American Express, Fortinet, Parker-Hannifin, Pentair, and ServiceNow as showing strong ADX/MACD characteristics. He outlines how the patterns...
READ MORE
MEMBERS ONLY
Joe Rabil's Undercut & Rally Pattern: From DROP to POP
by Joe Rabil,
President, Rabil Stock Research
Joe presents his game-changing "undercut and rally" trading pattern, which can be found in high volatility conditions and observed via RSI, MACD and ADX signals. Joe uses the S&P 500 ETF as a live case study, with its fast shake-out below support followed by an equally...
READ MORE
MEMBERS ONLY
10‑Year Yield Warning! ADX + RSI Point to a Major Shift
by Joe Rabil,
President, Rabil Stock Research
Joe kicks off this week's video with a multi‑timeframe deep dive into the 10‑year U.S. Treasury yield (TNX), explaining why a sideways coil just below the 5% level could be "downright scary" for equities. From there, he demonstrates precise entry/exit timingwith a...
READ MORE
MEMBERS ONLY
Why ADX Can Mislead You — And How to Avoid It
by Joe Rabil,
President, Rabil Stock Research
In this video, Joe walks through a comprehensive lesson on using the ADX (Average Directional Index) as part of a technical analysis strategy. Joe explains the key components of the ADX indicator, how to interpret DI+ and DI- lines, and how to identify strong or weak trends in the market....
READ MORE
MEMBERS ONLY
Top Sectors to Watch + The 18 SMA Setup Every Trader Should Know
by Joe Rabil,
President, Rabil Stock Research
In this video, Joe analyzes which sectors to focus on when selecting new stocks. He demonstrates how to use the 18-period simple moving average (SMA) on monthly, weekly, and daily charts to identify the strongest stock patterns and the best timeframes to trade. He then provides chart analysis on the...
READ MORE
MEMBERS ONLY
MACD + ADX: Spot the Pullbacks Worth Trading
by Joe Rabil,
President, Rabil Stock Research
In this video, Joe shares how to use MACD and ADX indicators to analyze stock pullbacks, focusing on the good while avoiding the weak setups. He explains how these indicators can complement one another. Joe then shows the Summary Page in ACP and how he uses it on a regular...
READ MORE
MEMBERS ONLY
How to Use Relative Strength in a Volatile Market
by Joe Rabil,
President, Rabil Stock Research
Want to know how to find strong stocks in a volatile market? In this video, Joe uses Relative Strength (RS), Fibonacci retracements, and technical analysis to spot top sectors and manage downside risk.
Follow along as Joe breaks down how to use the Relative Strength indicator to separate outperforming stocks...
READ MORE
MEMBERS ONLY
Use This Multi-Timeframe MACD Signal for Precision Trades
by Joe Rabil,
President, Rabil Stock Research
In this video, Joe shares how to trade MACD signals using multiple timeframes, and how to spot stock market pullback setups that can help to pinpoint a great entry off a low. He then reviews sector performance to identify market leadership, covers key chart patterns, and discusses a looming bearish...
READ MORE
MEMBERS ONLY
Master the 18/40 MA Strategy: Spot Trend, Momentum & Entry
by Joe Rabil,
President, Rabil Stock Research
In this video, Joe demonstrates how to use the 18-day and 40-day moving averages to identify trade entry points, assess trend direction, and measure momentum. He breaks down four key ways these MAs can guide your trading decisions—especially knowing when to be a buyer. Joe also analyzes commodities, noting...
READ MORE
MEMBERS ONLY
Hidden Gems: Bullish Patterns Emerging in These Country ETFs
by Joe Rabil,
President, Rabil Stock Research
In this video, Joe highlights key technical setups in select country ETFs that are showing strength right now. He analyzes monthly and weekly MACD, ADX, and RSI trends that are signaling momentum shifts. Joe also reviews the critical level to watch on the S&P 500 (SPX), while breaking...
READ MORE
MEMBERS ONLY
Trade Pullbacks Like a Pro: Simple Moving Average Strategy That Works
by Joe Rabil,
President, Rabil Stock Research
Moving average strategy, trend trading, and multi-timeframe analysis are essential tools for traders. In this video, Joe demonstrates how to use two key moving averages to determine if a stock is in an uptrend, downtrend, or sideways phase. He then expands on applying this concept across multiple timeframes to gain...
READ MORE
MEMBERS ONLY
Key Levels for the S&P 500: Has It Bottomed?
by Joe Rabil,
President, Rabil Stock Research
Is the stock market on the verge of crashing or has it bottomed?
In this video, Joe Rabil uses moving averages and Fibonacci retracement levels on a longer-term chart of the S&P 500 to identify support levels that could serve as potential bottoms for the current market correction....
READ MORE
MEMBERS ONLY
Trend-Following Stocks: How a Low ADX Can Signal Huge Breakouts!
by Joe Rabil,
President, Rabil Stock Research
In this exclusive StockCharts video, Joe Rabil shows you how to use the ADX on monthly and weekly charts to find stocks with massive breakout potential. Joe walks you through several examples of stocks and ETFs that broke out of an extended period of trading sideways. He also discusses the...
READ MORE
MEMBERS ONLY
Master Multi-Timeframe Analysis to Find Winning Trades!
by Joe Rabil,
President, Rabil Stock Research
In this exclusive StockCharts video, Joe shares how to use multi-timeframe analysis — Monthly, Weekly, and Daily charts — to find the best stock market opportunities. See how Joe uses StockCharts tools to create confluence across timeframes and spot key levels. Joe then identifies strength in commodities, QQQ, and finishes up by...
READ MORE
MEMBERS ONLY
New SPX Correction Signal! How Long Will It Last?
by Joe Rabil,
President, Rabil Stock Research
In this exclusive StockCharts video, Joe breaks down a new SPX correction signal using the monthly Directional Lines (DI), showing why this pullback could take time to play out. He explains how DI lines influence the ADX slope and how this impacts shorter-term patterns. Joe also reveals a strong area...
READ MORE


