MEMBERS ONLY
DOLLAR INDEX FALLS TO THREE-MONTH LOW -- THAT'S BOOSTING COMMODITY PRICES WITH GOLD IN THE LEAD -- A WEAK DOLLAR IS ALSO BOOSTING RELATIVE PERFORMANCE OF FOREIGN SHARES -- ESPECIALLY EMERGING MARKETS
by John Murphy,
Chief Technical Analyst, StockCharts.com
DOLLAR INDEX FALLS TO THREE MONTH LOW... The U.S. dollar has come under heavy selling pressure. Chart 1 shows the Dollar Index Fund (UUP) tumbing to the lowest level since last October. That's giving a boost to foreign currencies which are gaining ground today. That includes both...
READ MORE
MEMBERS ONLY
STOCK REBOUND CONTINUES -- PRICES RECOVER SOME LOSSES SUFFERED OVER THE LAST THREE MONTHS BUT REMAIN IN DOWNTRENDS -- STOCK INDEXES APPROACH POTENTIAL OVERHEAD RESISTANCE BARRIERS
by John Murphy,
Chief Technical Analyst, StockCharts.com
U.S. STOCK INDEXES CONTINUE JANUARY REBOUND ... Stock prices are trending higher again this morning which continues the rebound that started right after Christmas. Today's three price charts reflect that short-term improvement, while keeping them in a longer-range perspective. The main point of the charts is that all...
READ MORE
MEMBERS ONLY
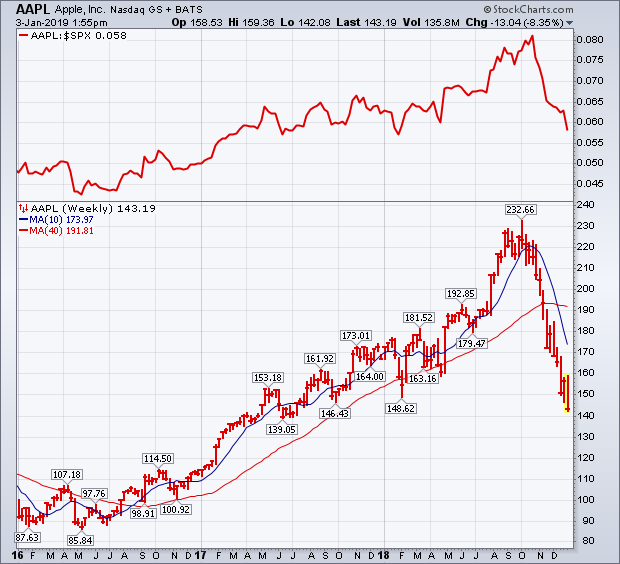
Apple Plunges on Sales Warning
by John Murphy,
Chief Technical Analyst, StockCharts.com
Editor's Note: This article was originally published in John Murphy's Market Message on Thursday, January 3rd at 1:59pm ET.
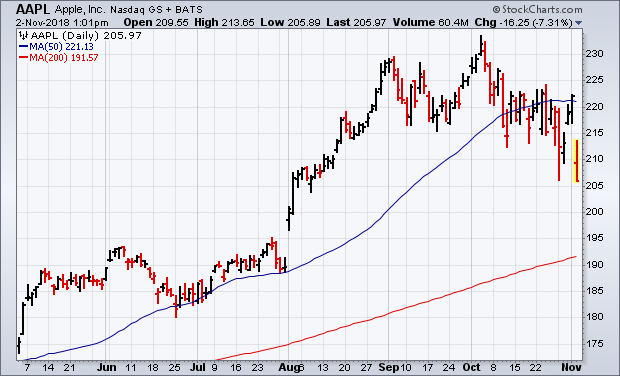
The price of Apple is plunging today after issuing a sales warning for the first quarter. The stock was already in trouble before that announcement. The...
READ MORE
MEMBERS ONLY
APPLE PLUNGES ON SALES WARNING -- STOCK INDEXES ARE FAILING AT OVERHEAD RESISTANCE LEVELS -- TREASURY YIELD FALLS TO LOWEST LEVEL IN A YEAR AS BOND PRICES SURGE -- GOLD AND YEN BENEFIT FROM SAFE HAVEN BUYING
by John Murphy,
Chief Technical Analyst, StockCharts.com
APPLE PLUNGES ON FIRST QUARTER WARNING ... The price of Apple is plunging today after issuing a sales warning for the first quarter. The stock was already in trouble before that announcement. The weekly bars in Chart 1 show Apple (AAPL) falling today to the lowest level since the middle of...
READ MORE
MEMBERS ONLY
PREVIOUS INSTANCES OF FED TIGHTENING ACCOMPANIED RISING COMMODITY PRICES -- THE FED IS RAISING RATES NOW WHILE COMMODITIES ARE PLUNGING -- WEAK CHINESE MARKET IS PULLING COMMODITIES LOWER -- AND REFLECTS A SLOWING GLOBAL ECONOMY
by John Murphy,
Chief Technical Analyst, StockCharts.com
LAST TWO YIELD CURVE INVERSION RESULTED FROM RISING COMMODITY PRICES ... My Wednesday morning message suggested that a sharp drop in the price of oil and other commodities argued for a more dovish tone from the Fed. That message also explained that previous Fed tightening cycles were usually done to combat...
READ MORE
MEMBERS ONLY
THE FED CAN'T AFFORD TO MAKE A MISTAKE TODAY -- HIGHER SHORT-TERM RATES RISK AN INVERTED YIELD CURVE -- WHILE PLUNGING OIL PRICE SHOWS WEAKER INFLATION -- AND U.S. STOCKS ARE UNDERGOING A MAJOR TEST OF THEIR EARLY 2018 LOWS
by John Murphy,
Chief Technical Analyst, StockCharts.com
TODAY IS A BIG DAY FOR THE FED -- AND FOR THE MARKETS ... Today is one of the most important Fed days in recent memory. That's because there's a lot riding on what it does this afternoon; or doesn't do. It's widely...
READ MORE
MEMBERS ONLY
LONGER-RANGE INDICATORS REMAIN BEARISH FOR U.S. STOCKS -- RETEST OF EARLY 2018 LOWS SHOULD DETERMINE IF STOCKS ARE IN A BEAR MARKET -- STOCKS OFF TO BAD DECEMBER START -- FAILURE OF SANTA CLAUS RALLY TO SHOW WOULD BE A BAD SIGN FOR THE NEW YEAR
by John Murphy,
Chief Technical Analyst, StockCharts.com
WEEKLY S&P 500 CHART CONTINUES TO LOOK TOPPY... There's a reason why every short-term rally attempt over the past couple of months has failed. That's because longer-range indicators have turned bearish and remain so. It's more difficult for bounces on daily charts...
READ MORE
MEMBERS ONLY
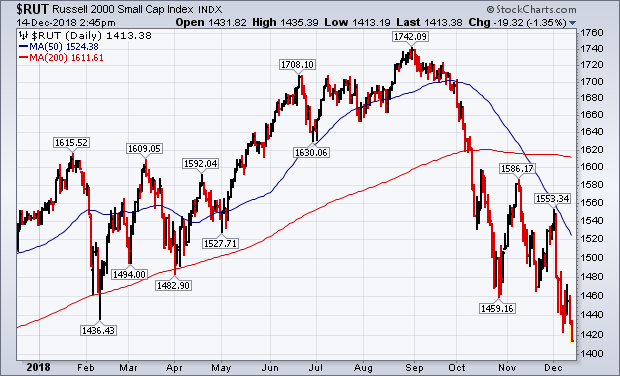
Russell 2000 Small Cap Index and the Dow Transports Fall to 52-Week Lows
by John Murphy,
Chief Technical Analyst, StockCharts.com
Editor's Note: This article was originally published in John Murphy's Market Message on Friday, December 14th at 2:32pm ET.
Two of the earliest warning signs since October that the stock market was in trouble was the fact that economically-sensitive stock groups like small caps and...
READ MORE
MEMBERS ONLY
HEAVY SELLING PUSHES U.S. STOCK INDEXES NEAR DECEMBER LOWS -- EARLY 2018 LOWS ARE NEXT -- RUSSELL 2000 SMALL CAP INDEX AND THE DOW TRANSPORTS FALL TO 52-WEEK LOWS -- SO DOES THE S&P RETAIL SPDR -- THAT'S A BAD SIGN FOR THE STOCK MARKET AND THE ECONOMY
by John Murphy,
Chief Technical Analyst, StockCharts.com
HEADING BACK TO EARLY 2018 LOWS... After a unimpressive bounce this week, stock prices are ending week under heavy selling pressure. The first three charts show the Dow Industrials, the S&P 500, and the Nasdaq Composite nearing new lows for the month of December, which puts them on...
READ MORE
MEMBERS ONLY
STOCKS ARE GOING BACK ON THE DEFENSIVE
by John Murphy,
Chief Technical Analyst, StockCharts.com
SHORT-TERM BOUNCE HAS RUN ITS COURSE ... This week's modest rebound in stocks has been unimpressive and appears to have run its course. Lack of upside volume and weak breadth also show that investors have stayed on the sidelines, or have sold into this week's rebound. Sector...
READ MORE
MEMBERS ONLY
MONDAY'S UPSIDE REVERSAL DAY MAY HAVE SIGNALLED SHORT-TERM BOTTOM -- THAT COULD LEAD TO DECEMBER REBOUND TO OVERHEAD RESISTANCE -- A STUDY OF SMALLER OR EQUAL WEIGHTED INDEXES SUGGESTS A RETEST OF EARLY 2018 LOWS MAY HAVE ALREADY TAKEN PLACE
by John Murphy,
Chief Technical Analyst, StockCharts.com
S&P 500 MAY BE FORMING SHORT-TERM BOTTOM... My message from last Friday suggested that the S&P 500 was likely to drop below its October low, which could lead to a retest of its early 2018 lows (more on that last point shortly). Chart 1 shows Monday&...
READ MORE
MEMBERS ONLY
OIL JUMPS ON OPEC CUTS -- THAT'S GIVING ENERGY SECTOR A BOOST -- FALLING OIL HAS WEIGHED ON BOND YIELDS -- WEAK ENERGY PATCH AND FALLING STOCK PRICES HAVE ALSO WEAKENED HIGH-YIELD BONDS -- S&P 500 APPEARS TO BE TRIANGULATING WHICH FAVORS LOWER PRICES
by John Murphy,
Chief Technical Analyst, StockCharts.com
LARGER THAN EXPECTED OPEC CUTS BOOST CRUDE OIL ... OPEC and Russia finally agreed to a larger-than-expected production cut of 1.2 million barrels a day of crude oil which is lifting the price of that commodity today. It remains to be seen, however, if that's enough to reverse...
READ MORE
MEMBERS ONLY
REVIEWING THE PHILOSOPHY OF TECHNICAL ANALYSIS -- CHARTS ACT AS LEADING INDICATORS OF FUNDAMENTAL INFORMATION -- THIS WEEK'S PLUNGE IN BOND YIELDS SUGGESTS ECONOMY WEAKENING -- FALLING STOCKS TOLD US THE SAME THING A MONTH AGO
by John Murphy,
Chief Technical Analyst, StockCharts.com
WHY WE LOOK AT CHARTS ... I've written several messages since the start of October about why the sharp stock market drop that month was most likely the start of a major topping process. Previous messages used Elliott Waves, the unusually old age of the current bull market (and...
READ MORE
MEMBERS ONLY
PLUNGING BOND YIELDS SEND SIGNAL OF ECONOMIC WEAKNESS -- S&P 500 FALLS BELOW 200-DAY AVERAGE AFTER FAILING TEST OF NOVEMBER HIGH -- BIGGEST LOSERS ARE BANKS, SMALL CAPS, SEMIS, AND TRANSPORTS -- UTILITIES HIT NEW HIGHS AND ARE THE ONLY WINNERS
by John Murphy,
Chief Technical Analyst, StockCharts.com
TEN-YEAR TREASURY YIELD PLUNGES BELOW ITS 200-DAY AVERAGE ... Chart 1 shows the 10-Year Treasury yield plunging to the lowest level in three months and falling below its 200-day average for the first time in more than a year. That means that investors are putting a lot of money into Treasury...
READ MORE
MEMBERS ONLY
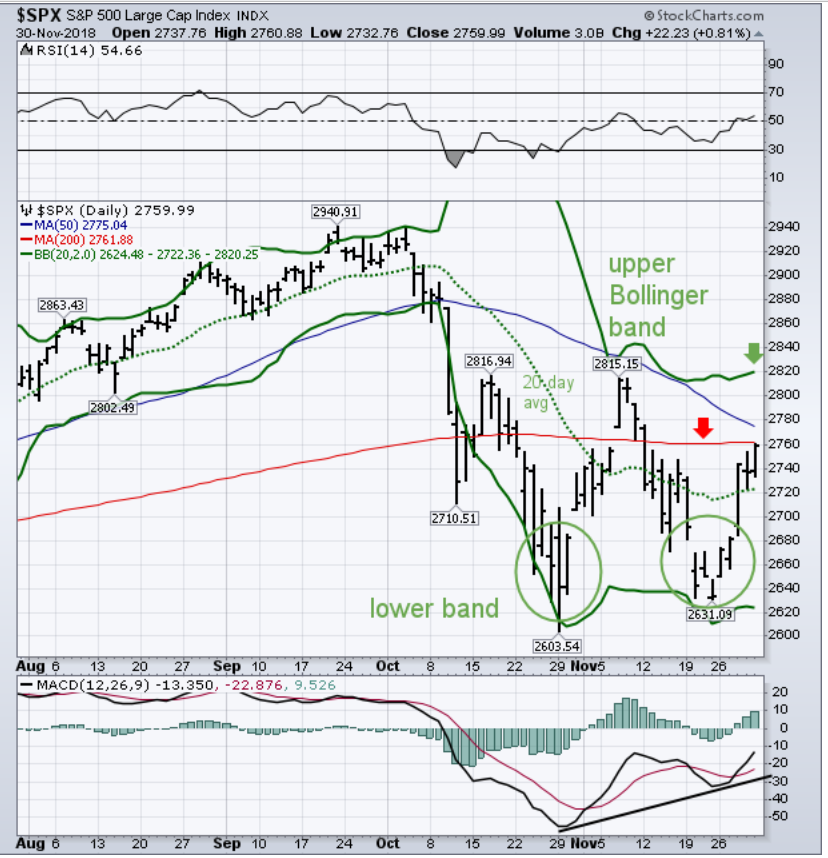
DAILY BOLLINGER BANDS SHOW SHORT-TERM STOCK TREND IMPROVING AND A POSSIBLE RETEST OF NOVEMBER HIGH -- WEEKLY AND MONTHLY BANDS ALSO SHOW SUPPORT -- BOLLINGER BAND WIDTH, HOWEVER, SHOWS THAT VOLATILITY REMAINS ELEVATED
by John Murphy,
Chief Technical Analyst, StockCharts.com
SHORT-TERM TREND IS IMPROVING ... There are lots of ways to determine the trend of the stock market. The placement of moving average lines is one of them. Bollinger bands (invented by John Bollinger) are another. Chart 1 applies both techniques to a daily chart of the S&P 500....
READ MORE
MEMBERS ONLY
Short-Term Trend is Improving
by John Murphy,
Chief Technical Analyst, StockCharts.com
Editor's Note: This article was originally published in John Murphy's Market Message on Friday, November 30th at 2:36pm ET.
There are lots of way to determine the trend of the stock market. The placement of moving average lines is one of them. Bollinger bands (invented...
READ MORE
MEMBERS ONLY
STOCKS REBOUND ON DOVISH FED SPEECH -- RISKIER STOCKS LEAD WHILE SAFE HAVENS LAG -- DOW REGAINS 200-DAY LINE -- LOWER BOND YIELDS WEAKEN THE DOLLAR WHICH BOOSTS GOLD AND EMERGING MARKETS
by John Murphy,
Chief Technical Analyst, StockCharts.com
DOW REGAINS 200-DAY AVERAGE ... U.S. stock indexes reacted positively to today's noon speech by Fed chief Jerome Powell that was perceived to be more dovish than comments made at the start of October. Stocks all over the world are rallying as a result. Chart 1 shows the...
READ MORE
MEMBERS ONLY
STOCKS BOUNCE OFF LATE OCTOBER LOW -- THIS WOULD BE A LOGICAL SPOT FOR A SEASONAL RALLY ATTEMPT -- HOW FAR IT CARRIES WILL BE VERY IMPORTANT -- NASDAQ 100 QQQ IS ALSO OVERSOLD ON ITS DAILY CHART -- ITS WEEKLY CHART, HOWEVER, SHOWS LONGER RANGE DAMAGE
by John Murphy,
Chief Technical Analyst, StockCharts.com
S&P 500 REBOUNDS OFF LATE OCTOBER LOW... Stocks are off to a good start to the post Thanksgiving trading week. And they have at least three things working in their favor. One is the proximity to their late October low. The other is a short-term oversold condition. The...
READ MORE
MEMBERS ONLY
AN EVENTUAL RETEST OF FIRST HALF LOWS STILL LOOKS LIKELY -- IN ORDER TO PREVENT THAT, OCTOBER LOWS HAVE TO HOLD -- FOR THAT TO HAPPEN, SOME SHORT-TERM CHART BARRIERS NEED TO BE OVERCOME --
by John Murphy,
Chief Technical Analyst, StockCharts.com
S&P 500 IS RETESTING ITS OCTOBER LOW ... Since the nearly nearly three year uptrend that started in stocks in early 2016 appears to have peaked, an eventual retest of early 2018 lows appears likely. That would mean an eventual retest of February/April lows on the S&...
READ MORE
MEMBERS ONLY
HEADLINE FROM OCTOBER 13: WEEKLY AND MONTHLY CHARTS ARE SENDING MORE SERIOUS WARNING SIGNS -- ELLIOTT WAVE ANALYSIS ALSO SUGGESTS THAT THE MARKET MAY HAVE COMPLETED ITS NINE-YEAR RUN
by John Murphy,
Chief Technical Analyst, StockCharts.com
CORRECTION: ... My message from last Wednesday showed negative readings on weekly and monthly stock charts, and referred back to an earlier message on that same topic. However, I incorrectly gave a date of May 13. The correct date of that earlier article is October 13, 2018. I also mentioned that...
READ MORE
MEMBERS ONLY
STOCK INDEXES STABILIZE BUT LOSE MORE GROUND -- DROP IN RETAILERS AND HOME IMPROVEMENT STOCKS MAKE CONSUMER CYCLICALS MARKET'S WEAKEST SECTOR -- WALMART, MACY'S AND HOME DEPOT FALL ON STRONG EARNINGS -- CONSUMER STAPLES CONTINUE TO OUTPERFORM
by John Murphy,
Chief Technical Analyst, StockCharts.com
DESPITE LATE REBOUND, STOCK INDEXES LOSE GROUND... Despite a rebound on Thursday and Friday, all major U.S. stock indexes lost ground this week. But very little changed on their respective chart patterns. Chart 1 shows an upside reversal on Thursday keeping the Dow Industrials above its 200-day average. But...
READ MORE
MEMBERS ONLY
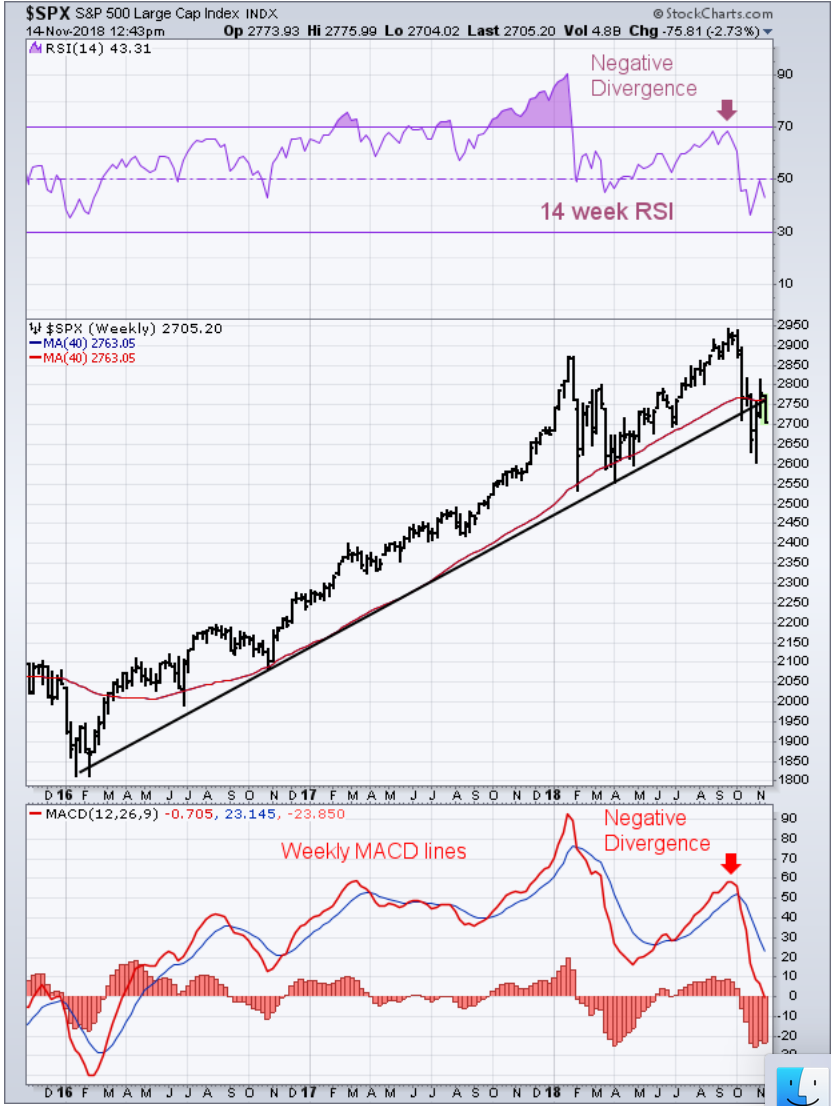
The Reason Short-Term Rallies are Failing is Because Weekly Charts Look Even More Negative
by John Murphy,
Chief Technical Analyst, StockCharts.com
Editor's Note: This article was originally published in John Murphy's Market Message on Wednesday, November 14th at 1:39pm ET.
The weekly bars in Chart 2 show the last upleg of the S&P 500 uptrend that began in early 2016. And it shows that...
READ MORE
MEMBERS ONLY
STOCKS CONTINUE THEIR NOVEMBER SLIDE -- THE S&P 500 MAY RETEST ITS LATE OCTOBER LOW -- THE REASON SHORT-TERM RALLIES ARE FAILING IS BECAUSE WEEKLY CHARTS LOOK EVEN MORE NEGATIVE -- THE S&P 500 MONTHLY CHART ALSO SHOWS SIGNS OF WEAKENING
by John Murphy,
Chief Technical Analyst, StockCharts.com
SHORT-TERM STOCK TREND CONTINUES TO WEAKEN ... Today's higher open is giving way to more afternoon selling. We've seen that same pattern over the past week as stock prices have started to slide again. The daily bars in Chart 1 show the S&P 500 Index...
READ MORE
MEMBERS ONLY
TECH STOCKS CONTINUE TO LEAD MARKET LOWER -- TECHNOLOGY SPDR SLIPS FURTHER BELOW ITS 200-DAY AVERAGE -- APPLE DROPS TOWARD ITS 200-DAY LINE AS MICROSOFT WEAKENS -- BROADCOM AND INTEL LEAD CHIP STOCKS SHARPLY LOWER -- S&P 500 IS BACK BELOW ITS 200-DAY LINE
by John Murphy,
Chief Technical Analyst, StockCharts.com
TECHNOLOGY SPDR FALLS FURTHER BELOW ITS 200-DAY AVERAGE ... Technology stocks continue to lead the stock market lower today. The Technology Sector SPDR (XLK) fell back below its 200-day average on Friday, and is falling further below it today (Chart 1). To get an idea of how much the techs have...
READ MORE
MEMBERS ONLY
ENERGY STOCKS FOLLOW CRUDE OIL LOWER -- RISING DOLLAR IS PUSHING COMMODITY PRICES LOWER -- DEFENSIVE SECTORS ARE STILL IN THE LEAD -- CYCLICALS RUN INTO RESISTANCE WHILE TECHOLOLOGY SECTOR WEAKENS
by John Murphy,
Chief Technical Analyst, StockCharts.com
CRUDE OIL ENTERS BEAR MARKET... Commodities as a group have been under a lot of selling pressure for several months. But the weakest part of that group over the past month has been energy. Chart 1 shows the price of WTIC Light Crude Oil (through yesterday) falling to the lowest...
READ MORE
MEMBERS ONLY
THE DOW LEADS NOVEMBER REBOUND -- THE S&P 500 IS BACK ABOVE ITS 200-DAY LINE -- SO ARE THE QQQ AND XLK -- HEALTH CARE PROVIDERS LEAD THE XLV -- SO ARE ABBOTT LABS, JOHNSON & JOHNSON, AND MERCK
by John Murphy,
Chief Technical Analyst, StockCharts.com
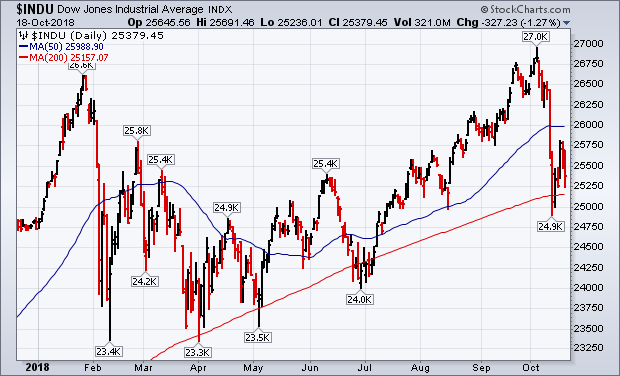
THE DOW LEADS STOCK UPTURN ... Major stock indexes are building on their November gains on the day after the midterm elections. The Dow is leading on the upside. Chart 1 shows the Dow Industrials already trading above chart resistance at 25,800 and trying to clear its 50-day average. Chart...
READ MORE
MEMBERS ONLY
Big Drop in Apple Hurts Tech Sector and The Nasdaq Which Are Leading Today's Stock Retreat
by John Murphy,
Chief Technical Analyst, StockCharts.com
Editor's Note: This article was originally published in John Murphy's Market Message on Friday, November 2nd at 12:28pm ET.
It's usually not a good sign when the market's biggest stock takes a big hit. That's especially true when it...
READ MORE
MEMBERS ONLY
BIG DROP IN APPLE HURTS TECH SECTOR AND THE NASDAQ WHICH ARE LEADING TODAY'S STOCK RETREAT -- BOTH MAY BE FAILING TESTS OF THEIR 200-DAY AVERAGES -- THE S&P 500 IS ALSO STALLING AT MOVING AVERAGE LINES -- HOURLY BARS SHOW OVERHEAD RESISTANCE BARRIERS
by John Murphy,
Chief Technical Analyst, StockCharts.com
APPLE FALLS ON GOOD NEWS ... It's usually not a good sign when the market's biggest stock takes a big hit. That's especially true when it happens the day after the company reported its fourth consecutive quarter of record revenue and profits. But that'...
READ MORE
MEMBERS ONLY
SHORT-TERM STOCK BOTTOM APPEARS TO BE IN PLACE -- SMALL AND MIDCAP INDEXES BOUNCE OFF FEBRUARY LOWS -- S&P 500 BOUNCES OFF SUPPORT -- AND MAY BE HEADING FOR A RETEST OF ITS 200-DAY AVERAGE
by John Murphy,
Chief Technical Analyst, StockCharts.com
SMALL AND MIDCAP STOCKS INDEXES BOUNCE OFF FEBRUARY LOWS... A lot of technical signs point to a short-term bottom in place for stocks. That suggests that major stock indexes will try to regain some of their October losses. The big question is how much of those losses. Before getting to...
READ MORE
MEMBERS ONLY
S&P 500 APPEARS HEADED FOR TEST OF ITS EARLY 2018 LOWS -- THE BREAKING OF ITS THIRTY-MONTH SUPPORT LINE IS ANOTHER NEGATIVE SIGN -- THE LAST TWO MARKET PEAKS STARTED IN OCTOBER -- A PLUNGE IN ASSET MANAGERS MAY BE ANOTHER SIGN OF MARKET WEAKNESS
by John Murphy,
Chief Technical Analyst, StockCharts.com
S&P 500 HEADED FOR A RETEST OF EARLY 2018 LOWS ... I keep hearing on CNBC that stocks are down sharply but "off their lows". They never seem to mention that they're even further "off their highs". After losing nearly 4% over the...
READ MORE
MEMBERS ONLY
FOREIGN STOCKS ARE LEADING U.S. STOCKS LOWER -- EUROPE AND ASIA ARE ALREADY IN DOWNTRENDS -- THE ALL COUNTRY WORLD INDEX IS FALLING TO THE LOWEST LEVEL IN A YEAR -- THAT SUGGESTS THAT GLOBAL STOCKS ARE PEAKING -- THAT INCLUDES THE U.S.
by John Murphy,
Chief Technical Analyst, StockCharts.com
FOREIGN STOCKS ARE LEADING THE U.S. LOWER... U.S. stocks are under pressure for a lot of reasons that have been described in previous messages. There's been the rotation over the last month out of economically-sensitive stock groups like cyclicals, industrials, energy, materials, and technology into defensive...
READ MORE
MEMBERS ONLY
S&P 500 RETESTS 200-DAY MOVING AVERAGE AND TWO-YEAR SUPPORT LINE -- VOLUME PATTERN HASN'T BEEN ENCOURAGING -- SMALL CAPS CONTINUE TO DROP FASTER THAN LARGE CAPS -- A RATIO OF SMALL CAPS VERSUS LARGE CAPS IS NOW TESTING MAJOR SUPPORT
by John Murphy,
Chief Technical Analyst, StockCharts.com
S&P 500 CONTINUES TO TEST MAJOR SUPPORT LINES... After a rebound attempt on Tuesday, stocks ended the week pretty much where they started, but on the defensive. The daily bars in Chart 1 show the S&P 500 Large Cap Index closing Friday right on its 200-day...
READ MORE
MEMBERS ONLY
The Three Dow Averages Are Giving Bearish Messages
by John Murphy,
Chief Technical Analyst, StockCharts.com
Editor's Note: This article was originally published in John Murphy's Market Message on Thursday, October 18th at 5:00pm ET.
My last two messages spelled out a lot of technical reasons that are bearish for the stock market, and increase the odds that the nine-year bull...
READ MORE
MEMBERS ONLY
THE THREE DOW AVERAGES ARE GIVING BEARISH MESSAGES -- THE DOW TRANSPORTS ARE FALLING THE FASTEST -- WHILE THE UTILITIES ARE DOW LEADERS -- TRANSPORTATION/UTILITIES RATIO FALLS TO LOWEST LEVEL OF THE YEAR
by John Murphy,
Chief Technical Analyst, StockCharts.com
THE DOW RETESTS 200-DAY LINE... My last two messages spelled out a lot of technical reasons that are bearish for the stock market, and increase the odds that the nine-year bull run is ending. Besides the heavy selling that's taken place during October, my weekend message showed a...
READ MORE
MEMBERS ONLY
HEALTHCARE HAS BECOME THE YEAR' STRONGEST SECTOR -- AND IS BEING LED HIGHER BY DRUG STOCKS -- JOHNSON & JOHNSON IS THE DAY'S DRUG LEADER -- LILLY, MERCK, AND PFIZER NEAR NEW RECORDS
by John Murphy,
Chief Technical Analyst, StockCharts.com
DEFENSIVE HEALTHCARE SECTOR CONTINUES TO LEAD ... Healthcare has emerged as the market's strongest sector. Not only has healthcare been the market's strongest sector over the last month, the last three months, and the last six months. It's now the top performer for the year....
READ MORE
MEMBERS ONLY
FRIDAY'S REBOUND PREVENTS FURTHER STOCK DAMAGE -- BUT WEEKLY AND MONTHLY CHARTS ARE SENDING MORE SERIOUS WARNING SIGNS -- ELLIOTT WAVE ANALYSIS ALSO SUGGESTS THAT THE MARKET MAY HAVE COMPLETED ITS NINE-YEAR RUN -- BULL MARKETS MAY NOT DIE OF OLD AGE
by John Murphy,
Chief Technical Analyst, StockCharts.com
S&P 500 HOLDS 200-DAY AVERAGE ... A stock rebound on Friday prevented a more serious market breakdown. That's because it allowed the S&P 500, and some other market gauges, to hold at or above their 200-day moving averages (Chart 1). That included the Dow and...
READ MORE
MEMBERS ONLY
GROWTH AND VALUE STOCKS ARE BOTH WEAKENING -- CONSUMER DISCRETIONARY AND TECH SPDRS HAVE FALLEN TO THEIR 200-DAY AVERAGES TO LEAD MARKET LOWER -- FINANCIALS HAVE ALSO LOST GROUND -- BANK INDEX FALLS TO NEW 2018 LOW
by John Murphy,
Chief Technical Analyst, StockCharts.com
GROWTH AND VALUE STOCKS ARE BOTH FALLING... One of the explanations for this week's big selloff is that the upside breakout in bond yields is hurting growth stocks. That's been especially true of consumer discretionary and technology stocks which suffered the biggest losses this month. Chart...
READ MORE
MEMBERS ONLY
NASDAQ CONTINUES TO LEAD MARKET LOWER -- ALONG WITH WEAK TECHNOLOGY STOCKS -- SEMICONDUCTOR ISHARES FALL TO LOWEST LEVEL IN SIX MONTHS -- SMALL AND MIDCAP INDEXES SLIP BELOW 200-DAY AVERAGES -- S&P 500 FALLS BELOW 50-DAY AVERAGE
by John Murphy,
Chief Technical Analyst, StockCharts.com
THE NASDAQ 100 (QQQ) LEADS MARKET LOWER... Stock indexes are all under selling pressure again this morning. As has been the case of late, the technology-dominated Nasdaq market has been leading the rest of the market lower. Chart 1 shows the Invesco Nasdaq 100 QQQ Trust falling to the lowest...
READ MORE
MEMBERS ONLY
HIGHER BOND YIELDS WEIGH ON STOCK PRICES -- CONSUMER CYCLICALS AND TECHNOLOGY CONTINUE TO LEAD THE MARKET LOWER -- THE QQQ FALLS BELOW ITS 50-DAY AVERAGE -- WHILE THE SOXX BREAKS ITS 200-DAY LINE
by John Murphy,
Chief Technical Analyst, StockCharts.com
A LOT OF MOVING AVERAGE LINES ARE BEING BROKEN... Stocks continue the retreat that began after bond yields reached multiyear highs at midweek. Bond yields are hitting new highs again today. As was the case yesterday, consumer cyclicals and technology are the two worst sector performers. Chart 1 shows the...
READ MORE
MEMBERS ONLY
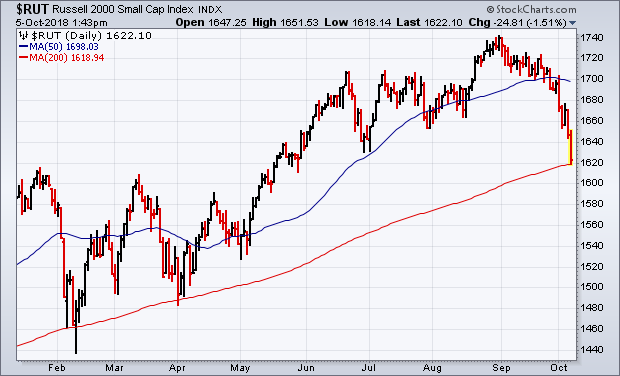
Russell 2000 Is Now Retesting Its 200-Day Average
by John Murphy,
Chief Technical Analyst, StockCharts.com
Editor's Note: This article was originally published in John Murphy's Market Message on Friday, October 5th at 2:02pm ET.
Tuesday's message showed the Russell 2000 Small Cap Index being the first of the major market indexes to fall below its 50-day line, and...
READ MORE