MEMBERS ONLY
STRONG JOB REPORT PUSHES STOCKS AND BOND YIELDS HIGHER WITH FINANCIALS IN THE LEAD -- BANK, BROKER, AND INSURANCE ETFS STRENGHEN -- LEADERS INCLUDE BANK OF AMERICA, CHARLES SCHWAB, AND LINCOLN NATIONAL
by John Murphy,
Chief Technical Analyst, StockCharts.com
STRONG JOB REPORT PUSHES BOND YIELDS HIGHER... An unusually strong July job report is causing more optimism in financial markets. When that happens, stock prices usually rise and bond prices fall which is what's happening today. When bond prices fall, bond yields jump which is also happening. Chart...
READ MORE
MEMBERS ONLY
JUMP IN 10-YEAR JAPANESE BOND YIELD MAY BE HINTING AT TREASURY YIELD BOTTOM -- BOND PRICES ARE STARTING TO WEAKEN -- SO ARE BOND PROXIES -- BANKS AND FINANCIALS STRENGTHEN
by John Murphy,
Chief Technical Analyst, StockCharts.com
10-YEAR JAPANESE YIELD SURGES TO FOUR MONTH HIGH... Chart 1 show the 10-Year Japanese Bond yield surging over the last week to the highest level since March. That's the biggest weekly jump in recent memory. Last Friday's disappointing BOJ bond buying program followed by yesterday'...
READ MORE
MEMBERS ONLY
DOLLAR DROPS ON WEAK GDP REPORT -- YEN SURGES ON BOJ DISAPPOINTMENT -- BLOOMBERG COMMODITY INDEX BOUNCES OFF TRENDLINE -- EMERGING MARKETS ISHARES HIT 12-MONTH HIGH -- EAFE ISHARES NEAR TEST OF SPRING HIGHS -- QQQ TOUCHES NEW RECORD
by John Murphy,
Chief Technical Analyst, StockCharts.com
DOLLAR DROPS AS YEN SURGES... A combination of factors are pushing the U.S. Dollar sharply lower. One is today's report of GDP growing only 1.2% in the second quarter. That pushed Treasury yields lower and bond prices higher and weakened the dollar. Chart 1 shows the...
READ MORE
MEMBERS ONLY
NASDAQ GETS BOOST FROM APPLE AND BIOTECHS -- APPLE SURGES 7% HIGHER ON STRONG VOLUME -- TECH SPDR HITS NEW HIGH -- BIOTECH SPDR RISES TO SIX-MONTH HIGH AS AMGEN BUILDS ON BULLISH BREAKOUT -- PHARMACEUTAL ETF ALSO COMPLETES BASE
by John Murphy,
Chief Technical Analyst, StockCharts.com
POWERSHARES QQQ NEARS OLD HIGH... Chart 1 shows the PowerShares QQQ climbing again today and in the process of testing its early December high at 114.75. The QQQ achieved a bullish breakout earlier this month and has shown market leadership since then. That can be seen by the rising...
READ MORE
MEMBERS ONLY
TECHNOLOGY SHOWS NEW MARKET LEADERSHIP -- EBAY, MICROSOFT, AND QUALCOMM GAP HIGHER -- CISCO ACHIEVES BULLISH BREAKOUTS -- NASDAQ NEARS OLD HIGHS -- BIOGEN AND AMGEN LEAD BIOTECHS HIGHER -- HEALTHCARE PROVIDERS HAVE STRONG WEEK
by John Murphy,
Chief Technical Analyst, StockCharts.com
TECHNOLOGY SPDR SHOWS NEW LEADERSHIP... Stocks had another good week with the Dow and S&P 500 ending Friday at new records. One of the other positive developments was new upside leadership by technology which was the week's strongest sector. Chart 1 shows the Technology Sector SPDR...
READ MORE
MEMBERS ONLY
HOMEBUILDERS LEAD ITB HIGHER -- LENNAR MAY BE NEXT HOMEBUILDER TO BREAK OUT -- THE XHB OFFERS BROADER EXPOSURE TO HOUSING-RELATED STOCKS -- OWENS CORNING IN STRONG UPTREND WHILE USG IS BREAKING OUT -- MOHAWK NEARS UPSIDE BREAKOUT AS WHIRLPOOL RALLIES
by John Murphy,
Chief Technical Analyst, StockCharts.com
US HOME CONSTRUCTION ISHARES TURN UP ... Several of my recent messages have written about the upturn in homebuilding shares. A lot of that has been due to the drop in bond yields and mortgage rates. Improvement in the housing area is also an encouraging sign for the economy. Chart 1...
READ MORE
MEMBERS ONLY
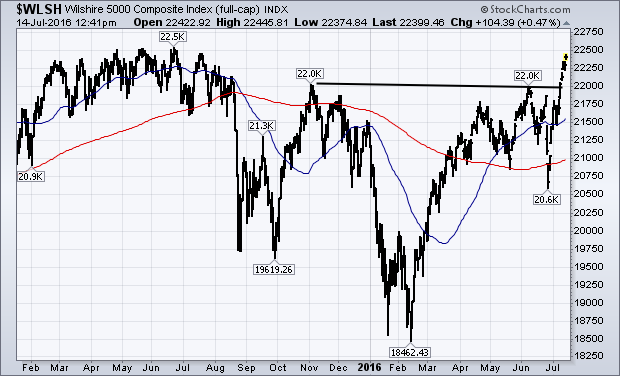
Wilshire 5000 Composite Index Nears Old High, Transports Play Catchup
by John Murphy,
Chief Technical Analyst, StockCharts.com
The Dow Industrials and S&P 500 continue to hit record highs. I've been showing upside breakouts in other parts of the market that include small caps and the NYSE Composite Index. Here's another one. Chart 3 shows the Wilshire 5000 Composite Index ($WLSH) having...
READ MORE
MEMBERS ONLY
GLOBAL STOCKS RESUME UPTREND -- ALL WORLD STOCK INDEX EXTENDS BULLISH BREAKOUT -- ASIAN EX JAPAN ISHARES TURN UP -- WILSHIRE 5000 INDEX NEARS RECORD -- TRANSPORTS NEAR TEST OF APRIL HIGH -- RAILS COMPLETE BASING PATTERN
by John Murphy,
Chief Technical Analyst, StockCharts.com
MSCI ALL COUNTRY WORLD INDEX ISHARES BUILDS ON BULLISH BREAKOUT... Global stocks resumed their uptrend today in a replay of Tuesday's shift toward riskier assets. Chart 1 shows the MSCI All Country World Stock Index iShares (ACWI) building on its bullish breakout that took place on Tuesday when...
READ MORE
MEMBERS ONLY
REBOUND IN GLOBAL BOND YIELDS AND BRITISH POUND ACCELERATE RISK ON TRADE AS GOLD AND YEN SELL OFF -- EMERGING MARKETS ACHIEVE BULLISH BREAKOUT -- SO DO ALL COUNTRY WORLD INDEX ISHARES
by John Murphy,
Chief Technical Analyst, StockCharts.com
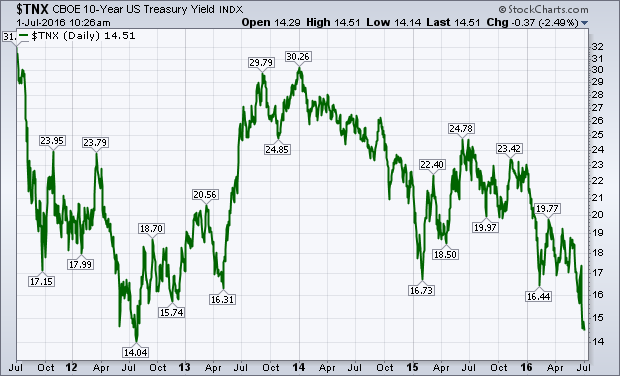
TREASURY YIELDS REBOUND ALONG WITH STERLING... A surge in global bond yields is contributing to a rotation out of safe havens and into riskier assets. Chart 1 shows the 10-Year Treasury Yield gapping 9 basis points higher to 1.52%. That puts the TNX back above its July 2012 closing...
READ MORE
MEMBERS ONLY
MAJOR STOCK INDEXES NEAR RECORD HIGHS -- NYSE COMPOSITE INDEX NEARS UPSIDE BREAKOUT -- SMALL CAPS TURN HIGHER -- CONSUMER DISCRETIONARY AND INDUSTRIAL ETFS ACHIEVE BULLISH BREAKOUTS -- INTEL AND SEMICONDUCTRS LEAD NASDAQ HIGHER
by John Murphy,
Chief Technical Analyst, StockCharts.com
MAJOR STOCK INDEXES NEAR NEW RECORDS... A strong job report on Friday helped push stocks close to record highs. Chart 1 shows the Dow Jones Industrial Average jumping 250 points (1.4%) on Friday to reach a two-month high. A test of its April high is imminent. The S&...
READ MORE
MEMBERS ONLY
TECHNICAL ODDS FAVOR HIGHER STOCK PRICES -- ON BALANCE VOLUME FOR NYSE INDEX HITS NEW HIGH FOR THE YEAR -- BOTH VERSIONS OF THE NYSE ADVANCE DECLINE LINE HIT NEW RECORDS
by John Murphy,
Chief Technical Analyst, StockCharts.com
UPSIDE BREAKOUT IN NYSE COMPOSITE INDEX STILL LOOKS LIKELY... My May 25 market message suggested that the stock market still had more work to do on the upside. That was based primarily on Elliott Wave Analysis which suggested that the market was still in a Wave 4 correction/consolidation pattern...
READ MORE
MEMBERS ONLY
DOW AND S&P 500 BOUNCE OFF 50-DAY AVERAGES -- NASDAQ REGAINS 200-DAY LINE -- CELGENE AND MERCK LEAD HEALTHCARE SPDR TO HIGHEST LEVEL SINCE AUGUST -- HOMEBUILDERS LEAD CYLICALS HIGHER AS DR HORTON BREAKS OUT -- FACEBOOK HAS STRONG DAY
by John Murphy,
Chief Technical Analyst, StockCharts.com
MARKET HAS UPSIDE REVERSAL DAY ... After trading lower this morning, stocks rallied this afternoon to respectable gains. That upside reversal also helped the Dow Industrials and S&P 500 bounce off their 50-day moving averages as shown in Charts 1 and 2. Chart 3 shows the Nasdaq Composite Index...
READ MORE
MEMBERS ONLY
Treasury Yield Falls to Four-Year Low, Lower Mortgage Rates are Boosting Homebuilders
by John Murphy,
Chief Technical Analyst, StockCharts.com
The plunge in global bond yields continues. Yesterday's statement from the Bank of England of its intention to lower rates sometime this summer pushed the British 2-year yield into negative territory for the first time, and its 10-Year to another record low further below 1%. Treasury yields continue...
READ MORE
MEMBERS ONLY
TREASURY YIELD FALLS TO FOUR-YEAR LOW -- LOWER MORTGAGE RATES ARE BOOSTING HOMEBUILDERS -- HOME CONSTRUCTION ETF NEARS UPSIDE BREAKOUT -- KBH HAS ALREADY BROKEN OUT -- OIL SERVICE ETF CONTINUES TO SHOW LEADERSHIP -- TRANSOCEAN CLEARS 200-DAY LINE
by John Murphy,
Chief Technical Analyst, StockCharts.com
10-YEAR TREASURY YIELD TESTING 2012 LOW... The plunge in global bond yields continues. Yesterday's statement from the Bank of England of its intention to lower rates sometime this summer pushed the British 2-year yield into negative territory for the first time, and its 10-Year to another record low...
READ MORE
MEMBERS ONLY
ALL COUNTRY WORLD INDEX REGAINS 200-DAY LINE -- EMERGING MARKETS LEAD GLOBAL REBOUND -- BRAZIL AND CHINESE ETFS STRENGTHEN -- ENERGY AND HEALTHCARE SPDRS CLEAR 50-DAY LINES -- OTHER SECTOR ETFS TURN BACK UP -- S&P 500 RETAKES 200-DAY LINE
by John Murphy,
Chief Technical Analyst, StockCharts.com
MSCI ALL COUNTRY WORLD INDEX BACK OVER 200-DAY AVERAGE... Investor confidence is returning to global stocks after the short-term panic caused by last Friday's Brexit vote. Improvement is being seen in both developed and emerging markets. Chart 1 shows the MSCI All Country World Index (ACWI) climbing back...
READ MORE
MEMBERS ONLY
EUROPEAN MARKETS LEAD STOCK BOUNCE -- EUROPEAN STOCK INDEX TESTS FEBRUARY LOW -- YIELD ON BRITISH BOND FALLS BELOW 1% -- 10 YEAR TREASURY YIELD MAY TEST 2012 BOTTOM -- EURO DROP IS ALSO BOOSTING DOLLAR
by John Murphy,
Chief Technical Analyst, StockCharts.com
EUROPEAN STOCKS LEAD GLOBAL BOUNCE ... A rebound in European stocks is leading a rebound in the states. Chart 1 shows the Dow Jones Europe Ex UK Index climbing 2.5%. France and Germany are up a similar amount. What may be significant from a charting standpoint is that the index...
READ MORE
MEMBERS ONLY
GLOBAL STOCK SELLOFF CONTINUES -- BRITISH POUND HITS NEW LOW -- EUROPEAN STOCKS HIT HARD AGAIN -- US STOCK INDEXES BREAK MAY LOW -- DOW AND S&P 500 FALL BELOW 200-DAY LINES -- TELECOM, UTILITIES, AND REITS BENEFIT FROM PLUNGING BOND YIELDS
by John Murphy,
Chief Technical Analyst, StockCharts.com
U.S. STOCK INDEXES BREAK CHART SUPPORT... The global selling of stocks that started on Friday continued into today. Big losses in Europe signaled another bad day. The British Pound fell to another 30-year low (Chart 1). Chart 2 shows London's FTSE 100 losing more than 2% and...
READ MORE
MEMBERS ONLY
BREXIT VOTE HAMMERS GLOBAL STOCKS -- BRITAIN AND EUROPE LEAD DECLINES -- GOLD, TREASURIES, AND THE YEN SOAR -- RISING DOLLAR PUNISHES OTHER COMMODITIES -- VIX SURGES TO 2016 HIGH -- US STOCK INDEXES HEAD TOWARD MAY LOWS
by John Murphy,
Chief Technical Analyst, StockCharts.com
WORLD MARKETS ARE SHOCKED AT BRITISH VOTE... Even though polls showed the British vote to be very close, a lot of money bet that the Brits would vote to stay in the European Union. That was true with London bookies and global investors. Strong currency and stock action on Wednesday...
READ MORE
MEMBERS ONLY
BRITISH POUND AND UK STOCKS STRENGTHEN -- UK ISHARES HIT SEVEN- MONTH HIGH -- EUROPEAN SHARES ARE ALSO RISING -- DOW JONES EUROPE INDEX LOOKS TO BE BOTTOMING -- WEEKLY CHART OF WILSHIRE 5000 COMPOSITE STOCK INDEX STILL LOOKS POSITIVE
by John Murphy,
Chief Technical Analyst, StockCharts.com
STERLING SHOULD BE BOTTOMING... I'm going to take the chance of ignoring the British vote on Thursday and concentrate instead on the charts themselves. If it's true that markets have a way of discounting (or anticipating) events, that's the best we can do. The...
READ MORE
MEMBERS ONLY
BRITAIN LEADS GLOBAL STOCK RALLY -- POUND SURGES 2% -- SAFE HAVEN ASSETS LIKE BONDS AND GOLD SELL OFF -- WEAK DOLLAR BOOSTS COPPER AND OIL -- S&P 500 GIVES BACK HALF ITS GAINS BY THE CLOSE
by John Murphy,
Chief Technical Analyst, StockCharts.com
UK LEADS GLOBAL RALLY ... Stocks around the world started the week on a strong note which appears to be tied to shifting sentiment in Britain. Chart 1 shows the British Pound surging more than 2% for its biggest gain in years. British stocks are sharply higher as well. Chart 2...
READ MORE
MEMBERS ONLY
European Markets Bounce on Friday but Remain in Downtrends
by John Murphy,
Chief Technical Analyst, StockCharts.com
All eyes are on the British Brexit vote this coming Thursday (June 23) on whether to stay in the European Union or leave. Latest polls show the "leave" vote in the lead. A relief bounce on Friday in Britain and Europe was encouraging, but not enough to turn...
READ MORE
MEMBERS ONLY
EUROPEAN MARKETS BOUNCE ON FRIDAY BUT REMAIN IN DOWNTRENDS -- GOLD AND YEN ARE RISING TOGETHER FOR A REASON -- SO IS THE VIX -- TELECOM ISHARES CLOSE AT NEW RECORD -- VERIZON NEARS UPSIDE BREAKOUT -- REITS ARE ALSO GAINING AS BOND YIELDS DROP
by John Murphy,
Chief Technical Analyst, StockCharts.com
A FRIDAY REBOUND IN BRITAIN AND EUROPE... All eyes are on the British Brexit vote this coming Thursday (June 23) on whether to stay in the European Union or leave. Latest polls show the "leave" vote in the lead. A relief bounce on Friday in Britain and Europe...
READ MORE
MEMBERS ONLY
FOREIGN STOCKS LEAD US STOCKS LOWER -- EUROPE ETFS TUMBLE -- TEN-YEAR TREASURY YIELD FALLS TO FOUR-YEAR LOW -- FALLING FOREIGN CURRENCIES BOOST DOLLAR -- BOUNCING DOLLAR HURTS OIL, WHILE FALLING YIELDS BOOST GOLD -- BANK STOCKS LEAD U.S. STOCKS LOWER
by John Murphy,
Chief Technical Analyst, StockCharts.com
FOREIGN SHARES TUMBLE... Foreign shares continue to fall sharply and are pulling U.S. shares lower. The biggest drops are being seen in developed markets. Chart 1 shows MSCI iShares (EFA) falling to the lowest level in early three months. The biggest losses are being seen in Europe and Japan....
READ MORE
MEMBERS ONLY
PLUNGE IN GLOBAL BOND YIELDS SPARKS FLIGHT TO SAFETY -- RECORD LOW FOREIGN YIELDS PULL 10-YEAR TREASURY YIELD TO THREE-YEAR LOW -- BREXIT FEARS HIT POUND AND EUROPE -- OVERBOUGHT OIL MARKET DUE FOR A PULLBACK -- SO IS THE S&P 500
by John Murphy,
Chief Technical Analyst, StockCharts.com
FALLING FOREIGN YIELDS PULL TREASURIES LOWER... The big story this week was the plunge in global bond yields, many of which fell to record lows and deeper into negative territory. Chart 1 compares 10-Year yields of the U.S. (green), Britain (red), Germany (blue), and Japan (orange). The last three...
READ MORE
MEMBERS ONLY
INDUSTRIAL SPDR NEARS NEW RECORD -- RAILS ARE BACK ON TRACK LED BY CSX AND UNION PACIFIC -- COMMODITY INDEXES REACH BULL MARKET THRESHOLD -- MATERIALS ALSO SHOW MARKET LEADERSHIP -- NUCOR LEADS STEEL STOCKS HIGHER -- FALLING BOND YIELDS HELP GOLD
by John Murphy,
Chief Technical Analyst, StockCharts.com
INDUSTRIAL SPDR NEARS RECORD ... One of the positive signs for the stock market is that it's being led higher by economically sensitive stock groups. Chart 1, for example, shows the Industrial Sector SPDR (XLI) testing its April high. The XLI scored a bullish breakout during March when it...
READ MORE
MEMBERS ONLY
GLOBAL STOCKS CONTINUE RALLY -- OIL SERVICE STOCKS LEAD MARKET HIGHER ON RISING OIL -- S&P 500 ATTEMPTING NEW HIGH -- SMALL CAPS ARE ALSO LEADING
by John Murphy,
Chief Technical Analyst, StockCharts.com
OIL SERVICE STOCKS SURGE ... Strong buying in energy shares is helping lead global stocks higher. That's especially true of oil service stocks. Chart 1 shows the VanEck Vectors Oil Services ETF (OIH) surging near 7% today. Its relative strength ratio (top of chart) is surging as well. Crude...
READ MORE
MEMBERS ONLY
Weakest Jobs Report in Five Years Surprises Everyone
by John Murphy,
Chief Technical Analyst, StockCharts.com
Friday's job report of only 38,000 jobs created in May was the weakest in more than five years. And it pretty much shocked everyone. Some of the market reactions, however, were reasonably predictable. Interest rate yields tumbled along the entire yield curve. Chart 1 shows the 10-Year...
READ MORE
MEMBERS ONLY
WEAK JOBS REPORT PUSHES BOND YIELDS AND DOLLAR SHARPLY LOWER -- WINNERS ARE BONDS, UTILITIES, AND GOLD -- BANKS ARE LOSERS -- FOREIGN MARKETS JUMP ALONG WITH CURRENCIES -- S&P 500 HOLDS UPTREND -- HEALTHCARE SECTOR TURNS UP
by John Murphy,
Chief Technical Analyst, StockCharts.com
WEAKEST JOB REPORT IN FIVE YEARS SURPRISES EVERYONE... Friday's job report of only 38,000 jobs created in May was the weakest in more than five years. And it pretty much shocked everyone. Some of the market reactions, however, were reasonably predictable. Interest rate yields tumbled along the...
READ MORE
MEMBERS ONLY
HEALTHCARE ETFS THAT COVER HEALTHCARE PROVIDERS AND MEDICAL DEVICES AND EQUIPMENT GAIN GROUND -- MEDTRONIC SURGES TO NEW RECORD -- HEALTHCARE SPDR EXCEEDS APRIL HIGH -- ABBVIE SCORES BULLISH BREAKOUT
by John Murphy,
Chief Technical Analyst, StockCharts.com
U.S. HEALTHCARE PROVIDERS ISHARES ... In my message posted earlier today, I showed a number of healthcare providers that are having a strong day, including Aetna (AET), Centene (CNC), Humana (HUM), and Unitedhealth Group (UNH). I want to point out here that an ETF is available to cover that group...
READ MORE
MEMBERS ONLY
HEALTH CARE SPDR NEARS TEST OF APRIL HIGH -- HEALTHCARE PROVIDERS ARE STRONGEST GROUP -- AETNA, CENTENE, AND HUMANA SCORE BIG GAINS -- UNITEDHEALTH GROUP HITS NEW RECORD
by John Murphy,
Chief Technical Analyst, StockCharts.com
HEALTH CARE SPDR NEARS APRIL HIGH... Healthcare stocks continue to gain ground despite a generally soft stock market. Chart 1 shows the Health Care SPDR (XLV) trading higher today and nearing a test of its April high. The XLV/SPX ratio (top of chart) continues to gain ground as well....
READ MORE
MEMBERS ONLY
HEALTHCARE SPDR SHOWS RELATIVE STRENGTH AND HAS POSITIVE CHART PATTERN -- WATERS NEARS UPSIDE BREAKOUT -- PATTERSON DENTAL TURNS UP -- BIOGEN IS BIOTECH LEADER -- BIG PHARMA LEADERS ARE JOHNSON & JOHNSON, BRISTOL MYERS SQUIBB, AND PFIZER
by John Murphy,
Chief Technical Analyst, StockCharts.com
HEALTH CARE SPDR SHOWS RELATIVE STRENGTH ... With stocks encountering some selling at the start of June, healthcare stocks are showing more resilience. That may be due to the fact the heathcare stocks have defensive characteristics. It may also have to do with the fact that healthcare stocks are starting to...
READ MORE
MEMBERS ONLY
ELLIOTT WAVE ANALYSIS SUGGESTS THAT STOCKS HAVE BEEN IN A WAVE FOUR CORRECTION -- SINCE BULL MARKETS USUALLY HAVE FIVE WAVES, THAT MEANS THERE'S ANOTHER UPWAVE TO COME -- BOTH VERSIONS OF NYSE ADVANCE-DECLINE LINE LOOK STRONG
by John Murphy,
Chief Technical Analyst, StockCharts.com
STOCKS ARE ENDING WAVE FOUR CORRECTION... I find Elliott Wave Analysis very helpful in keeping the stock market's trend in proper perspective. I'm revisiting the subject here because I believe it may explain what's happening in global stocks. Here's a brief explanation....
READ MORE
MEMBERS ONLY
STRONG HOUSING DATA GIVES HOMEBUILDERS AND STOCKS A BIG LIFT -- BANKS HELP LEAD FINANCIALS TO ANOTHER STRONG DAY -- TECHNOLOGY SPDR TURNS UP AS SEMICONDUCTORS NEAR UPSIDE BREAKOUT -- NASDAQ INDEXES CLEAR MOVING AVERAGE LINES
by John Murphy,
Chief Technical Analyst, StockCharts.com
HOME CONSTRUCTION ISHARES CLEAR MOVING AVERAGES ... April new home sales surged to the highest level since 2008. That followed on the heels of last week's report of strong existing home sales. The prospect of newer homes being built is good for homebuilders, the economy, and the stock market....
READ MORE
MEMBERS ONLY
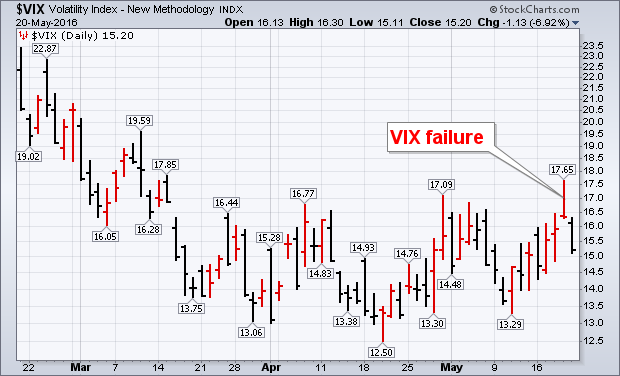
VIX Fails Breakout Attempt, NASDAQ May Be Turning Higher
by John Murphy,
Chief Technical Analyst, StockCharts.com
My Thursday morning message showed the Volatility Index (VIX) trying to break through resistance near 17. It rose as high as 17.65 intra-day which was the highest level in two months. Fortunately, it wasn't able to close there. The good news is that the VIX closed at...
READ MORE
MEMBERS ONLY
DOW AND S&P 500 REMAIN IN SIDEWAYS PATTERN AFTER PASSING ONE-YEAR ANNIVERSARY OF MAY 2015 TOP -- BOTH ARE IN SHORT-TERM PULLBACKS BUT REMAIN ABOVE THEIR 200-DAY LINES -- NASDAQ UNDERPERFORMANCE MAY BE ABOUT TO TAKE A TURN FOR THE BETTER
by John Murphy,
Chief Technical Analyst, StockCharts.com
VIX FAILS BREAKOUT ATTEMPT... My Thursday morning message showed the Volatility Index (VIX) trying to break through resistance near 17. It rose as high as 17.65 intra-day which was the highest level in two months. Fortunately, it wasn't able to close there. The good news is that...
READ MORE
MEMBERS ONLY
VIX NEARS UPSIDE BREAKOUT -- SHORT TERM MARKET CORRECTION CONTINUES AS DOW AND S&P 500 HEAD TOWARD 200-DAY AVERAGES -- RISING DOLLAR WEAKENS COMMODITIES AND MULTINATIONALS -- STOCKS COULD PULL BACK TOWARD MIDDLE OF YEARLONG TRADING RANGE
by John Murphy,
Chief Technical Analyst, StockCharts.com
VIX MAY BE TURNING UP ... Chart 1 shows the Volatility (VIX) Index trying to clear 17 for the first time since early March. A rising VIX is usually associated with lower stock prices. Chart 2 shows a point & figure version of the VIX and shows a similar picture. After...
READ MORE
MEMBERS ONLY
RISING BOND YIELDS BOOST FINANCIALS -- FINANCIAL SPDR BOUNCES OFF 200-DAY LINE -- BANK LEADERS INCLUDE REGIONS FINANCIAL, SUNTRUST, AND JP MORGAN CHASE -- PRUDENTIAL AND UNUM ARE LIFE INSURANCE LEADERS -- E*TRADE AND SCHWAB LEAD INVESTMENT SERVICE GROUP
by John Murphy,
Chief Technical Analyst, StockCharts.com
BOND YIELDS JUMP... Chart 1 shows the 10-Year Treasury Yield ($TNX) bouncing strongly today. That's partially the result of stronger economic news this week combined with higher inflation. The Consumer Price Index (CPI) for April saw the biggest gain in three years. Most of that came from rising...
READ MORE
MEMBERS ONLY
AIRLINE SELLING HAS WEIGHED ON TRANSPORTS -- BUT THAT MAY BE IMPROVING -- DELTA AND UAL BOUNCE OFF FEBRUARY LOWS -- SOUTHWEST AIR SHOWS RELATIVE STRENGTH -- OIL SERVICE ETF BOUNCES OFF MOVING AVERAGES
by John Murphy,
Chief Technical Analyst, StockCharts.com
TRANSPORTS SHOW SHORT-TERM WEAKNESS... One of the market's short-term problems has been the recent downturn in transportation stocks. The daily bars in Chart 1 show the Dow Jones Transportation Average ($TRAN) slipping below its April low and trading under its moving average lines. So far, the decline has...
READ MORE
MEMBERS ONLY
BIOTECHS PULL HEALTHCARE AND NASDAQ LOWER -- BIOGEN AND GILEAD ARE BIG CAP LOSERS -- SKYWORKS SOLUTIONS AND NETFLIX LEAD QQQ LOWER -- APPLE FALLS TO NEW LOW -- NASDAQ FAILURE THREATENS UPTRENDS IN DOW AND S&P 500
by John Murphy,
Chief Technical Analyst, StockCharts.com
BIOTECHS PULL HEALTHCARE LOWER ... Healthcare is one of the day's weakest sectors. Chart 1 shows the Health Care SPDR (XLV) pulling back to retest its 50- and 200-day moving averages. Its relative strength line (top of chart) has starting to slip as well. Biotechs are the main drag...
READ MORE
MEMBERS ONLY
TECHNOLOGY SPDR TRIES TO BOUNCE AT KEY CHART SUPPORT -- BIG TECH STOCKS TESTING 200-DAY LINES ARE CISCO, GOOGLE, AND MICROSOFT -- FACEBOOK HITS NEW HIGH, WHILE APPLE TESTS CRITICAL CHART SUPPORT
by John Murphy,
Chief Technical Analyst, StockCharts.com
TECHNOLOGY SPDR BOUNCES OFF 200-DAY LINE ... The technology sector has been one of the market's weakest sectors over the last month. That, however, may be changing for the better. The daily bars in Chart 1 show the Technology Sector SPDR (XLK) bouncing off of its 200-day moving average...
READ MORE