MEMBERS ONLY
DAX AND DOW BOUNCE AS EU SUMMIT WINDS DOWN -- THE NOOSE NARROWS AS GOLD CONTINUES TO CONSOLIDATE -- GOLD MINERS ETF FILLS GAP WITH FALLING WEDGE -- BASE METALS ETF FORMS TRIANGLE WITHIN DOWNTREND -- SPOT CRUDE HITS RESISTANCE AT KEY RETRACEMENT
by John Murphy,
Chief Technical Analyst, StockCharts.com
DAX AND DOW BOUNCE AS EU SUMMIT WINDS DOWN... Link for todays video. European stocks were higher on Friday as the EU summit winds down. Success or failure depends on one definitions and expectations. Regardless of the outcome, stocks in the US and Europe moved higher Friday. Chart 1 shows...
READ MORE
MEMBERS ONLY
GLOBAL STOCKS AND COMMODITIES REMAIN HOSTAGE TO WEAK EURO -- FALLING BOND YIELDS WEIGH ON STOCKS -- A LOT OF 200-DAY AVERAGES ARE BEING TESTED -- RECENT DRUG BREAKOUTS INCLUDE BRISTOL MYERS SQUIBB AND LILLY
by John Murphy,
Chief Technical Analyst, StockCharts.com
FALLING EURO WEIGHS ON STOCKS AND COMMODITIES ... The most important market of the day remains the Euro. That's because the European currency has become the proxy for how things are going in Europe. Unfortunately, the chart picture isn't that encouraging. Chart 1 shows the Euro trading...
READ MORE
MEMBERS ONLY
DIA AND IWM STALL AFTER BIG MOVES -- REVIEWING DIFFERENT HEAD-AND-SHOULDERS PATTERNS -- QQQ TRACES OUT INVERSE HEAD-AND-SHOULDERS PATTERN -- RETAIL HOLDRS HITS 52-WEEK HIGH WITH STRONG SCTR -- WAL-MART AND HOME DEPOT POWER RTH HIGHER
by John Murphy,
Chief Technical Analyst, StockCharts.com
DIA AND IWM STALL AFTER BIG MOVES... Link for todays video. The stock market appears to be holding its breadth as the European summit and European Central Bank (ECB) policy statement loom later this week. The late November surges are holding, but resistance levels are coming into play. The Dow...
READ MORE
MEMBERS ONLY
GOLD MOVES LOWER DESPITE STRENGTH IN STOCKS -- TREASURIES FALL AS RISK-ON TRADE TAKES HOLD -- NYSE NET NEW HIGHS SLOWLY STRENGTHEN -- NASDAQ NET NEW HIGHS ARE SLOW TO IMPROVE -- P&F DOUBLE TOP BREAKOUT VERSUS DOUBLE BOTTOM BREAKDOWN
by John Murphy,
Chief Technical Analyst, StockCharts.com
GOLD MOVES LOWER DESPITE STRENGTH IN STOCKS... Link for todays video. For whatever reason, stocks and gold have been positively correlated since late September. It is a strange pairing, but chart 1 confirms this relationship. The first indicator window shows the Gold SPDR (GLD) in red and the S&...
READ MORE
MEMBERS ONLY
STOCK RALLY STALLS AT 200-DAY AVERAGE - EURO DROP ON FRIDAY MAY EXPLAIN WHY - COMMODITIES BOUNCE REMAINS BELOW RESISTANCE
by John Murphy,
Chief Technical Analyst, StockCharts.com
STOCK RALLY STALLS AT 200-DAY AVERAGE... This past week's impressive stock rally ran into some profit-taking on Friday just shy of 200-day moving averages. Charts 1 and 2 show the S&P 500 and the Nasdaq Composite closing near the their daily lows after nearing that important...
READ MORE
MEMBERS ONLY
STOCK RALLY STALLS AT 200-DAY AVERAGE -- EURO DROP ON FRIDAY MAY EXPLAIN WHY -- COMMODITIES BOUNCE REMAINS BELOW RESISTANCE -- 70% OF NYSE STOCKS ARE BACK ABOVE 50-DAY LINES -- BOND YIELDS DON'T KEEP PACE WITH STOCK RALLY -- WATCH EUROPEAN BONDS FOR CLUES
by John Murphy,
Chief Technical Analyst, StockCharts.com
STOCK RALLY STALLS AT 200-DAY AVERAGE... This past week's impressive stock rally ran into some profit-taking on Friday just shy of 200-day moving averages. Charts 1 and 2 show the S&P 500 and the Nasdaq Composite Indexex closing near their daily lows after nearing that important...
READ MORE
MEMBERS ONLY
S&P 500 ETF BREAKS RAFF REGRESSION CHANNEL RESISTANCE -- TARZAN MARKET CONTINUES WITH WIDE SWINGS -- ABC CORRECTION TARGETS MOVE TO SUMMER HIGHS -- PRESIDENTIAL CYCLE AND FOURTH YEAR CYCLE ARE BULLISH -- SIX-MONTH CYCLE TURNED BULLISH IN NOVEMBER
by John Murphy,
Chief Technical Analyst, StockCharts.com
S&P 500 ETF BREAKS RAFF REGRESSION CHANNEL RESISTANCE... Link for todays video. Chart 1 shows the S&P 500 ETF (SPY) with a Raff Regression Channel defining the November downswing. I showed this chart with a falling flag on Wednesday and labeled last weeks dip below 118...
READ MORE
MEMBERS ONLY
STAPLES SPDR HITS NEW RECORD -- STAPLE LEADERS INCLUDE COSTCO, SARA LEE, AND TYSON -- HEALTHCARE LEADERS INCLUDE MEDTRONIC AND QUEST DIAGNOSTICS -- PFIZER CONTINUES TO SHOW NEW LEADERSHIP -- ABBOTT LABS NEARS RECORD
by John Murphy,
Chief Technical Analyst, StockCharts.com
CONSUMER STAPLES SPDR HITS RECORD HIGH ... Despite the renewed optimism arising from yesterday's strong market rally, defensive stocks are still showing relative strength and strong chart action. The best performers are consumer staples. Chart 1 shows the Consumer Staples Sector SPDR (XLP) trading at a new record high....
READ MORE
MEMBERS ONLY
FINANCE SECTOR SOARS ON CENTRAL BANK ACTION -- REGIONAL BANKS OUTPERFORMING BIG BANKS -- S&P 500 ETF SURGES ABOVE BROKEN SUPPORT -- QQQ CONTINUES TO SHOW RELATIVE WEAKNESS -- SEMICONDUCTOR HOLDRS SURGES ABOVE BROKEN SUPPORT
by John Murphy,
Chief Technical Analyst, StockCharts.com
FINANCE SECTOR SOARS ON CENTRAL BANK ACTION... Link for todays video. Stocks soared on Wednesday as five central banks lowered interest rates on dollar swaps. China also cut its reserve requirement for banks. A dollar swap is basically an emergency dollar loan to foreign banks. The European debt crisis created...
READ MORE
MEMBERS ONLY
BROKEN SUPPORT TURNS FIRST RESISTANCE FOR SPY -- QQQ AND IWM BOUNCE AFTER INVERTED HAMMERS -- SEMIS, INTERNET AND RETAIL ETFS SHOW RELATIVE WEAKNESS -- HOME CONSTRUCTION ISHARES HOLDS NOVEMBER LOW -- OIL SERVICE HOLDRS UNDERPERFORMS OIL
by John Murphy,
Chief Technical Analyst, StockCharts.com
BROKEN SUPPORT TURNS FIRST RESISTANCE FOR SPY... Link for todays video. Stocks moved sharply higher in early trading as rumors swirled that EU leaders were poised to deliver another rescue package. Recent history shows us that speculating on prospective deals or rumors is a lesson in futility. We can be...
READ MORE
MEMBERS ONLY
RISING DOLLAR HAS NEGATIVE IMPACT ON US STOCKS AND COMMODITIES -- IT'S ALSO CAUSING FOREIGN SHARES TO FALL FASTER -- WHILE TREASURIES RALLY, CORPORATE BONDS FALL WITH STOCKS -- DEFENSIVE LEADERSHIP IS ANOTHER BAD SIGN FOR MARKET
by John Murphy,
Chief Technical Analyst, StockCharts.com
RISING DOLLAR PUSHED GLOBAL STOCKS AND COMMODITIES LOWER... Stocks and commodities fell together this week. That isn't surprising since both asset classes have been positively correlated all year. Chart 1 shows the S&P 500 ending the week at a two-month low and well below both moving...
READ MORE
MEMBERS ONLY
TREASURIES AND DOLLAR LEAD SAFE-HAVEN TRADE -- GOLD FIRMS DESPITE THE PLUNGE IN STOCKS -- LONG-TERM RATES REVISIT 2008 LEVELS -- ELLIOTT WAVE COUNT POINTS TO 3 OF 3 FOR S&P 500 -- HAPPY THANKSGIVING!
by John Murphy,
Chief Technical Analyst, StockCharts.com
TREASURIES AND DOLLAR LEAD SAFE-HAVEN TRADE... Link for todays video. November is turning out to be as risk-off as October was risk-on. Stocks, the Euro and oil surged in October as the financial markets embraced risk. Confidence started to waver at the end of October and turned completely risk-adverse the...
READ MORE
MEMBERS ONLY
MOVING AVERAGE TRENDS REMAIN BEARISH -- MORE THAN HALF NYSE STOCKS HAVE FALLEN BACK BELOW 50-DAY AVERAGES -- THE FACT THAT CONSUMER STAPLES ARE DOING BETTER THAN DISCRETIONARY STOCKS THIS YEAR IS A NEGATIVE WARNING
by John Murphy,
Chief Technical Analyst, StockCharts.com
50-DAY LINES REMAIN BELOW 200-DAY... One of the advantages of using moving averages is that they simplify the study of market trends. They tell us the current trend of the market and what needs to happen to reverse that trend. A comparison of 50- and 200-day moving averages is a...
READ MORE
MEMBERS ONLY
S&P 500 ETFS BREAK SUPPORT WITH SHARP DECLINE -- STRONG DOLLAR IS NEGATIVE FOR STOCKS AND POSITIVE FOR TREASURIES -- GOLD REVERSES AT KEY RETRACEMENT -- STRONG DOLLAR WEIGHS ON SILVER
by John Murphy,
Chief Technical Analyst, StockCharts.com
S&P 500 ETFS BREAK SUPPORT WITH SHARP DECLINE... Link for todays video. The S&P 500 ETF (SPY) and the Rydex S&P Equal Weight ETF (RSP) both broke support with sharp declines early Monday. SPY is based on the traditional S&P 500, which...
READ MORE
MEMBERS ONLY
LONGER-TERM INDICATORS ARE STILL NEGATIVE
by John Murphy,
Chief Technical Analyst, StockCharts.com
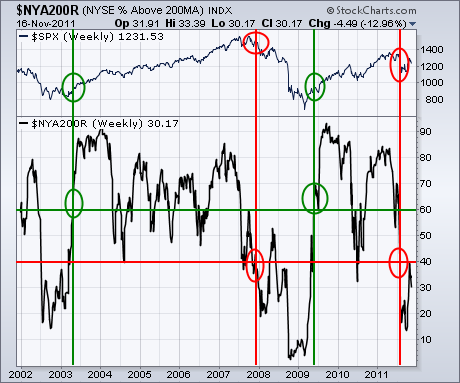
I'm going to focus on some longer term indicators today. And, right now, the ones I'm looking at still warrant a lot of caution. Chart 1, for example, shows the % NYSE stocks trading above their 200-day moving average ($NYA200R). Generally speaking, the line has to be...
READ MORE
MEMBERS ONLY
RUSSELL 2000 ETF TURNS BACK AT KEY RETRACEMENT -- S&P 500 ETF HITS RESISTANCE AT AUGUST SUPPORT BREAK -- XLK, XLY AND XLI HOLD OCTOBER BREAKOUTS -- RISING TREASURY PRICES ARE NEGATIVE FOR STOCKS
by John Murphy,
Chief Technical Analyst, StockCharts.com
RUSSELL 2000 ETF TURNS BACK AT KEY RETRACEMENT... Link for todays video. If the stock market were to decline 20% over the next six months, chartists would no doubt be able to look back and identify the bearish signals that led to this decline. This is called hindsight. The key,...
READ MORE
MEMBERS ONLY
GLOBAL STOCKS AND COMMODITIES FALL HARD -- SILVER LOSES 6% -- A LOT OF SUPPORT LEVELS WERE BROKEN -- AUSTRALIAN DOLLAR IS HARDEST HIT FOREIGN CURRENCY -- TREASURIES RISE WHILE CORPORATES FALL -- S&P 500 BREAKS CHART SUPPORT
by John Murphy,
Chief Technical Analyst, StockCharts.com
COMMODITIES FALL HARD AS WELL ... Stocks and commodities both fell pretty hard today all around the world. Chart 1 shows the Commodities Tracking Fund (DBC) falling more than 2% to end back below its 50-day average. All commodity groups fell. The day's worst drop was seen in silver....
READ MORE
MEMBERS ONLY
LONGER-TERM INDICATORS ARE STILL NEGATIVE -- % NYSE STOCKS ABOVE 200-DAY AVERAGE STILL IN BEAR TERRITORY -- SO ARE WEEKLY AND MONTHLY MACD LINES -- TODAY'S BREAKING OF SUPPORT IS TURNING SHORT-TERM TREND LOWER
by John Murphy,
Chief Technical Analyst, StockCharts.com
NYSE % ABOVE 200 MA STILL IN BEAR MARKET... I'm going to focus on some longer term indicators today. And, right now, the ones I'm looking at still warrant a lot of caution. Chart 1, for example, shows the % NYSE stocks trading above their 200-day moving average...
READ MORE
MEMBERS ONLY
IWM CHALLENGES PENNANT TRENDLINE -- FINANCE SECTOR SHOWS RELATIVE WEAKNESS -- FINANCE SPDR TESTS SUPPORT -- LIBOR MOVES SHARPLY HIGHER -- US AND UK STOCKS OUTPERFORMING EUROPEAN STOCKS -- GERMAN DAX HOLDS KEY SUPPORT LEVEL
by John Murphy,
Chief Technical Analyst, StockCharts.com
IWM CHALLENGES PENNANT TRENDLINE... Link for todays video. Stocks were mixed most of Wednesday, but small-caps were showing some relative strength with modest gains. Chart 1 shows the Russell 2000 ETF (IWM) breaking resistance in late October and then consolidating the last few weeks. There are reasons to expect resistance...
READ MORE
MEMBERS ONLY
OIL SERVICE HOLDRS AND TRANSPORT ISHARES FORM PENNANTS -- SEMIS AND REGIONAL BANKS CONTINUE SHOWING RELATIVE STRENGTH -- RETAILERS IN THE SPOTLIGHT ON TUESDAY -- NETWORKING ISHARES BREAKS DOUBLE BOTTOM RESISTANCE
by John Murphy,
Chief Technical Analyst, StockCharts.com
OIL SERVICE HOLDRS AND TRANSPORT ISHARES FORM PENNANTS... Link for todays video. With flat trading the last few weeks, a number of stocks and ETFs formed pennant or triangle consolidations. John Murphy noted this pattern in the S&P 500 on Friday. Pennants and triangles are usually continuation patterns...
READ MORE
MEMBERS ONLY
MARKETS END WEEK ON A STRONG NOTE -- S&P 500 STAYS IN TWO-WEEK TRADING RANGE -- TRIANGULAR SHAPE OF THAT RANGE SUGGESTS UPSIDE RESOLUTION -- HIGHER EUROPEAN SHARES ARE ALSO HELPING -- FALLING DOLLAR BOOSTS GOLD AND COMMODITIES
by John Murphy,
Chief Technical Analyst, StockCharts.com
S&P 500 STAYS IN SHORT-TERM CONSOLIDATION PATTERN ... The bars in Chart 1 pretty much tell the story of the week's trading. After all is said and done, very little changed from a trending standpoint. That has kept the S&P 500 in a two-week holding...
READ MORE
MEMBERS ONLY
ITALIAN BOND ETN PLUNGES TO NEW LOW -- ITALIAN INDEX FORMS BEARISH CONTINUATION PATTERN -- EURO 100 INDEX REMAINS HIGHLY CORRELATED TO S&P 500 -- RENKO CHARTS FILTER NOISE AND SHOW SUPPORT -- SPX BULLISH PERCENT REMAINS IN UPTREND
by John Murphy,
Chief Technical Analyst, StockCharts.com
ITALIAN BOND ETN PLUNGES TO NEW LOW... Link for todays video. The markets remain fixated on the European sovereign debt issues and, in particularly, Italian bond yields. While I cannot offer deeper insight into Italian politics, I can make a pretty good Bolognese and can analyze key charts pertaining to...
READ MORE
MEMBERS ONLY
STOCK RALLY IS IN JEOPARDY AS MARKETS FALL BACK BELOW 200-DAY AVERAGES -- TEST OF SUPPORT IS LIKELY -- RISING DOLLAR PUTS DOWNSIDE PRESSURE ON COMMODITIES -- US TREASURY BONDS ARE RALLYING
by John Murphy,
Chief Technical Analyst, StockCharts.com
S&P 500 BACK BELOW 200-DAY AVERAGE... This is a bad time for stocks to experience heavy selling. That's because the market has been struggling with its 200-day moving average which is the defining point between bull and bear markets. Evidence still suggests that the October rebound...
READ MORE
MEMBERS ONLY
SPIKE IN ITALIAN YIELDS CAUSES HEAVY SELLING IN EURO STOCKS -- US STOCKS EXPECTED TO OPEN SHARPLY LOWER -- THAT PUTS THE RECENT RALLY IN JEOPARDY
by John Murphy,
Chief Technical Analyst, StockCharts.com
50-DAY AVERAGES IN JEOPARDY AGAIN... Yesterday's optimism about the turn of events in Italy has proved to be very short-lived. Italian bond yields have spiked over 7% for the first time since the Euro was created. The breaking of that threshold is causing heavy selling of European stocks....
READ MORE
MEMBERS ONLY
WALMART NEARS TEST OF ALL-TIME HIGH -- CVS NEARS THREE-YEAR HIGH -- ELI LILLY NEARS 52-WEEK HIGH AND MAY BREAK SEVEN-YEAR DOWN TRENDLINE -- EAFE AND ITALY ISHARES BOUNCE OFF 50-DAY AVERAGE
by John Murphy,
Chief Technical Analyst, StockCharts.com
WALMART NEARS TEST OF 2008 HIGH... In my Market Message on October 20, I showed Wal Mart starting to catch fire for the first time in a long time. The big retailer was been showing new upside leadership in the market. That's not necessarily a good sign for...
READ MORE
MEMBERS ONLY
FOREIGN STOCK ETFS ARE THREATENING 50-DAY MOVING AVERAGES -- WHILE US INDEXES STRUGGLE WITH 200-DAY LINES -- 10 YEAR YIELD FALLS BELOW ITS 50-DAY LINE -- NEWMONT MINING NEARS RECORD HIGH -- PFIZER SHOWS NEW HEALTHCARE LEADERSHIP
by John Murphy,
Chief Technical Analyst, StockCharts.com
FOREIGN ETFS THREATEN 50-DAY AVERAGE... Foreign stocks have been acting worse than U.S. stocks over the past couple of weeks. Having recently failed tests of their 200-day averages, a number of foreign stock ETFs are retesting their 50-day lines. Chart 1 shows EAFE iShares (EFA) having gapped lower last...
READ MORE
MEMBERS ONLY
GOLD STOCKS START TO SHINE AGAIN
by John Murphy,
Chief Technical Analyst, StockCharts.com
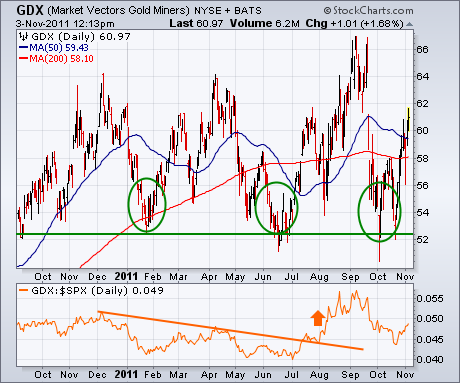
My Market Message from Tuesday of last week (October 25) wrote about new signs of strength emerging from an oversold gold-mining group. It showed the Market Vectors Gold Miners ETF (GDX) bouncing off chart support along its 2011 reaction lows (see circles in Figure 1). In Thursday's trading,...
READ MORE
MEMBERS ONLY
MARKING KEY SUPPORT LEVELS FOR THE OFFENSIVE SECTORS -- CONSUMER DISCRETIONARY SPDR HOLDS RESISTANCE BREAKOUT -- TECHNOLOGY SECTOR LAGGING THE PAST MONTH -- TREASURY BOND ETFS BREAK FALLING WEDGE RESISTANCE
by John Murphy,
Chief Technical Analyst, StockCharts.com
MARKING KEY SUPPORT LEVEL FOR THE OFFENSIVE SECTORS... Link for todays video. Earlier this week I noted that the Nasdaq 100 ETF, the Russell 2000 ETF and the S&P 500 ETF were testing broken resistance. The October surges produced breakouts and it was important that these resistance breakouts...
READ MORE
MEMBERS ONLY
GOLD STOCKS CONTINUE TO STRENGTHEN -- MORE THAN 50% ARE NOW IN UPTRENDS -- GOLD LEADERS ARE RANDGOLD, IAMGOLD, AND ROYAL GOLD -- NEWMONT MINING HAS BEEN SHOWING NEW RELATIVE STRENGTH OF LATE AND MAY PROVIDE GOOD GOLD VALUE
by John Murphy,
Chief Technical Analyst, StockCharts.com
GOLD STOCKS START TO SHINE AGAIN... My Market Message from Tuesday of last week (October 25) wrote about new signs of strength emerging from an oversold gold-mining group. It showed the Market Vectors Gold Miners ETF (GDX) bouncing off chart support along its 2011 reaction lows (see circles in Figure...
READ MORE
MEMBERS ONLY
NASDAQ 100 ETF TESTS IMPORTANT SUPPORT LEVEL -- INTERNET ETF STALLS AT KEY RETRACEMENT -- ELLIOTT WAVE COUNTS SUGGESTS ABC CORRECTION UNDERWAY IN $SPX -- SETTING HEIKIN-ASHI SUPPORT FOR SPY -- GOLD HOLDS RESISTANCE BREAKOUT
by John Murphy,
Chief Technical Analyst, StockCharts.com
NASDAQ 100 ETF TESTS IMPORTANT SUPPORT LEVEL... Link for todays video. Chart 1 shows the Nasdaq 100 ETF (QQQ) testing support from the mid October lows. Support there stems from two spike lows in October and Tuesdays low. This is an important test because a support break here would reverse...
READ MORE
MEMBERS ONLY
GREEK DEBT REFERENDUM SENDS GLOBAL STOCKS AND COMMODITIES TUMBLING -- BONDS ARE ONLY WINNERS -- GERMAN AND FRENCH SHARES NEGATE LAST THURSDAY'S UPSIDE ACTION -- U.S. STOCK INDEXES FALL BACK BELOW THEIR 200-DAY AVERAGE
by John Murphy,
Chief Technical Analyst, StockCharts.com
EUROPEAN STOCKS TUMBLE ... The surprise announcement that Greece will hold a voter referendum on the European bailout plan has thrown the entire rescue plan into doubt and has unsettled global markets. European shares tumbled on the news and everyone else with them. Charts 1 and 2 show French and German...
READ MORE
MEMBERS ONLY
STOCKS GIVE UP MOST OF THURSDAYS SURGE WITH SHARP DECLINE -- UTILITIES SECTOR HAS THE STRONGEST CHART -- EURO PLUNGES AS RUMOR BECOMES NEWS -- STRONG DOLLAR WEIGHS ON MATERIALS AND ENERGY SECTORS -- FRENCH AND GERMAN INDICES FOLLOW EURO LOWER
by John Murphy,
Chief Technical Analyst, StockCharts.com
STOCKS GIVE UP MOST OF THURSDAYS SURGE WITH SHARP DECLINE... Link for todays video. Stocks took it on the chin Monday with a broad decline that affected all sectors. The Euro kicked things off with a sharp decline. This move put the market in risk-off mode, which means money moves...
READ MORE
MEMBERS ONLY
NETWORKING ISHARES BREAKS DOUBLE BOTTOM RESISTANCE -- HIGH YIELD BOND ETFS CHALLENGE SUMMER HIGHS -- BREADTH IMPROVES AS NEW 52-WEEK HIGHS EXPAND -- NASDAQ AND NYSE AD VOLUME LINES BREAK RESISTANCE
by John Murphy,
Chief Technical Analyst, StockCharts.com
NETWORKING ISHARES BREAKS DOUBLE BOTTOM RESISTANCE... Link for todays video. Chart 1 shows the Networking iShares (IGN) gapping up and breaking Double Bottom resistance with a surge above 29. I showed this chart on August 5th as the ETF had just formed a big bullish engulfing at support. IGN extended...
READ MORE
MEMBERS ONLY
EURO DEBT DEAL AND STRONG GDP REPORT GIVE BIG BOOST TO GLOBAL STOCKS -- EUROPE LEADS RALLY -- DOLLAR DROP BOOSTS COMMODITIES AS BONDS DROP -- S&P 500 IS TESTING 200-DAY AVERAGE
by John Murphy,
Chief Technical Analyst, StockCharts.com
EURO DEAL GIVE GIVE BOOST TO EUROPEAN MARKETS ... The overnight announcement of a Euro debt deal is giving a huge boost to global stocks this morning. The biggest gains are in Europe. Chart 1 shows the Euro surging 1.6% to move back above its 200-day average. Chart 2 shows...
READ MORE
MEMBERS ONLY
QQQ SHOWS RELATIVE WEAKNESS -- RSI STALLS IN RESISTANCE ZONE FOR QQQ -- SPY TESTS DOUBLE BOTTOM BREAKOUT -- GOLD SURGES OFF LONG-TERM SUPPORT -- GLD NEGATES BEAR FLAG WITH UPSIDE BREAKOUT -- SILVER ETF MOVES ABOVE RESISTANCE
by John Murphy,
Chief Technical Analyst, StockCharts.com
QQQ STARTS SHOWING RELATIVE WEAKNESS ... Link for todays video. The Nasdaq 100 ETF (QQQ) was a market leader from June to September, but is turning into a market laggard here in October. Chart 1 shows QQQ surging off support in early October with a move above 58. The ETF was...
READ MORE
MEMBERS ONLY
DOW AND NASDAQ STRUGGLE WITH RESISTANCE AT THEIR 200-DAY AVERAGES -- TODAY'S GOLD BUYING MAY BE TIED TO STOCK SELLING -- GOLD MINER ETF IS BOUNCING OFF CHART SUPPORT AT ITS SUMMER LOW
by John Murphy,
Chief Technical Analyst, StockCharts.com
IMPORTANT TEST OF RESISTANCE... Charts 1 and 2 show the Dow Industrials and Nasdaq Composite Index struggllng with important resistance at their 200-day averages. The fact that those resistance lines are declining makes them even more formidable resistance (a declining 200-day line is more negative than a rising 200-day line)...
READ MORE
MEMBERS ONLY
IWM AND MDY BREAK CONSOLIDATION RESISTANCE -- INDUSTRIALS SPDR EXCEEDS PRIOR HIGHS -- INTERNET ETF SURGES THROUGH FLAG RESISTANCE -- OIL FOLLOWS STOCKS HIGHER AS WTI MOVES ABOVE $90 -- TREASURY ETFS FIRM DESPITE RISK-ON ENVIRONMENT
by John Murphy,
Chief Technical Analyst, StockCharts.com
IWM AND MDY BREAK CONSOLIDATION RESISTANCE... Link for todays video. The S&P 500 ETF and Dow Industrials SPDR broke consolidation resistance last week. Not to be left behind, the Russell 2000 ETF (IWM) and S&P MidCap 400 SPDR (MDY) followed suit with breakouts on Monday. With...
READ MORE
MEMBERS ONLY
SPY AND DIA MAKE BREAKOUT BIDS -- CONSUMER DISCRETIONARY SECTOR LEADS HIGHER -- STEEL ETF AND AIRLINE ETF FORM FLAG CONSOLIDATIONS -- HOMEBUILDING ETFS GO FROM LAGGARDS TO LEADERS
by John Murphy,
Chief Technical Analyst, StockCharts.com
SPY AND DIA MAKE BREAKOUT BIDS... Link for todays video. Stocks came charging out of the gates on Friday with the Dow Industrials SPDR (DIA) and the S&P 500 ETF (SPY) making breakout bids. Chart 1 shows DIA gapping above 116 on the open in a bid to...
READ MORE
MEMBERS ONLY
EMERGING MARKET ISHARES FAIL TEST OF 50-DAY LINE WHILE S&P 500 AND NASDAQ BACK OFF FROM RESISTANCE BARRIERS -- CONSUMER DISCRETIONARY SPDR STALLS AT 200-DAY LINE -- WAL MART NEARS 52-WEEK HIGH AND IS CONSUMER STAPLE LEADER
by John Murphy,
Chief Technical Analyst, StockCharts.com
EMERGING MARKET RALLY DISAPPOINTS... Two Thursdays ago (October 6) I showed Emerging Market iShares (EEM) scoring an upside weekly reversal from important support at its mid-2010 low. I took that as one of the signs that the global selloff was putting in a fourth quarter bottom. Since then, however, the...
READ MORE
MEMBERS ONLY
SMALL-CAPS SHOW RELATIVE WEAKNESS -- BROKEN RESISTANCE TURNS FIRST SUPPORT FOR XLY -- TECH SPDR FORMS EXHAUSTION GAP -- BASE METALS ETF TURNS DOWN AFTER SHORT BOUNCE -- BASIC MATERIALS SPDR IS HIGHLY CORRELATED TO BASE METALS
by John Murphy,
Chief Technical Analyst, StockCharts.com
SMALL AND MID-CAPS CONTINUE TO SHOW RELATIVE WEAKNESS... Link for todays video. With the August-September trading range, the peaks in late August and mid September established resistance levels for the major index ETFs. The S&P 500 ETF (SPY) edged above these highs with a close above 122 on...
READ MORE