MEMBERS ONLY

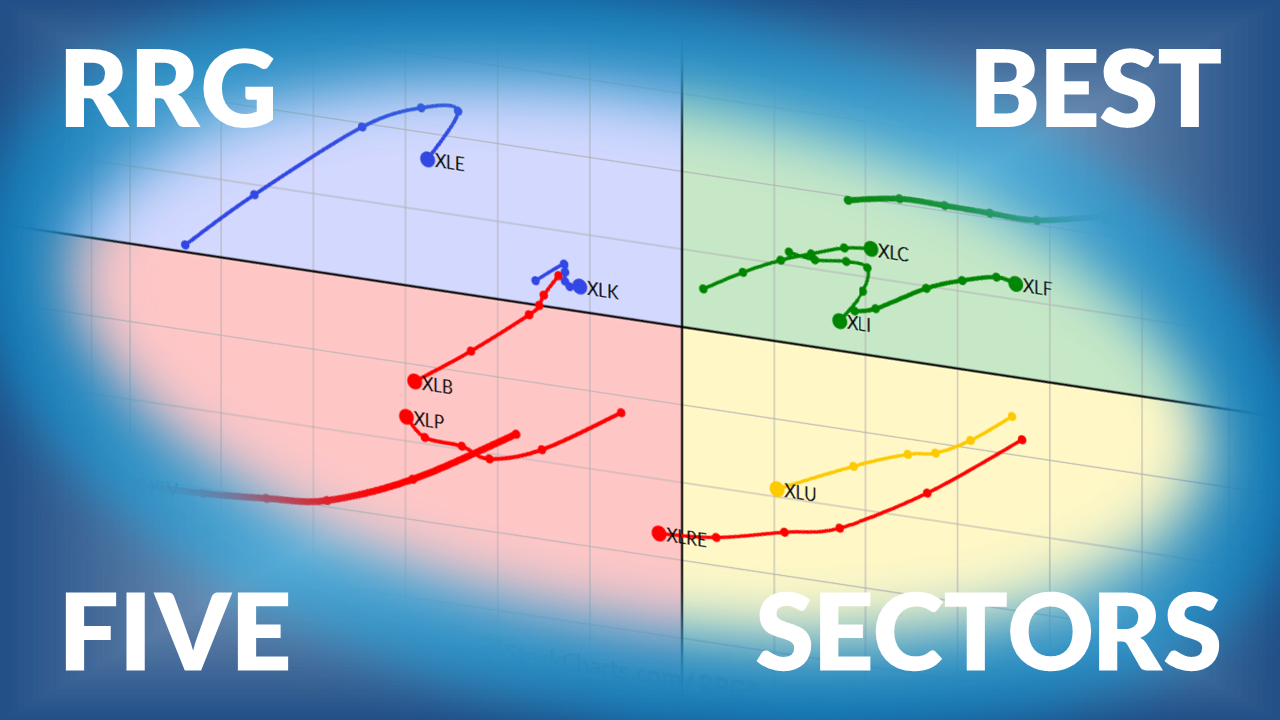
The Best Five Sectors This Week #58

Julius de Kempenaer presents his weekly update on US sector rotation using Relative Rotation Graphs.... READ MORE
Julius de Kempenaer presents his weekly update on US sector rotation using Relative Rotation Graphs.... READ MORE

A subtle but important shift is unfolding beneath the surface of the market. Follow along as Julius de Kempenaer breaks down where leadership is quietly emerging and where weakness still hasn’t resolved.... READ MORE

Julius de Kempenaer presents his weekly stock market update on sector rotation using Relative Rotation Graphs.... READ MORE

Julius presents his weekly sector rotation update based on Relative Rotation Graphs.... READ MORE

When most investors use Relative Rotation Graphs (RRGⓇ), they often focus on stocks or ETFs that are sitting in the Leading quadrant. But, by the time a security is deep in the Leading quadrant, most of the move may be over. In this video, Julius de Kempenaer explains why the... READ MORE

Weekly update on sector rotation for US sectors using Relative Rotation Graphs®.... READ MORE

Julius presents his weekly update on Sector Rotation for US sectors using Relative Rotation Graphs.... READ MORE
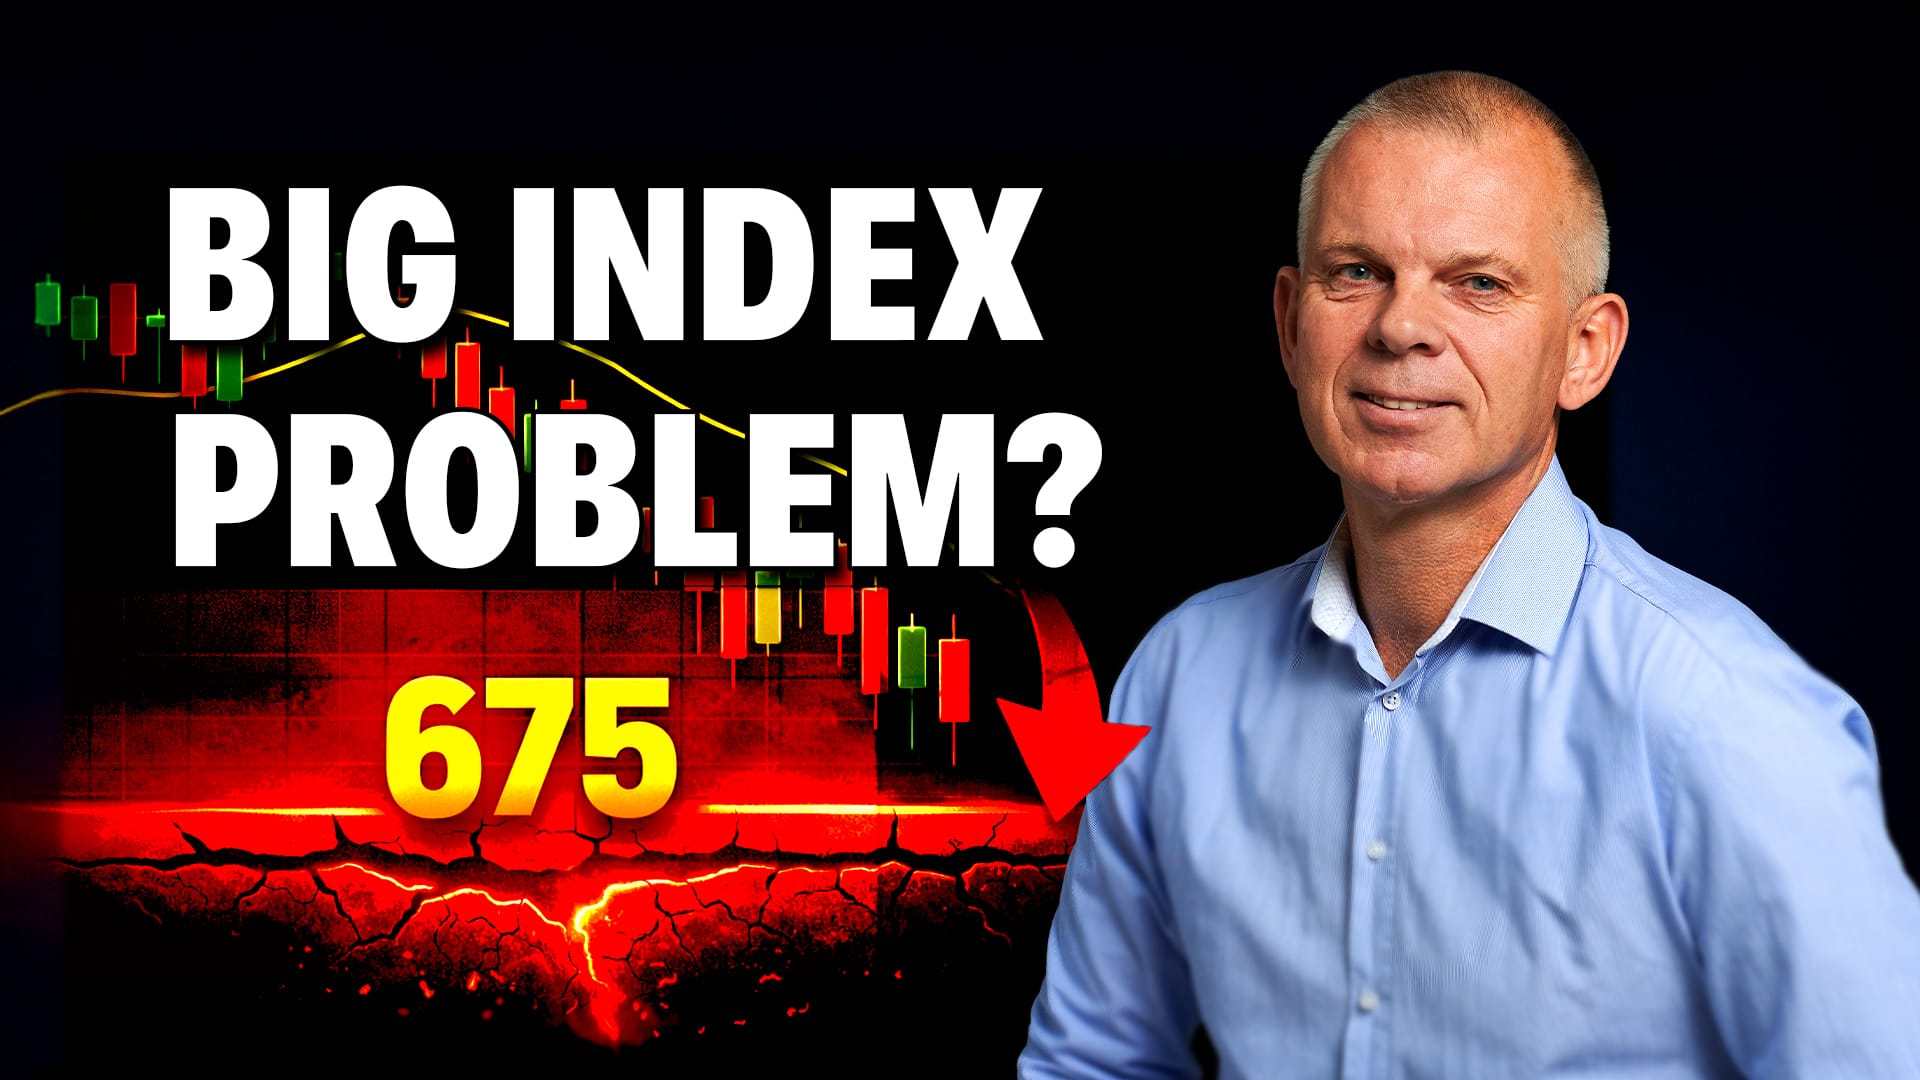
Commodities remain strong, but the S&P 500 is facing pressure from weakening large-cap sectors. In this video, Julius de Kempenaer walks through asset classes, bond maturities, and sector rotation to explain why momentum is fading — and why 675 on SPY matters more than 700.... READ MORE

Julius de Kempenaer presents his weekly update on sector rotation ranking using Relative Rotation Graphs.... READ MORE

Julius de Kempenaer presents his weekly update on sector rotation using Relative Rotation Graphs.... READ MORE

Julius de Kempenaer breaks down a real-world portfolio experiment from 2025 that shows how weighting decisions can dramatically change performance. See how equal- and cap-weight approaches produced very different results and why it matters for portfolio construction today.... READ MORE
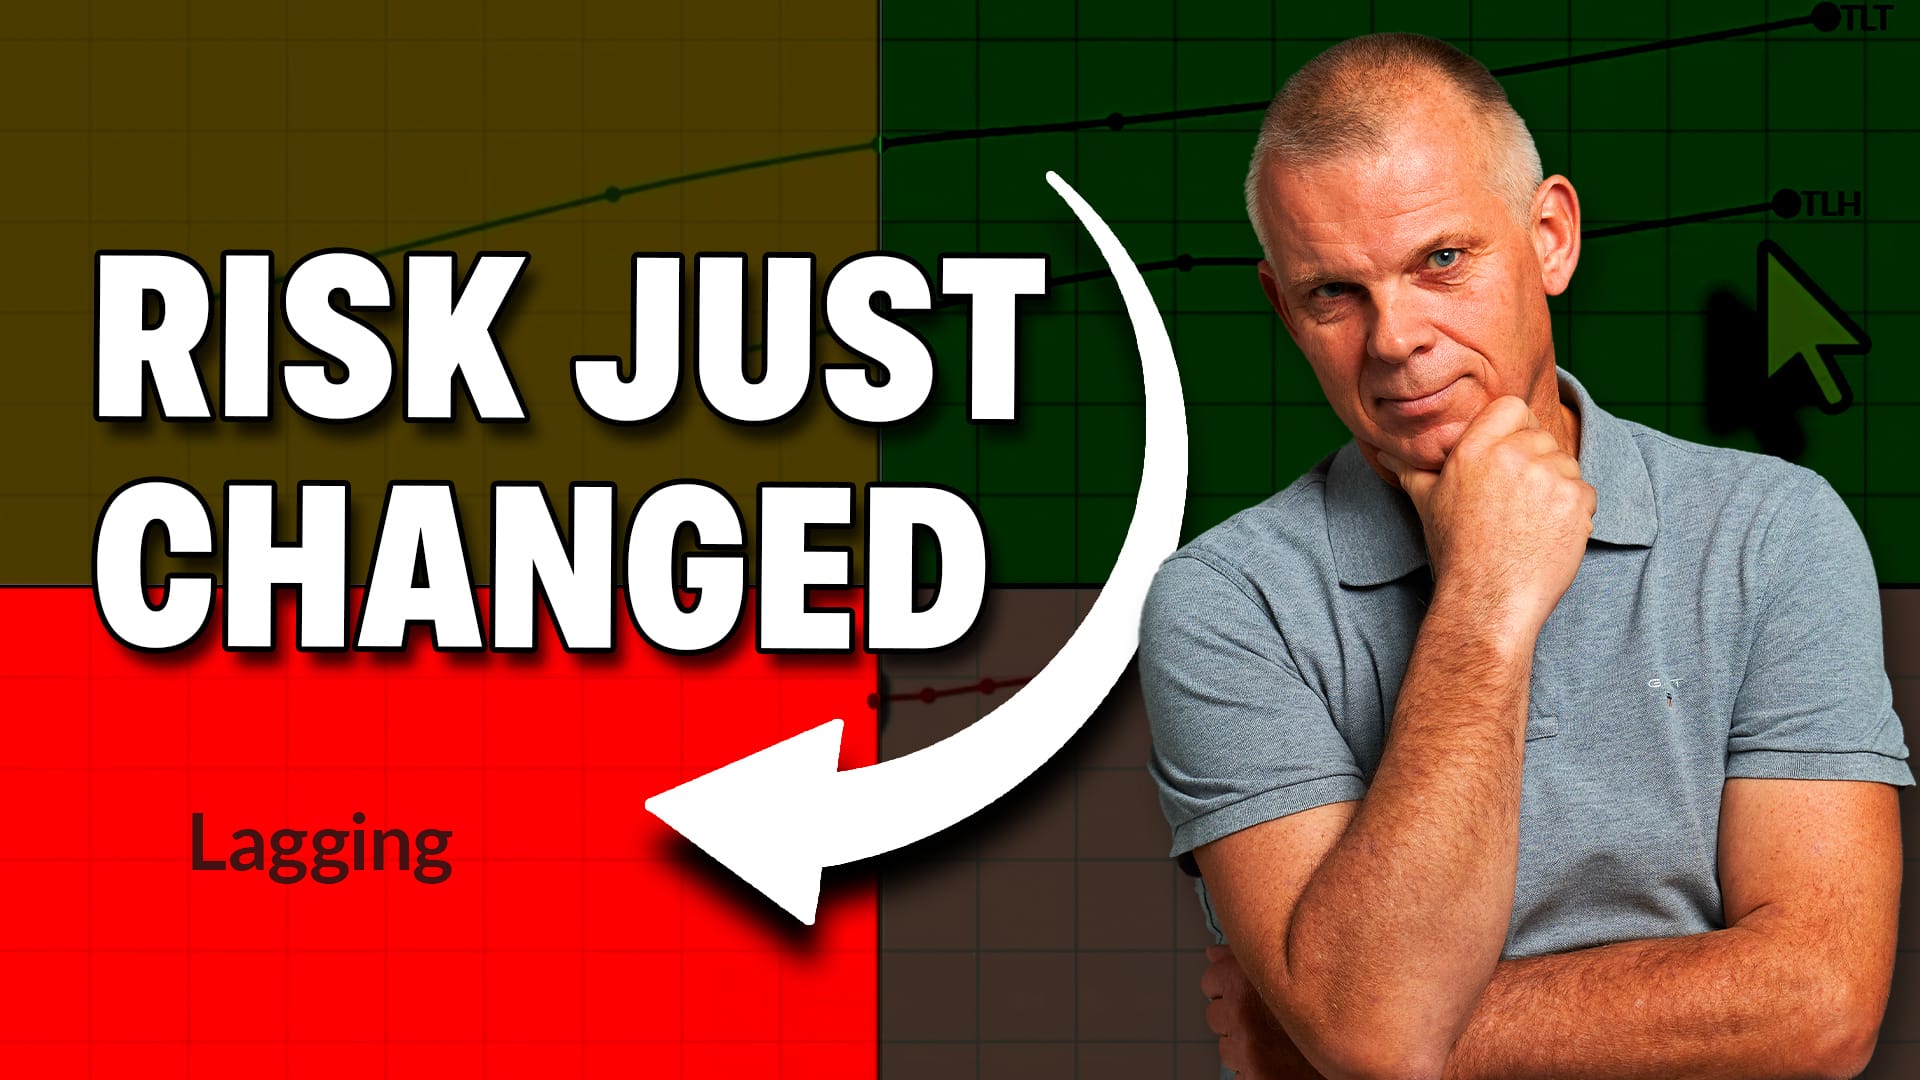
Stocks are trying to stabilize, but the charts tell a more complicated story. Julius de Kempenaer explains why recent technical damage could still limit upside, along with where strength is quietly building instead.... READ MORE

Weekly update on US sector ranking based on Relative Rotation Graphs.... READ MORE
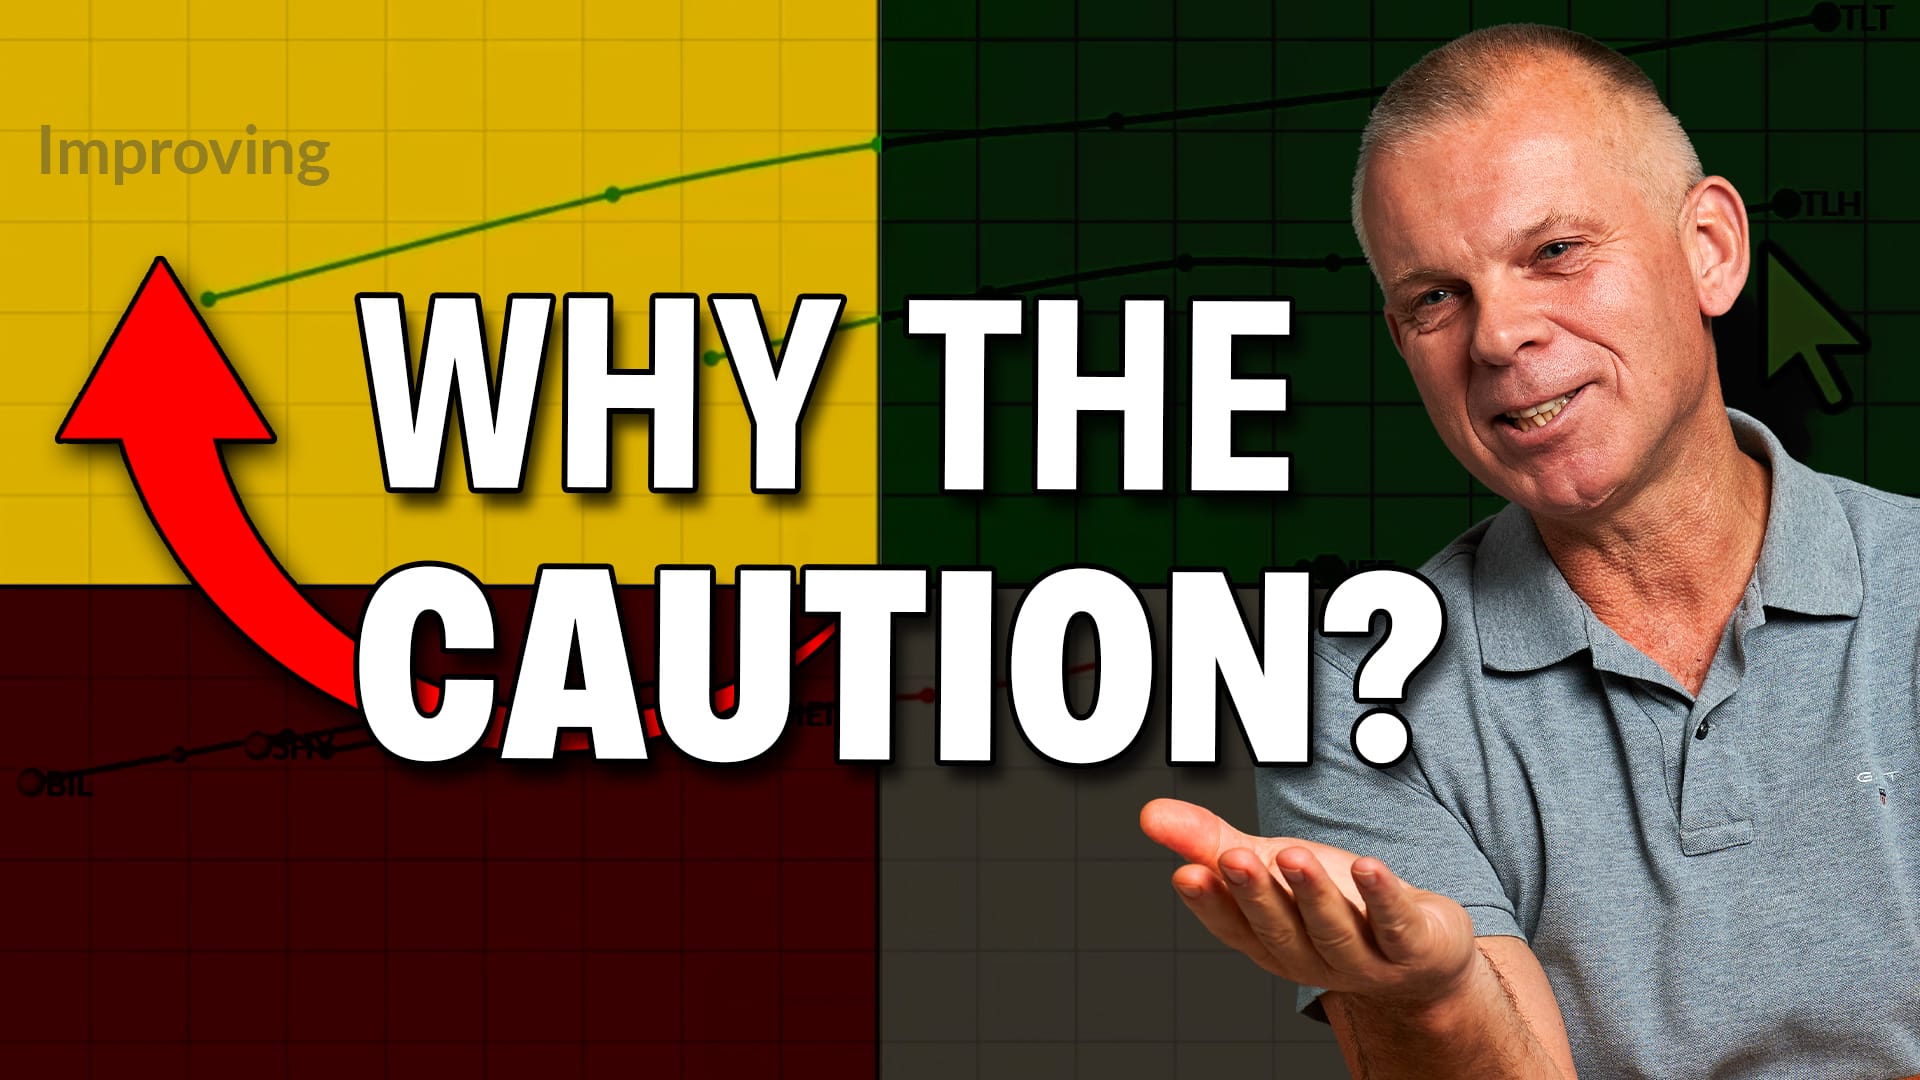
Stocks may be improving again, but the signals aren’t lining up cleanly just yet. Julius de Kempenaer explains what’s getting better, what’s still holding the market back, and why caution might be warranted here.... READ MORE

Weekly Sector Rotation Update for US Sectors based on Relative Rotation Graphs... READ MORE

Weekly update on U.S. sector rotation using Relative Rotation Graphs.... READ MORE

Weekly update on sector rotation ranking based on Relative Rotation Graphs... READ MORE
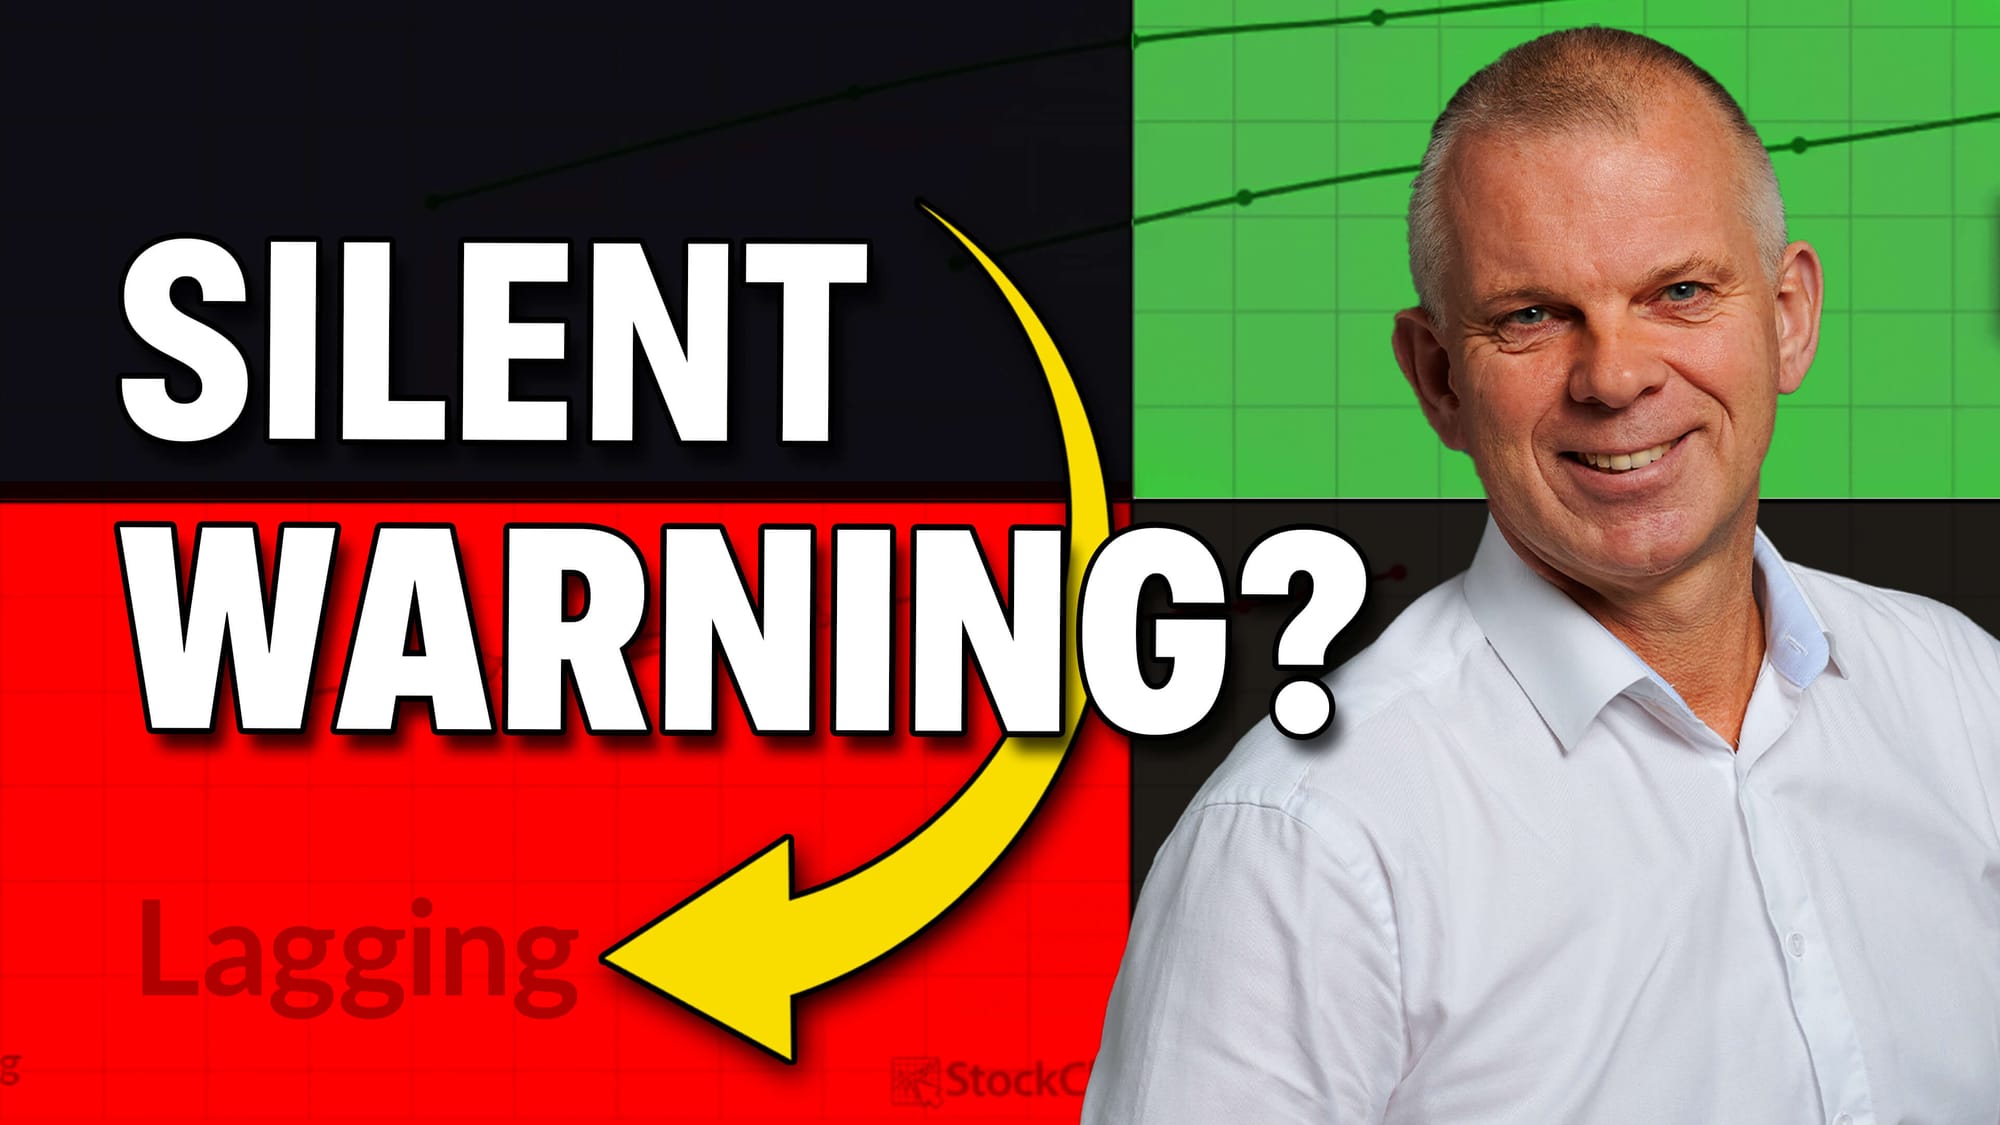
The market might look steady at first glance, but there's a subtle warning sign developing underneath. In this week's update, Julius de Kempenaer, the creator of RRG Charts, walks through the quiet deterioration happening across stock rotations and highlights the one group that's finally... READ MORE
Your weekly update on US sector rotation based on relative rotation graphs.... READ MORE

Weekly Update on Sector Ranking for US stocks based on Relative Rotation Graphs... READ MORE
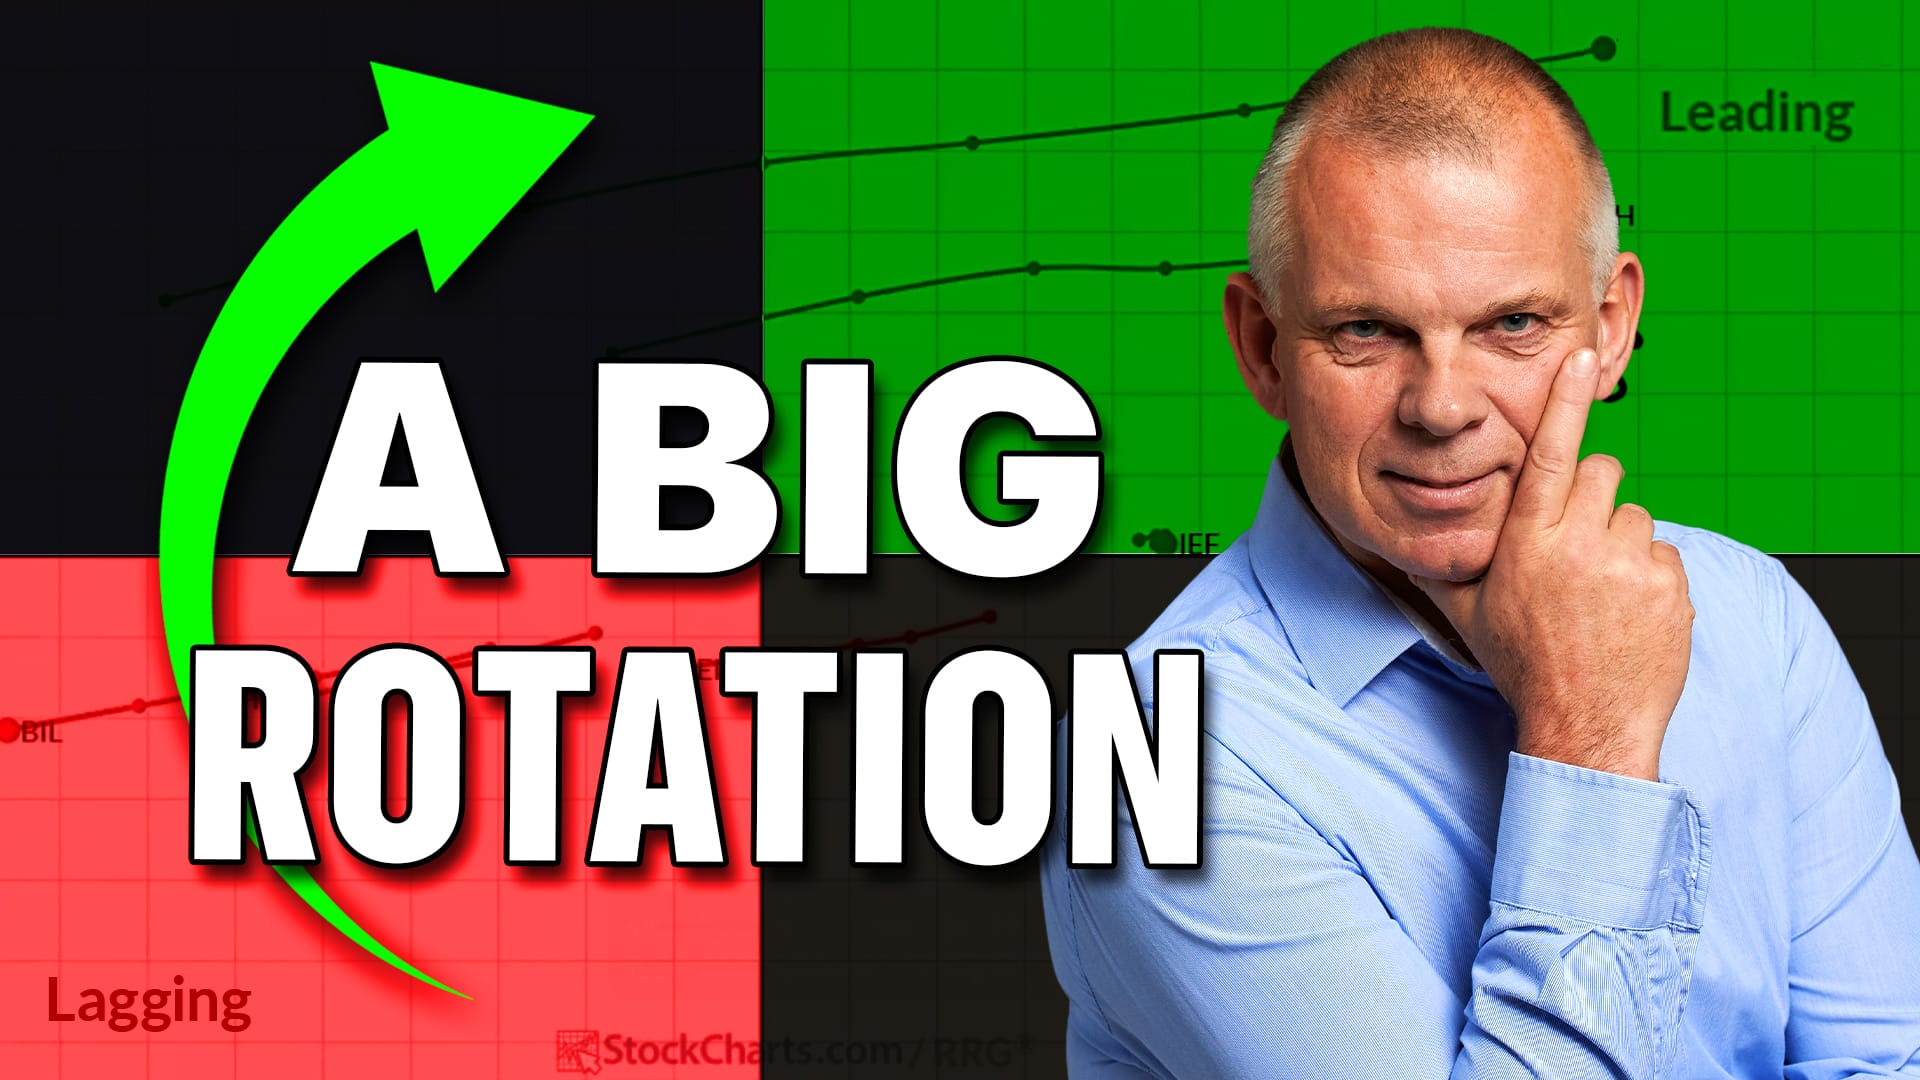
With a massive shift in market leadership underway, Julius de Kempenaer looks at sector rotation to see where leadership is moving now—and what that could mean for portfolio positioning ahead.... READ MORE

Your weekly update on the ranking of U.S. sectors based on Relative Rotation Graphs.... READ MORE

Julius presents his weekly update on US sector ranking based on Relative Rotation Graphs.... READ MORE
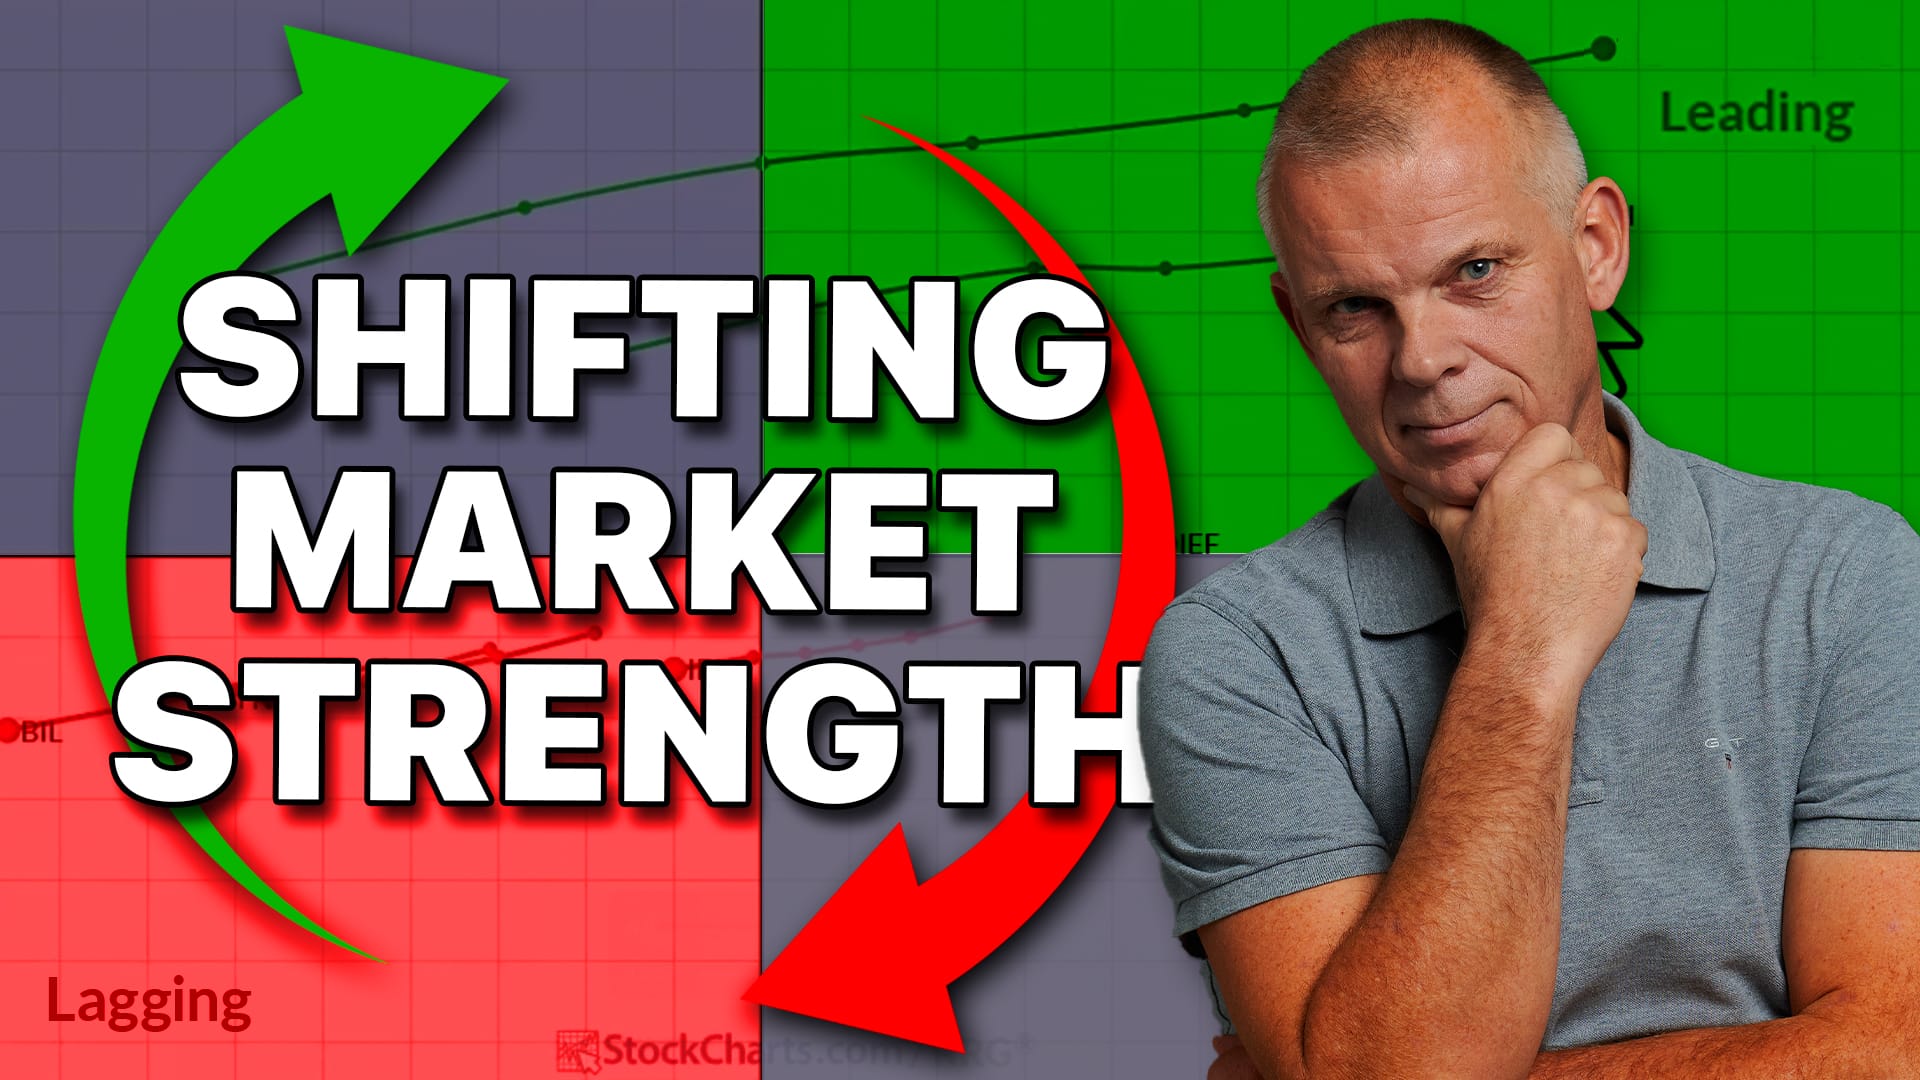
Julius builds on his new portfolio framework to reveal where market strength is shifting across asset classes and sectors. While stocks and commodities continue to lead, Julius breaks down the changes happening beneath the surface.... READ MORE

Julius presents his weekly update on ranking of US sectors based on Relative Rotation Graphs.... READ MORE

Weekly update on US sector rotation based on Relative Rotation Graphs.... READ MORE

Julius de Kempenaer reveals how to use Relative Rotation Graphs as a complete portfolio framework. Discover how his top-down approach can help you spot leadership shifts across stocks, bonds, and commodities.... READ MORE

Weekly update on Sector Rotation based on Relative Rotation Graphs... READ MORE


Grayson Roze hosts Tom Bowley and Julius de Kempenaer in a fast-paced StockCharts Game Show showdown! See who dominates in this fun, competitive battle of charting tools, trading terms, and quick wit.... READ MORE

Julius provides his weekly update on US Sector Rotation based on Relative Rotation Graphs.... READ MORE

Julius de Kempenaer, creator of RRG Charts, reveals why XLK & XLC remain the key market drivers while defensive sectors struggle. He also examines how asset class rotation still favors stocks over bonds—and what that means for investors watching sector leadership.... READ MORE

Your weekly update and ranking of US sectors based on Relative Rotation Graphs.... READ MORE

Julius presents his weekly update on US sector ranking based on Relative Rotation Graphs.... READ MORE

Weekly update on US sector rotation ranking based on Relative Rotation Graphs... READ MORE

Julius takes a look at the current sector rotation, in combination with growth-value and size rotation. Combining these Relative Rotation Graphs shows strength concentrating in large-cap growth and the Tech, Discretionary, and Communication Services sectors. From this vantage point, we can see continued strength for the S&P 500... READ MORE

Julius presents his weekly update on sector rotation using Relative Rotation Graphs.... READ MORE
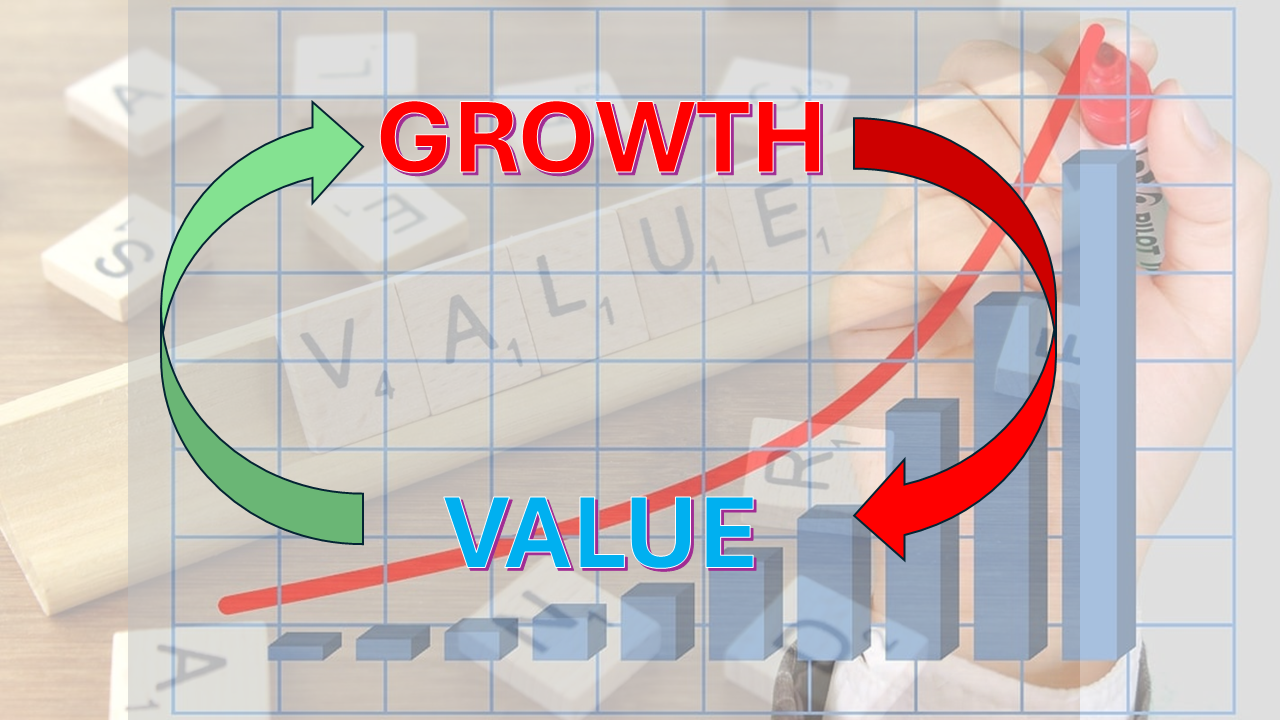
Growth and Value segments are widely used in the investment world, as investors shift from one to another based on market conditions and risk-appetite. Julius shows how to use Relative Rotation Graphs to help monitor these shifts.... READ MORE

Julius de Kempenaer presents his weekly update on the top five sectors on the leaderboard, and the movement under the surface.... READ MORE

Explore this week's sector rotation insights. See which sectors gained strength, which lost momentum, and what the RRG signals mean for investors.... READ MORE

What does it mean when a rotation on a Relative Rotation Graph fully completes on the right-hand side or the left-hand side of the graph... READ MORE