MEMBERS ONLY
Providers and Pharmaceuticals Looking Strong Inside Healthcare
by Julius de Kempenaer,
Senior Technical Analyst, StockCharts.com
My longer-term outlook for the general market is still based on a continuing uptrend. However, over the last few weeks, defensive sectors picked up on the Relative Rotation Graph against the S&P 500.
Of these three sectors, Healthcare (XLV) is the biggest in terms of market capitalization at...
READ MORE
MEMBERS ONLY
See the Growth -- Value Dance on Relative Rotation Graphs
by Julius de Kempenaer,
Senior Technical Analyst, StockCharts.com
One of the predefined universes/groups on the RRG page is for Growth/Value. Many investors look at this relationship to help them determine whether the market is in a risk-on or risk-off mode. Just pull down the "Groups" selection box and look for Growth / Value.
When browsing...
READ MORE
MEMBERS ONLY
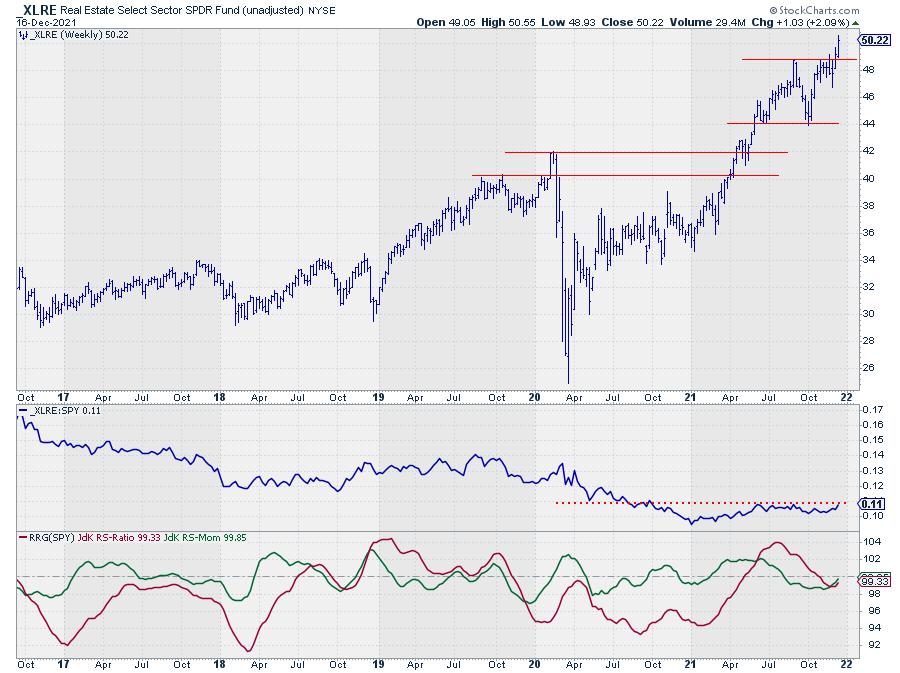
Industrial & Office REITs are Shining in the Real Estate Sector
by Julius de Kempenaer,
Senior Technical Analyst, StockCharts.com
Watching the rotation of the Real Estate sector (XLRE) on a Relative Rotation Graph shows the tail inside the lagging quadrant after a long rotation through leading and weakening.
Six weeks ago, XLRE moved into the lagging quadrant, but quite rapidly started to pick up relative momentum again, pushing the...
READ MORE
MEMBERS ONLY
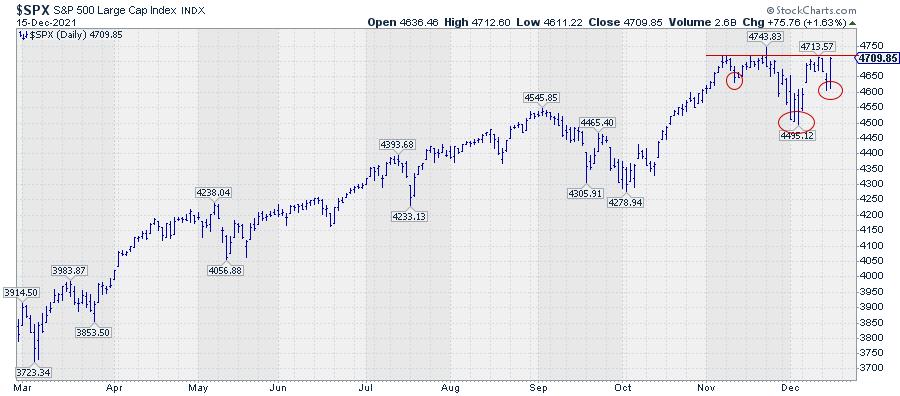
Is The S&P 500 Setting Up for a Break to New Highs?
by Julius de Kempenaer,
Senior Technical Analyst, StockCharts.com
After dipping to 4500, the development of a potential inverted head-and-shoulders pattern started to take shape on the price chart of the S&P 500.
The overhead resistance just above 4700 has already been developing since the market first reached that area at the start of November. Very recently,...
READ MORE
MEMBERS ONLY
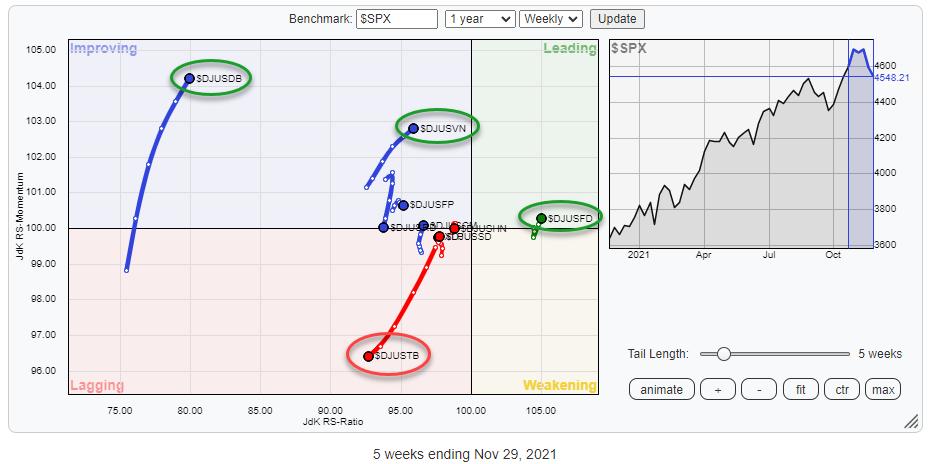
Sector Spotlight: US Leads Internationally and XLRE Stands Out
by Julius de Kempenaer,
Senior Technical Analyst, StockCharts.com
On this edition of StockCharts TV's Sector Spotlight, I take on the asset class and sector rotation as it played out last week. The relationship between stocks and bonds continues to be in favour for stocks while, at the sector level, Real Estate seems to be making an...
READ MORE
MEMBERS ONLY
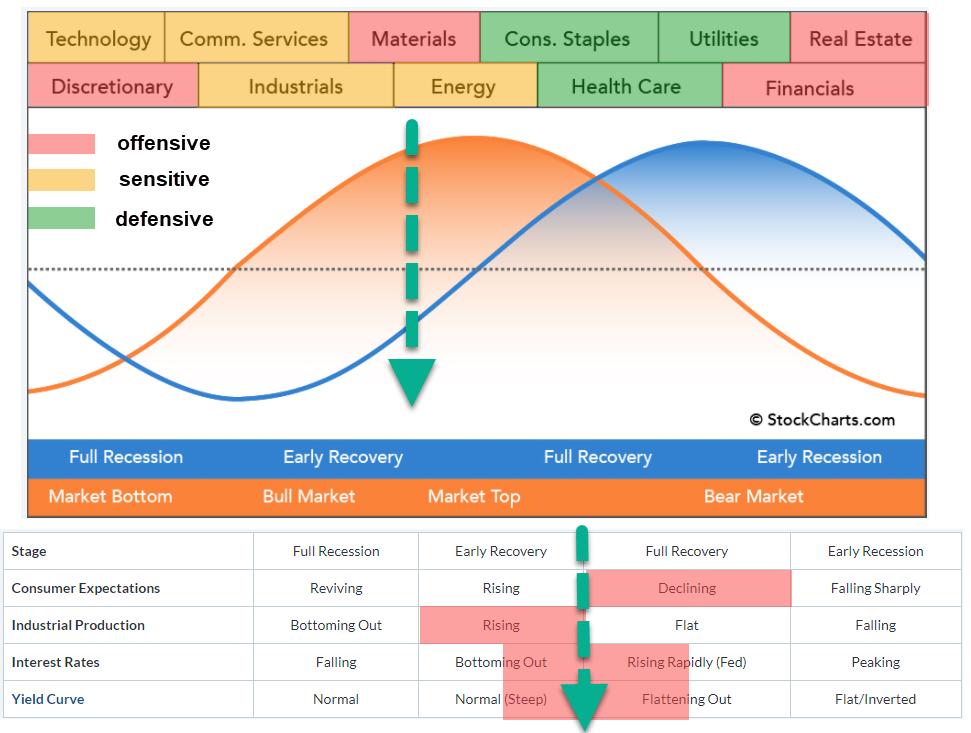
Sector Rotation Model Suggests There's Still Upside Available
by Julius de Kempenaer,
Senior Technical Analyst, StockCharts.com
In this week's episode of Sector Spotlight, I reviewed the current position of markets (sector rotation) in combination with the theoretical framework provided by the Sector Rotation Model (Sam Stovall). This article provides a quick write-up of that segment.
The sector rotation model shows the typical cyclical movement...
READ MORE
MEMBERS ONLY
Sector Spotlight: Sector Rotation & The Business Cycle
by Julius de Kempenaer,
Senior Technical Analyst, StockCharts.com
On this edition of StockCharts TV's Sector Spotlight, I take a good look at the current state of asset class and sector rotation. I talk you through the daily and weekly rotations on the respective Relative Rotation Graphs, highlighting the strength of the USD, the pause in commodities...
READ MORE
MEMBERS ONLY
Americans are Buying Food and Booze -- But No Cigarettes
by Julius de Kempenaer,
Senior Technical Analyst, StockCharts.com
The S&P 500 is still holding up inside the boundaries of its rising channel, but the market is nervous, which resulted in a VIX reading above 30. That hasn't happened since February.
Nervous markets, or rather their participants, usually mean that people start checking out defensive...
READ MORE
MEMBERS ONLY
Sector Spotlight: Sector Rotation Disconnected from Seasonality
by Julius de Kempenaer,
Senior Technical Analyst, StockCharts.com
On this edition of StockCharts TV's Sector Spotlight, I take on both seasonality and the monthly charts for November, starting with a quick look and analysis of current sector rotation and its potential impact on the S&P 500. After that, I look at seasonal patterns for...
READ MORE
MEMBERS ONLY
Divergence is Back
by Julius de Kempenaer,
Senior Technical Analyst, StockCharts.com
First of all, I need to apologize for the absence of writing a blog article (and publishing a Sector Spotlight Video). In the intro of today's episode of Sector Spotlight, I explain a bit about what happened. But to make a long story very short, on Wednesday evening,...
READ MORE
MEMBERS ONLY
Sector Spotlight: Railroad Group Pops on RRG
by Julius de Kempenaer,
Senior Technical Analyst, StockCharts.com
On this edition of StockCharts TV's Sector Spotlight, I take my usual look at last week's rotation in Asset Classes and put that into longer-term perspective. From this universe, I highlight the strength of the US dollar and take a closer look at the relationship between...
READ MORE
MEMBERS ONLY
Railroads are On Track
by Julius de Kempenaer,
Senior Technical Analyst, StockCharts.com
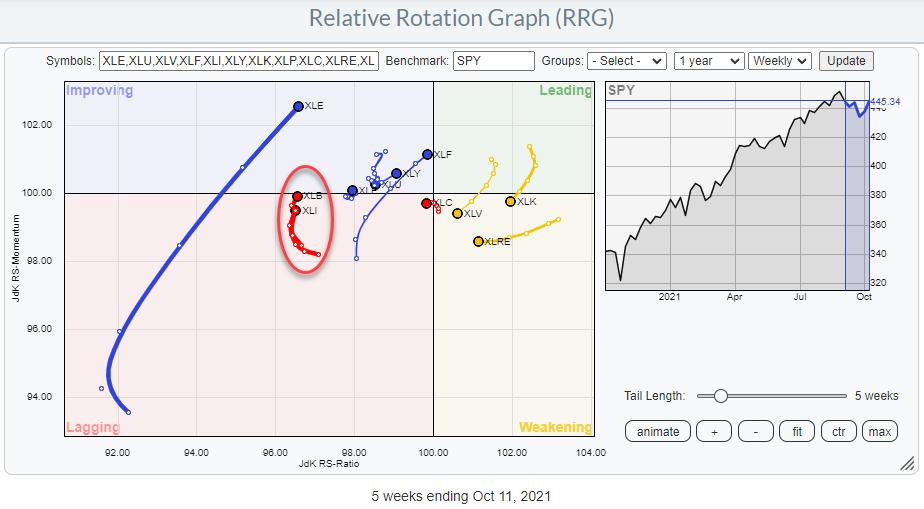
Two sectors that have my attention at the moment are Industrials (XLI) and Materials (XLB).
Looking at the Relative Rotation Graph above, we can see how similar the rotation for both sectors has been over the last 23 weeks, and still is. A few weeks ago, both tails rotated back...
READ MORE
MEMBERS ONLY
PLUG in Your Batteries
by Julius de Kempenaer,
Senior Technical Analyst, StockCharts.com
Earlier this week, I was preparing for my participation in a new episode of The Pitch. Unfortunately, that show got canceled as our host, Dave Keller, got sick with a cold.
One of the stocks I was going to pitch is PLUG. I ran into this company while working my...
READ MORE
MEMBERS ONLY
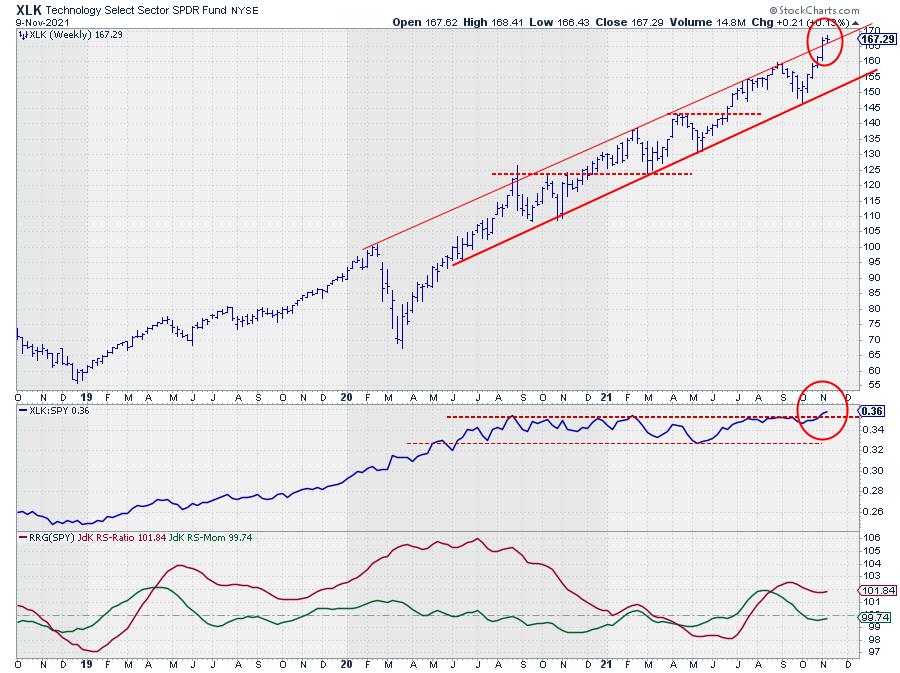
"Finally...." Tech is Breaking Out!
by Julius de Kempenaer,
Senior Technical Analyst, StockCharts.com
This may seem an odd title because, you might say, "tech broke out ages ago." While that is true with regard to price, it certainly was not the case for relative strength.
The (raw) RS-Line peaked back in August 2020 and has moved sideways in a narrow range...
READ MORE
MEMBERS ONLY
Sector Spotlight: 3 Levels of Sector Rotation on RRG
by Julius de Kempenaer,
Senior Technical Analyst, StockCharts.com
On this edition of StockCharts TV's Sector Spotlight, I discuss the current rotations in asset classes and sectors and bring the daily rotations into a longer-term perspective on the weekly Relative Rotation Graphs. Then, in the second half, I extend the use of the break down into Cyclical,...
READ MORE
MEMBERS ONLY
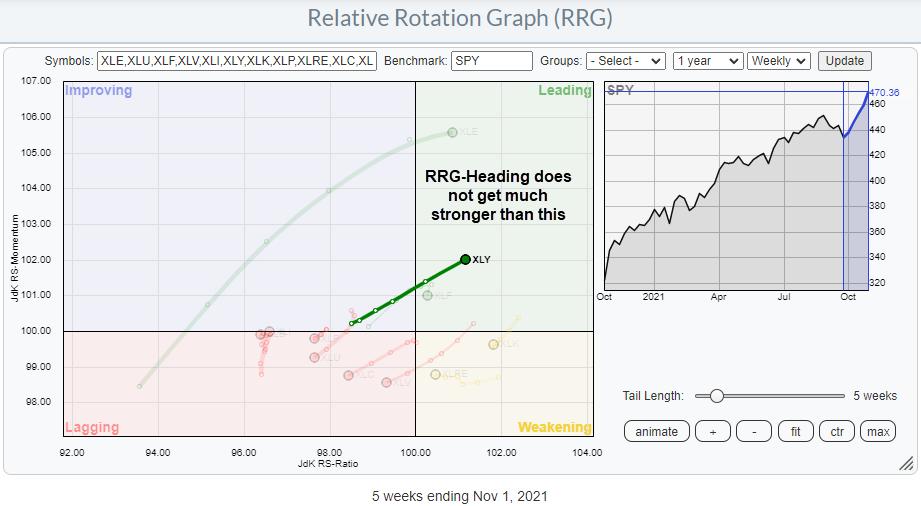
First People Buy Cars, Then They Need Parts (and Tires)
by Julius de Kempenaer,
Senior Technical Analyst, StockCharts.com
One of the (if not THE) most promising tails on the Relative Rotation Graph for US sectors is on XLY, the Consumer Discretionary sector. Over the last five weeks, the tail on XLY shows an almost straight line into the leading quadrant while gaining on both axes. Things do not...
READ MORE
MEMBERS ONLY
Sector Spotlight: Bullish New Highs on Monthly Charts
by Julius de Kempenaer,
Senior Technical Analyst, StockCharts.com
On this edition of StockCharts TV's Sector Spotlight, being the first Tuesday of the month, I take on the completed monthly charts for October. I kicks off the show with a look back at last week's rotations on the Relative Rotation Graphs for Asset Classes and...
READ MORE
MEMBERS ONLY
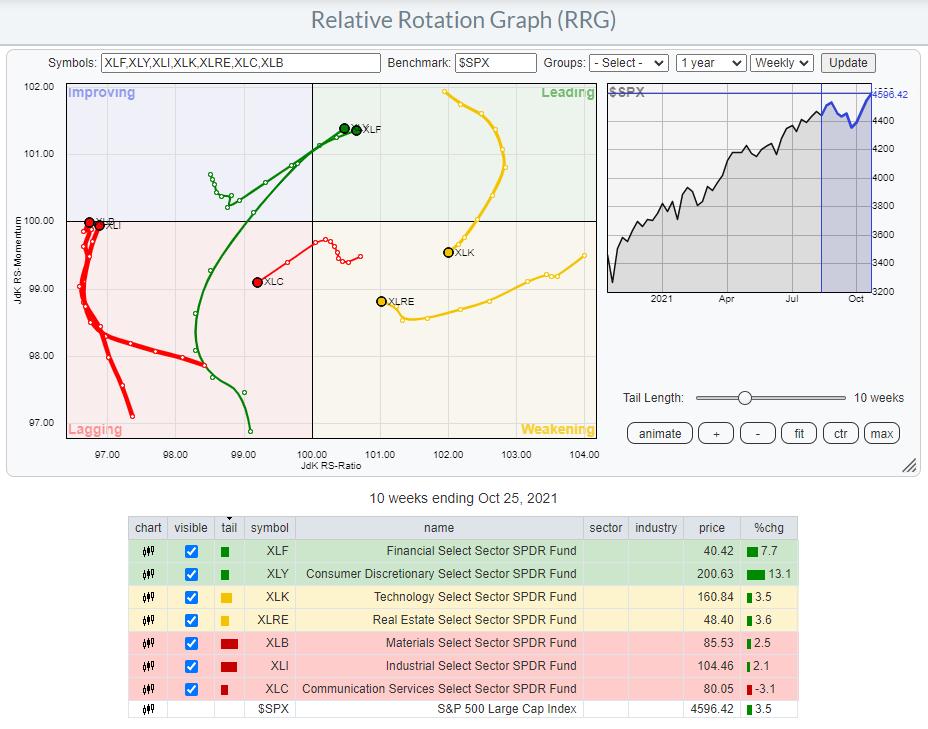
Offensive / Defensive Rotations & BETA Suggest More Upside For S&P 500
by Julius de Kempenaer,
Senior Technical Analyst, StockCharts.com
Offensive vs Defensive sector rotation always is a theme in stock markets. Sometimes a little more on the forefront, sometimes a bit more on the background. Sometimes we can read very clear messages from certain rotations, sometimes a little less.
At the moment, I believe, the offensive/defensive rotation is...
READ MORE
MEMBERS ONLY
Sector Spotlight: Strong Seasonal Trends for November
by Julius de Kempenaer,
Senior Technical Analyst, StockCharts.com
On this edition of StockCharts TV's Sector Spotlight, I take a quick look at the current state of Asset Class rotation through the RRG lens. After that, I move on to Sectors. After a quick assessment of last week's rotation, I bring in BETA again to...
READ MORE
MEMBERS ONLY
What You Need to Know About Universes and Benchmarks on RRG
by Julius de Kempenaer,
Senior Technical Analyst, StockCharts.com
The two crucial elements of a Relative Rotation Graph (RRG) are the "universe" and the "benchmark".
The Benchmark
The benchmark for a Relative Rotation Graph is the common denominator for all securities that are present in the universe. Theoretically, the benchmark can be any index or...
READ MORE
MEMBERS ONLY
Sector Spotlight: Offense Pulling Away While SPY Improves
by Julius de Kempenaer,
Senior Technical Analyst, StockCharts.com
On this edition of StockCharts TV's Sector Spotlight, I dive into the current state of sector rotation and highlight the relationship between the Consumer Discretionary and Consumer Staples sectors, as Discretionary is trying to pull away after a period of indecisiveness. The XLP:XLY ratio is breaking out...
READ MORE
MEMBERS ONLY
Sector Rotation Remains Confusing, But S&P Chart Improves
by Julius de Kempenaer,
Senior Technical Analyst, StockCharts.com
The sector rotations on the Relative Rotation Graph are still confusing. The Consumer Staples and Discretionary sectors are currently moving in the same direction where they normally move in opposite directions. Based on rising rates, one would expect both Banks/Financials and Real-Estate to benefit, but where XLF is definitely...
READ MORE
MEMBERS ONLY
Sector Spotlight: 100th Episode Special with Tom Dorsey!
by Julius de Kempenaer,
Senior Technical Analyst, StockCharts.com
For the 100th edition of StockCharts TV's Sector Spotlight, I invite market veteran Tom Dorsey to join me for a chat and celebrate these past 100 episodes! We touch on how and when we had our ah-ha moments, or "epiphanies" as Tom refers to it, where...
READ MORE
MEMBERS ONLY
A Run on Banks
by Julius de Kempenaer,
Senior Technical Analyst, StockCharts.com
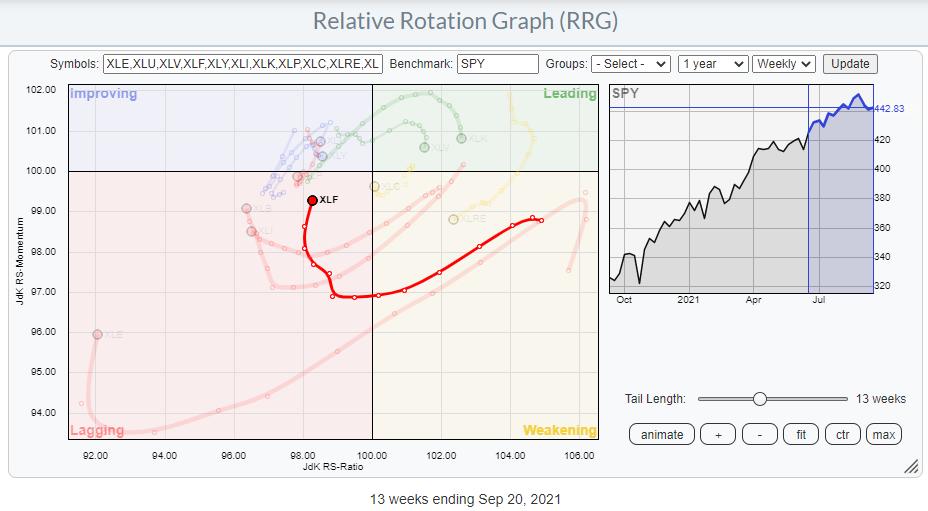
On the Relative Rotation Graph for sectors, the tail on XLF is showing one of the most promising rotations, being inside the improving sector and traveling at a strong RRG-Heading towards leading. Relative and price-technical arguments aside, I think there are two charts that support a further rotation towards and...
READ MORE
MEMBERS ONLY
NYFANG, The Index and ETF Nobody Talks About
by Julius de Kempenaer,
Senior Technical Analyst, StockCharts.com
In a recent conversation, somebody mentioned "New York Fang" to me. I was under the impression he was referring to the FANG stocks. Only later did I understand that he was talking about an ETF and an associated index which is a bit broader than "just"...
READ MORE
MEMBERS ONLY
Sector Spotlight: Bearish Engulfing Candle for S&P
by Julius de Kempenaer,
Senior Technical Analyst, StockCharts.com
On this edition of StockCharts TV's Sector Spotlight, I start the month by evaluating the monthly charts for asset classes and sectors. Despite the weak ending of the month in September, three sectors managed to squeeze out a new all-time-high. However, none of them were able to hold...
READ MORE
MEMBERS ONLY
Double Tops Could Become "A Thing" in the Bond Market
by Julius de Kempenaer,
Senior Technical Analyst, StockCharts.com
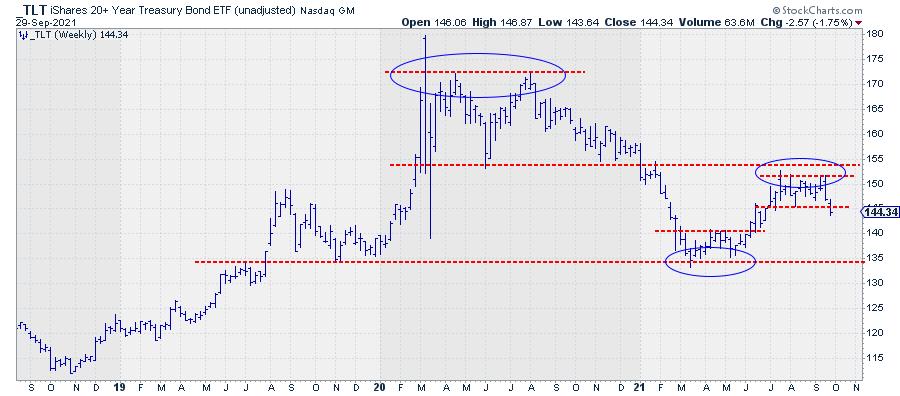
The Bond Market Holds all the keys. And one of the key charts here is TLT.
After setting a big double top in 2020 and completing it at the end of the year, the start of 2021 was characterized by an acceleration lower, pushing yields higher. Support was found around...
READ MORE
MEMBERS ONLY
Sector Spotlight: Does The Bond Market Hold All the Keys?
by Julius de Kempenaer,
Senior Technical Analyst, StockCharts.com
On this edition of StockCharts TV's Sector Spotlight, I review the current rotations for Asset Classes and Sectors. As it is the last Tuesday of the month, I bring in the seasonality segment to find out if there are any meaningful seasonal patterns coinciding with current rotations on...
READ MORE
MEMBERS ONLY
This Tech Stock Breaks Out And Is Added To The RRG Long Basket
by Julius de Kempenaer,
Senior Technical Analyst, StockCharts.com
After the last update of the RRG Baskets we were left with 3 shorts and 3 longs:
LONG : EXR, WM, CRM
SHORT: XLY, SWKS, PSX
LONG
Looking at the recent performance for the members of the long basket we see CRM and WM holding up well vs the S&...
READ MORE
MEMBERS ONLY
Breaking Down the Financials Sector on RRG
by Julius de Kempenaer,
Senior Technical Analyst, StockCharts.com
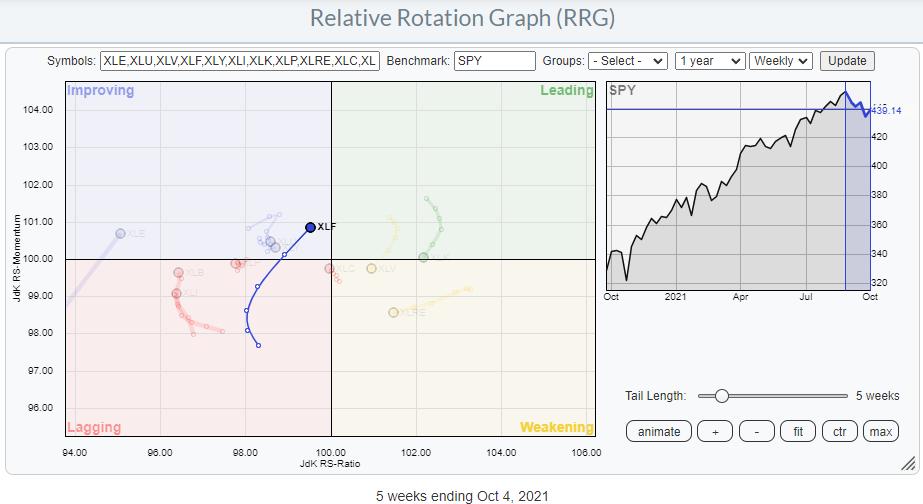
On the Relative Rotation Graph for sectors, the Financials sector, XLF, is positioned inside the lagging quadrant and heading upwards to the improving quadrant. The sector is gaining on the vertical JdK RS-Momentum axis, but not so much (yet) on the horizontal Jdk RS-Ratio axis.
On the price chart, XLF...
READ MORE
MEMBERS ONLY
Sector Spotlight: The Markets Take a Nose Dive -- What's Next?
by Julius de Kempenaer,
Senior Technical Analyst, StockCharts.com
Be Careful what you wish for.... the market finally seems to be starting to give in. As Europe opens the week lower and the US follows, I assess the rotations at asset class and sector level on this edition of StockCharts TV's Sector Spotlight. With the market now...
READ MORE
MEMBERS ONLY
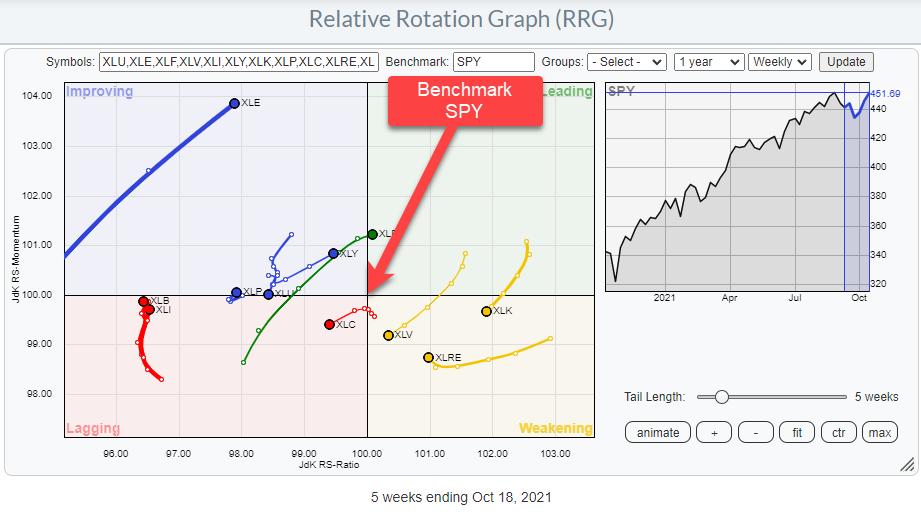
We Can See More Than "Just" Sector Rotation on Relative Rotation Graphs
by Julius de Kempenaer,
Senior Technical Analyst, StockCharts.com
I had planned to look at some lesser-known Relative Rotation Graphs in this week's episode of Sector Spotlight, but I used too much time on asset class and sector rotations to make that happen. So I am going to publish them here and give a brief description and...
READ MORE
MEMBERS ONLY
Sector Spotlight: Rotation in the Defensive Sector is Gathering Momentum
by Julius de Kempenaer,
Senior Technical Analyst, StockCharts.com
On this edition of StockCharts TV's Sector Spotlight, asset class level stocks are still beating bonds, but the pace is slowing down. The big H&S pattern in EUR/USD, which suggested strength for the USD, is still there but lost a bit of its appetite.
Sector...
READ MORE
MEMBERS ONLY
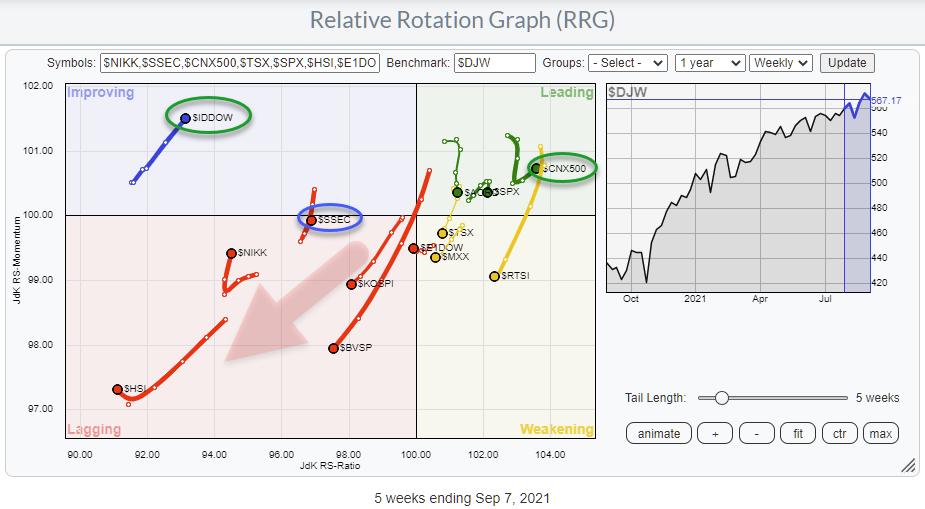
An International Perspective on (Stock) Markets From RRG
by Julius de Kempenaer,
Senior Technical Analyst, StockCharts.com
With the SPY/SPX chart sending curveballs, sector rotation on Relative Rotation Graphs is sending conflicting signals. With breadth continuing to deteriorate as the S&P continues to creep higher, getting a handle on the markets is not getting any easier. So instead of focusing on the S&...
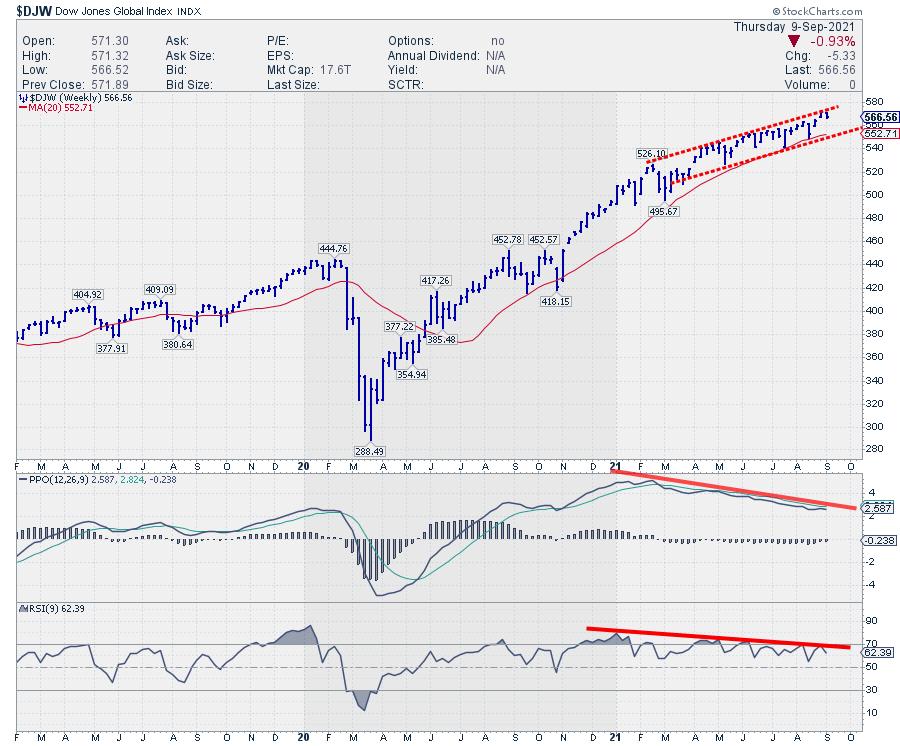
READ MORE
MEMBERS ONLY
Pressure Continues to Build For Global Markets
by Julius de Kempenaer,
Senior Technical Analyst, StockCharts.com
Over the past few weeks, I have been pointing out conflicting rotations for sectors on Relative Rotation Graphs, the negative divergence between RSI and SPY and a few more arguments that signal caution.With regard to the S&P, that has not paid off.... yet. The US stock market,...
READ MORE
MEMBERS ONLY
Sector Spotlight: Frustration Takes Foothold in the Markets
by Julius de Kempenaer,
Senior Technical Analyst, StockCharts.com
On this edition of StockCharts TV's Sector Spotlight, I talk you through the recent rotations in Asset Classes and Sectors, addressing the counter-trend move in the USD index -- which is close to negating the double bottom in the index and the H&S pattern in the...
READ MORE
MEMBERS ONLY
PSX Replacing ETR as a New Short in the RRG Basket
by Julius de Kempenaer,
Senior Technical Analyst, StockCharts.com
The last update on the RRG baskets goes back to 20 July. In that post, I did a big clean up and left the basket with the following positions:
LONG: EXR, WM, CRM
SHORT: ETR, XLY, SWKS
LONG Basket
The RRG for the three stocks on the long side shows...
READ MORE
MEMBERS ONLY
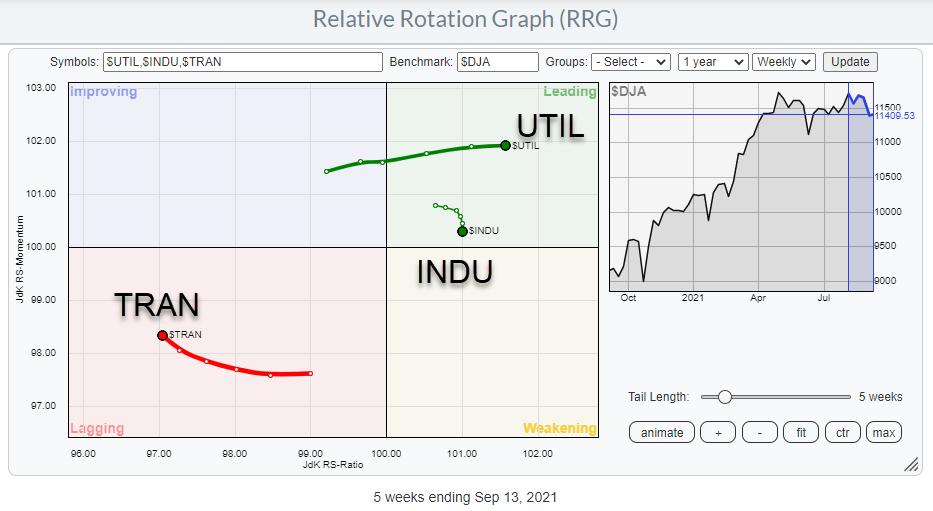
Utilities and Staples at Opposite Rotations on RRG; What Does That Tell Us?
by Julius de Kempenaer,
Senior Technical Analyst, StockCharts.com
In this week's episode of Sector Spotlight, I focused on the long-term trends using monthly charts. For several months already, most sectors have been in an uptrend on these charts; only the energy sector and the utilities sector did not qualify as such (higher highs and higher lows...
READ MORE
MEMBERS ONLY
Sector Spotlight: A Break in Utilities
by Julius de Kempenaer,
Senior Technical Analyst, StockCharts.com
Did you see the break in Utilities? On this edition of StockCharts TV's Sector Spotlight, it's all about the monthly charts. As the last Tuesday of this month (August) also happened to be the last day of the month, I decided to push things forward a...
READ MORE
MEMBERS ONLY
RRG's Road to StockCharts.com
by Julius de Kempenaer,
Senior Technical Analyst, StockCharts.com
This month marks exactly seven years ago that I started contributing to the StockCharts website, after Relative Rotation Graphs were added to the graphical toolbox in July 2014.
As the number of eyeballs on RRGs, the blog and the weekly episodes of Sector Spotlight has grown substantially over these years,...
READ MORE