MEMBERS ONLY
Sector Spotlight: Bonds are Looking Good
by Julius de Kempenaer,
Senior Technical Analyst, StockCharts.com
As is usual for the first episode of Sector Spotlight of a new month, I take an in-depth look at developments on the monthly charts for Asset Classes and Sectors. There's also a short intermezzo on Flag patterns and a book suggestion!
This video was originally broadcast on...
READ MORE
MEMBERS ONLY
Watching Rotations into Real Estate and Technology (again)...
by Julius de Kempenaer,
Senior Technical Analyst, StockCharts.com
At the start of the week, two tails on the Relative Rotation Graph for US sectors are showing interesting rotations. These are the tails for for XLRE and XLK.
Real Estate
The positive rotation for the daily tail on the RRG coincides nicely with the improvement for XLRE on a...
READ MORE
MEMBERS ONLY
Will The Next Big Move Be in Bonds?
by Julius de Kempenaer,
Senior Technical Analyst, StockCharts.com
(Financial) Markets rotate, that's a given. When we look at the stock market, we call it sector rotation, which is probably the most widely-used term. But there is definitely also rotational action going on in other markets or cross assets. Think in terms of country or regional stock...
READ MORE
MEMBERS ONLY
Real Estate Emerging Out of Doldrums
by Julius de Kempenaer,
Senior Technical Analyst, StockCharts.com
Ok, the header image may not be entirely accurate to the message of this article, as it deals with the Real Estate sector which is all about listed REITs, but I could not resist using it ;)
When I looked at the Relative Rotation Graphs for sectors this morning, I noticed...
READ MORE
MEMBERS ONLY
Sector Spotlight: Seasonality and RRGs
by Julius de Kempenaer,
Senior Technical Analyst, StockCharts.com
It's a very full show on this episode of Sector Spotlight. After a quick overview of what happened in asset classes and sectors last week, I take a look at seasonality combined with rotations on the RRG. Finally, I finish up the show by answering two mailbag questions...
READ MORE
MEMBERS ONLY
Sector Rotation Shows Weakness for Technology and Communication Services
by Julius de Kempenaer,
Senior Technical Analyst, StockCharts.com
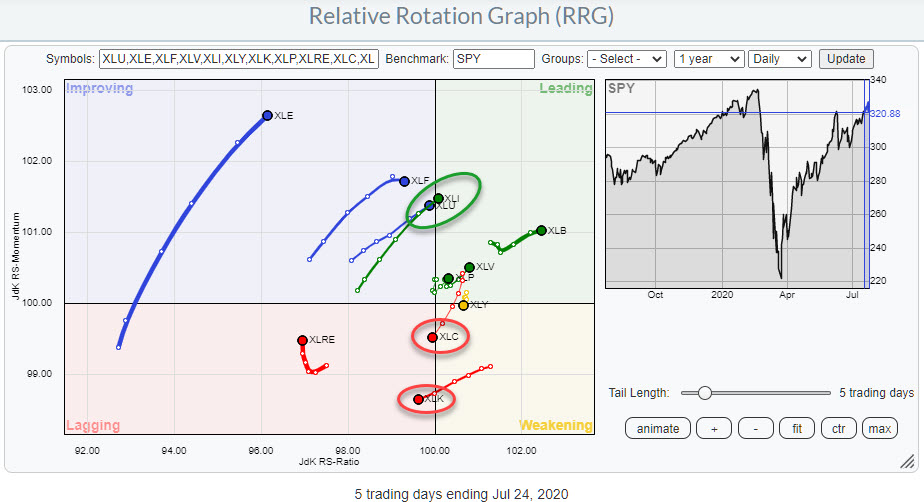
Following Friday's close, we are facing a daily Relative Rotation Graph with some interesting (sector) rotations underway.
Energy
The Energy sector had a pretty good week. This comes after I suggested more weakness for this sector in Sector Spotlight on Tuesday 7/21... I recorded that show on...
READ MORE
MEMBERS ONLY
Here's a Materials Stock With Potential
by Julius de Kempenaer,
Senior Technical Analyst, StockCharts.com
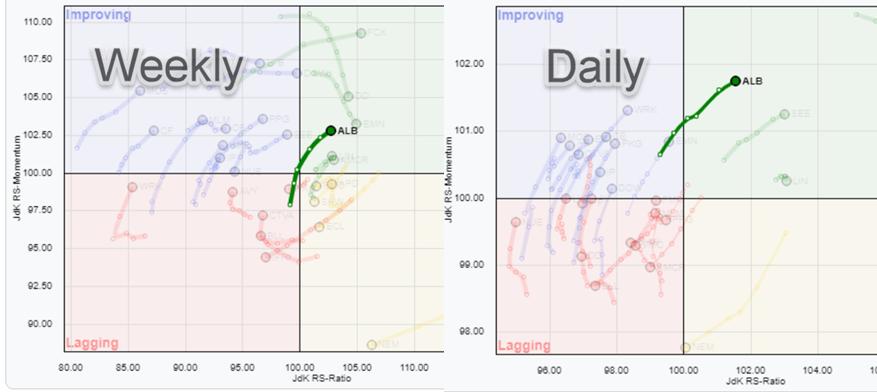
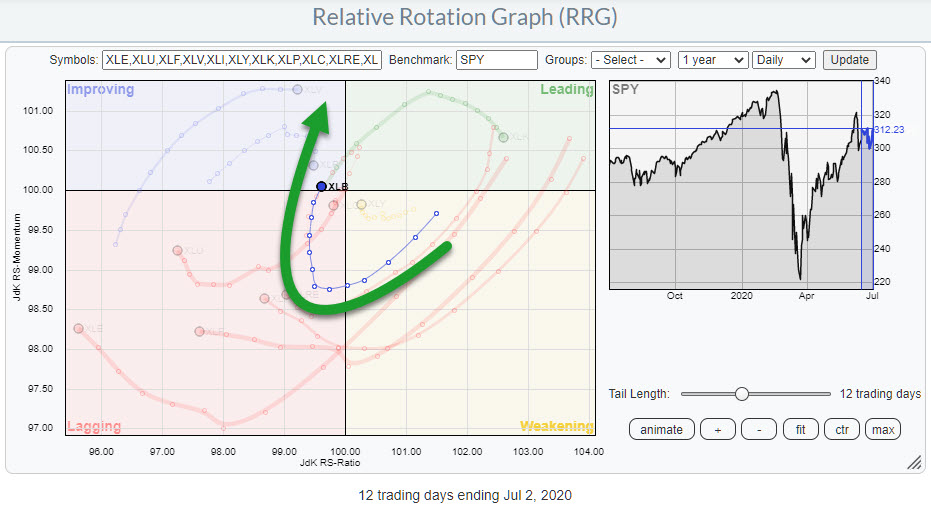
With the Materials sector (XLB) moving into the leading quadrant on the weekly RRG, it makes sense to look for some individual stocks that may offer upside potential. Using Relative Rotation Graphs, we can do just that by loading all members of the Materials sector and using XLBas the benchmark...
READ MORE
MEMBERS ONLY
Sector Spotlight: Short-Term Sector Rotation Out of Technology
by Julius de Kempenaer,
Senior Technical Analyst, StockCharts.com
On this episode of Sector Spotlight, after a quick overview of Asset Class and Sector rotation, I go over and update my longer-term views using the investment pyramid. In the second half of the show, I give a thorough update of the Long/Short baskets while putting these picks in...
READ MORE
MEMBERS ONLY
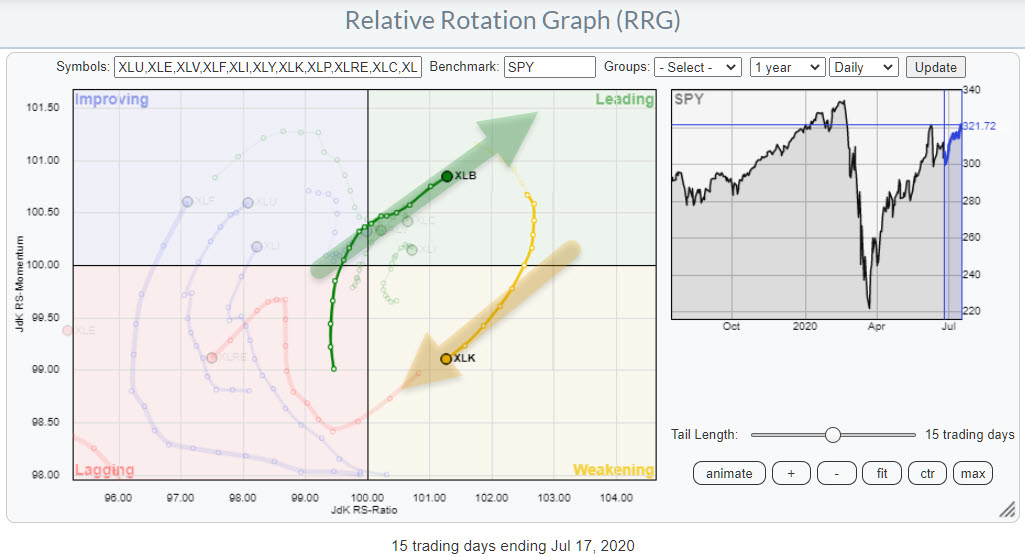
XLB Picking Up More Strength as Sector Rotates Further into Leading; XLK Loses Relative Momentum inside Weakening
by Julius de Kempenaer,
Senior Technical Analyst, StockCharts.com
On the weekly Relative Rotation Graph for US sectors, there are five sectors rotating at the right hand side of the graph, either inside the leading quadrant (XLB,XLC,XLK,XLY) or inside the weakening quadrant (XLV). On the daily RRG, it's also only these sectors at the...
READ MORE
MEMBERS ONLY
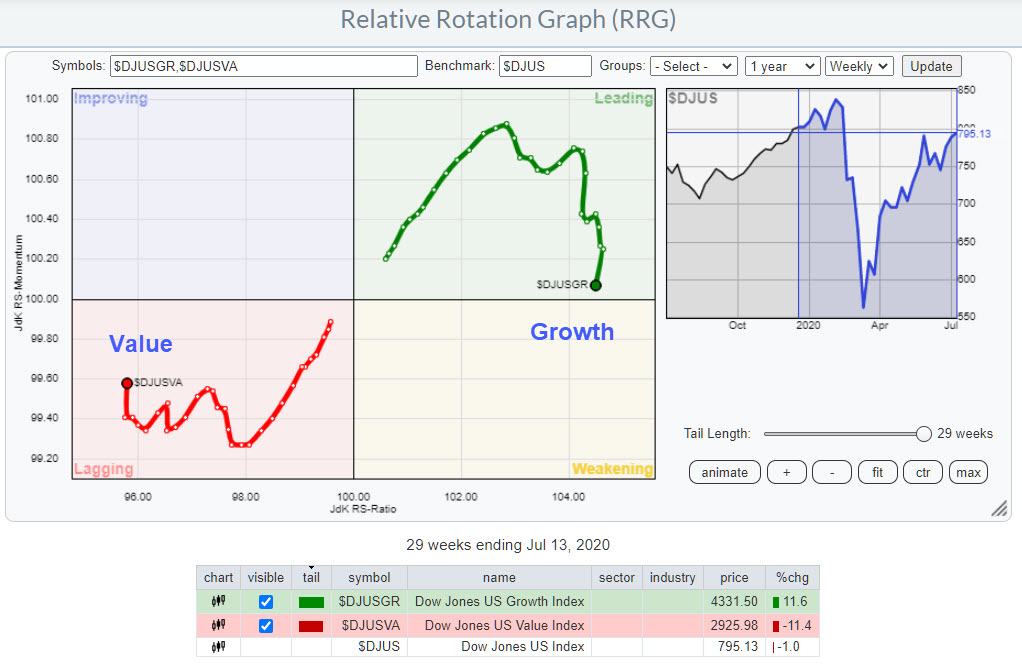
What About Growth vs. Value Going into the Second Half?
by Julius de Kempenaer,
Senior Technical Analyst, StockCharts.com
The last time Value took over from Growth was at the end of 2018, and even that was only for a short period going into and following the Christmas Crash. But that situation rapidly reversed a few weeks into 2019, when the uptrend in the Growth-Value ratio continued strongly.
If...
READ MORE
MEMBERS ONLY
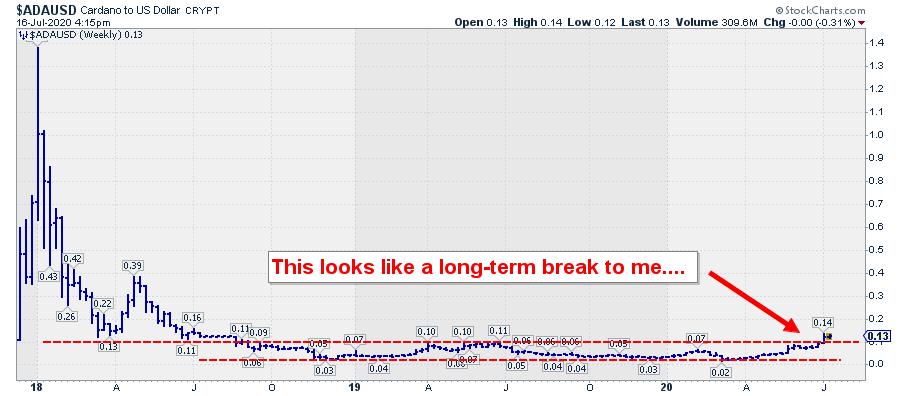
This Thing Has 70% Upside Potential...
by Julius de Kempenaer,
Senior Technical Analyst, StockCharts.com
I got triggered to watch the chart printed above when I was scrolling through the pre-defined RRG groups.
This is a routine I go through on a regular basis; just flip through all pre-defined RRGs and see if I note any strange or particularly strong or weak rotations. Literally right...
READ MORE
MEMBERS ONLY
Sector Spotlight: Charting Mid-Year Sector Rotation
by Julius de Kempenaer,
Senior Technical Analyst, StockCharts.com
On this episode of Sector Spotlight, I spends the full show in line with StockCharts TV's theme of the week "Charting the Second Half," examining what may be in store for the markets in the next part of 2020. I look at the rotation on the...
READ MORE
MEMBERS ONLY
XLY Simultaneously Breaking to New Highs in Price and Relative Strength
by Julius de Kempenaer,
Senior Technical Analyst, StockCharts.com
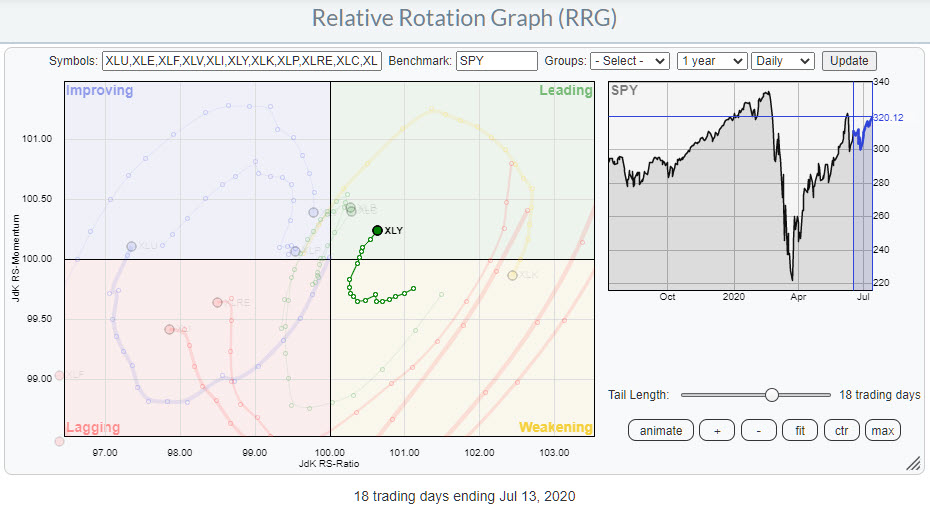
On the daily Relative Rotation Graph for US sectors, the Consumer Discretionary sector rotated back into the leading quadrant last week, coming up from weakening. Generally, this is a positive/strong rotation as it reflects the second (or third, etc.) leg within a relative uptrend that is already underway.
Looking...
READ MORE
MEMBERS ONLY
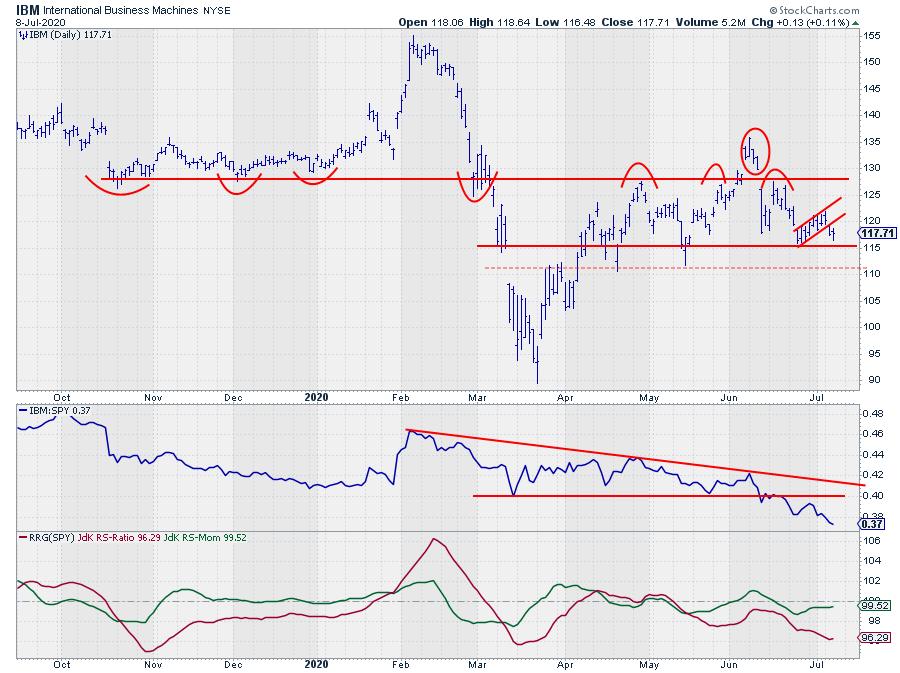
This BIG (BLUE) Tech Stock Is On The Verge Of Breaking Lower
by Julius de Kempenaer,
Senior Technical Analyst, StockCharts.com
There is no doubt that the technology sector is still the strongest segment in the US stock market, but, in the near term, it is losing some of its relative momentum, as you can see on the daily Relative Rotation Graph for US sectors. One of the stocks in that...
READ MORE
MEMBERS ONLY
Sector Spotlight: Why 322 is Important for SPY
by Julius de Kempenaer,
Senior Technical Analyst, StockCharts.com
The first half of 2020 is "done and dusted." On this episode of Sector Spotlight, I start with a quick look back at the performance and rotations for asset classes and Sectors last week. Then, I take a closer look into the long-term trends using monthly charts in...
READ MORE
MEMBERS ONLY
The Materials Sector (XLB) is Lining Up For a Good Week!
by Julius de Kempenaer,
Senior Technical Analyst, StockCharts.com
I hope all of you had a great (long) 4th of July weekend. At the end of the short trading week, the Materials sector turned into a 0-90 degree heading on the Relative Rotation Graph as it crossed over into the improving quadrant from lagging at the same time.
This...
READ MORE
MEMBERS ONLY
AMZN Move Over Please... Coming Through
by Julius de Kempenaer,
Senior Technical Analyst, StockCharts.com
One of the ratios that a lot of market watchers and commentators look at is the relationship between Consumer Staples and Consumer Discretionary stocks. The assumption or rationale behind watching this pair is that Consumer Discretionary stocks usually do well in a rising market (SPY), while Consumer Staples stocks tend...
READ MORE
MEMBERS ONLY
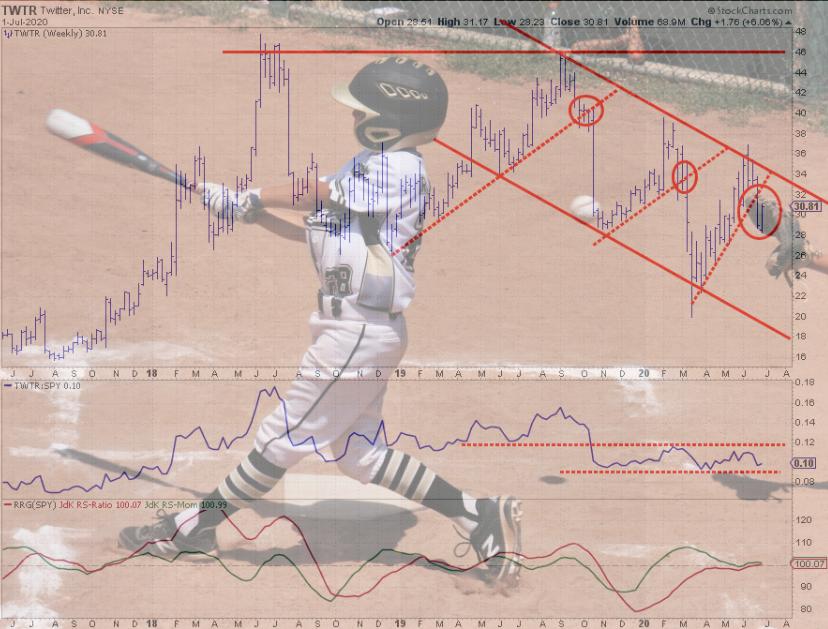
Three Tweets and you're......
by Julius de Kempenaer,
Senior Technical Analyst, StockCharts.com
On the weekly chart of Twitter (TWTR), a clear downward trend is visible. The last three peaks are lining up nicely and connecting a downward-sloping resistance line. Parallel to that downward sloping resistance line, there is an also downward-sloping support line that connects the last three lower lows.
This channel...
READ MORE
MEMBERS ONLY
Sector Spotlight: S&P Losing Momentum
by Julius de Kempenaer,
Senior Technical Analyst, StockCharts.com
On this episode of Sector Spotlight, I check the seasonality for the month of July, but no clear over- or underperforming sectors are visible. The rotation of international stock markets is sending a clearer message; the US is losing momentum vs the rest of the world, especially Japan. Following some...
READ MORE
MEMBERS ONLY
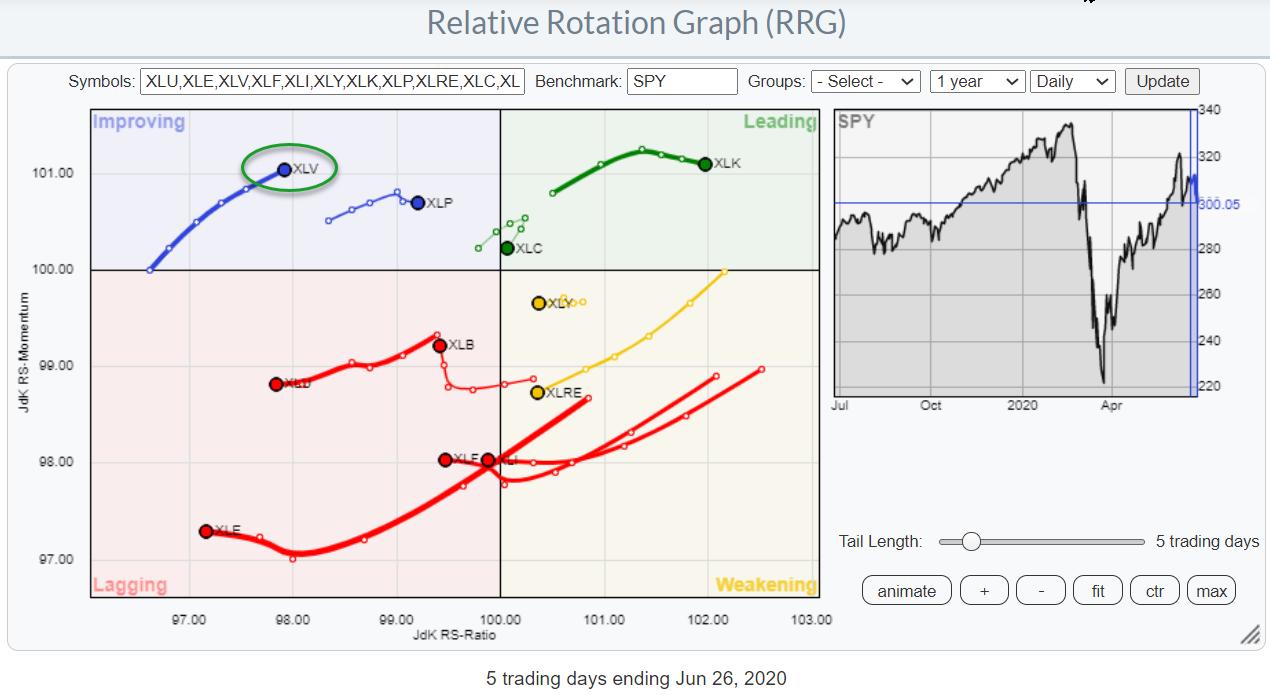
Watching the Health Care Sector This Week As It Started Rotating at a Strong RRG-Heading
by Julius de Kempenaer,
Senior Technical Analyst, StockCharts.com
Last week's sector rotation has pushed the Health Care sector into the improving quadrant at a positive RRG-Heading. This makes the sector stand out in a positive way on the DAILY Relative Rotation Graph for US sectors.
The only two other sectors that are rotating from left to...
READ MORE
MEMBERS ONLY
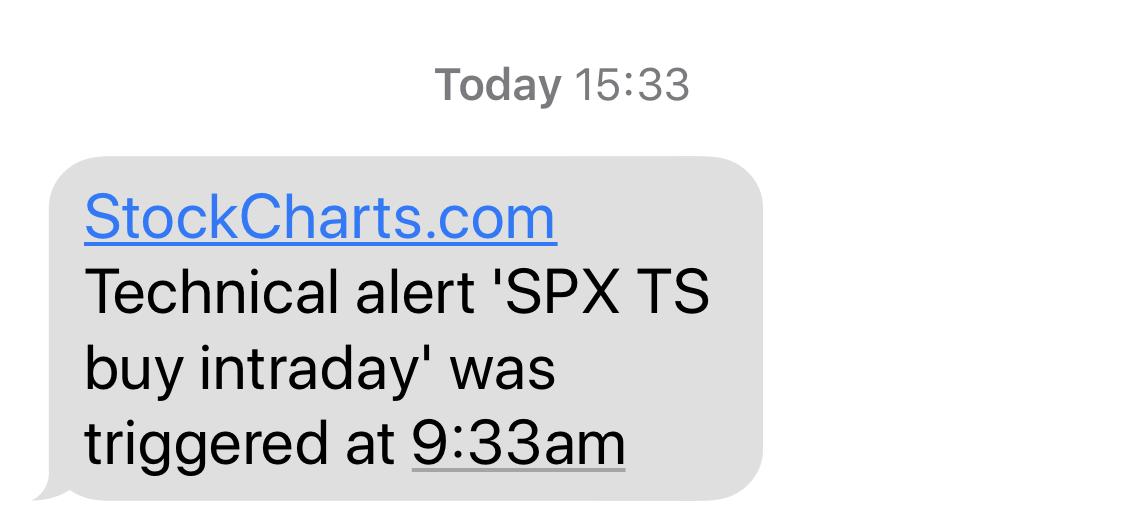
Turtle Soup Scan Triggers 29 Alerts, VRSN Ticks All The Boxes!
by Julius de Kempenaer,
Senior Technical Analyst, StockCharts.com
One of the scans that I run on a daily basis is my scan for "Turtle Soup" Buy signals. Actually, I have two versions of that scan - one that runs at last day's close and one that runs on last intraday update.
For the scan...
READ MORE
MEMBERS ONLY
Sector Spotlight: Sector Rotation Using Breadth Data
by Julius de Kempenaer,
Senior Technical Analyst, StockCharts.com
On this episode of Sector Spotlight, I perform a quick overview of asset class and sector rotation, then focus in on plotting breadth data on Relative Rotation Graphs. After the break, I answer two questions from the RRG mailbag.
This video was originally broadcast on June 23rd, 2020. Click anywhere...
READ MORE
MEMBERS ONLY
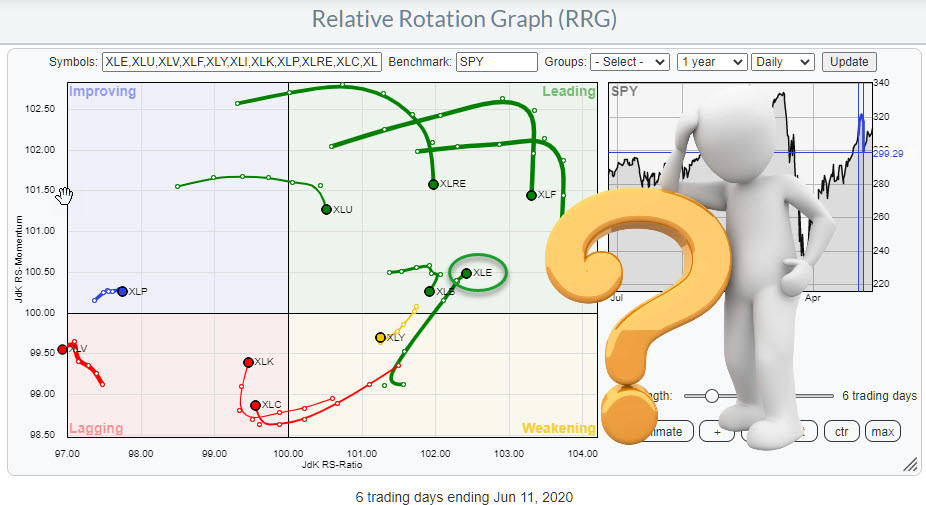
XLE is Down 9%, But Still Moving Up Into the Leading Quadrant.... Why?
by Julius de Kempenaer,
Senior Technical Analyst, StockCharts.com
This question was forwarded to me by Dave Keller after he received it in the mailbag for his show The Final Bar.
"The RRGs attached all make sense except for XLE. It was down nearly 9% the last two days, but the RRG has it moving up from weakening....
READ MORE
MEMBERS ONLY
Where Wall Street Meets Broad Street - Using Breadth Data to Confirm Sector Rotation
by Julius de Kempenaer,
Senior Technical Analyst, StockCharts.com
Technical analysts use a lot of breadth data in their work, which is understandable as it can give us a lot of useful information about how a market as a whole, usually a broad index level, behaves. Plus, it can help us to find developments "under the hood"...
READ MORE
MEMBERS ONLY
(Sector) Breadth Confirms Weak Rotation for Utilities
by Julius de Kempenaer,
Senior Technical Analyst, StockCharts.com
Relative Rotation Graphs are not just good for showing you the relative rotation based on price, but can also help you to see the relative development (rotation) of breadth on a sector level. There are many measures for breadth available in the StockCharts.com database, including several breadth indexes that...
READ MORE
MEMBERS ONLY
Sector Spotlight: Steepening Yield Curve a Threat?
by Julius de Kempenaer,
Senior Technical Analyst, StockCharts.com
On this episode of Sector Spotlight, I work my way through the Investment pyramid, introducing a new universe for commodity sub-indexes. In particular, I highlight the steepening of the yield curve, which could be a threat for the S&P.
This video was originally broadcast on June 16th, 2020....
READ MORE
MEMBERS ONLY
Some Long and Short Ideas from RRG
by Julius de Kempenaer,
Senior Technical Analyst, StockCharts.com
In my weekly Sector Spotlight show on StockCharts TV, I present a segment on pair-trading ideas from time to time. This initially started out as 1-1 pair trades ideas, later changing to a basket of long ideas vs. a basket of short ideas.
In the episode that I recorded yesterday...
READ MORE
MEMBERS ONLY
Yesterday's Impact on Sector Rotation
by Julius de Kempenaer,
Senior Technical Analyst, StockCharts.com
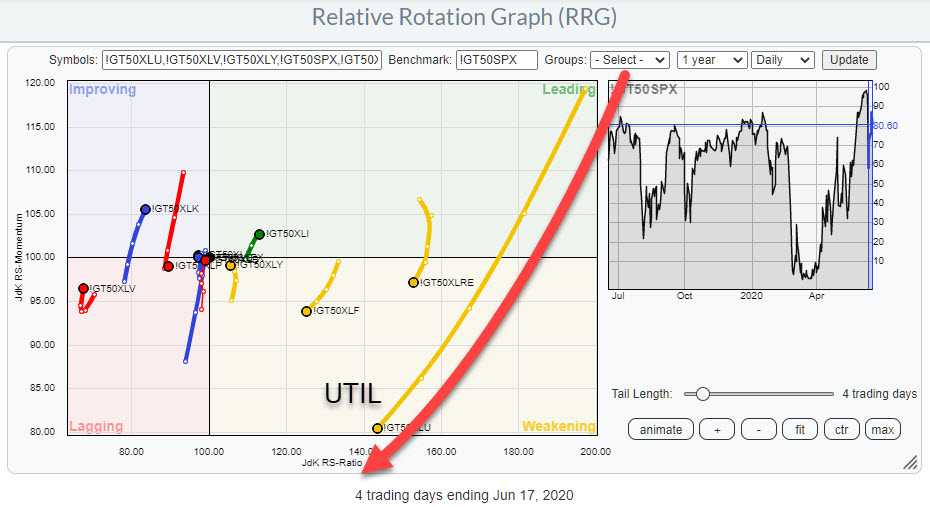
Yesterday's (6/11/2020) big drop in the S&P did not cause any weird hooks or unexpected rotations on the Relative Rotation Graph.
If we start off in the leading quadrant, we see that the tails for XLU, XLRE, XLF, XLI and XLB had already started...
READ MORE
MEMBERS ONLY
This is What Resistance Looks Like!
by Julius de Kempenaer,
Senior Technical Analyst, StockCharts.com
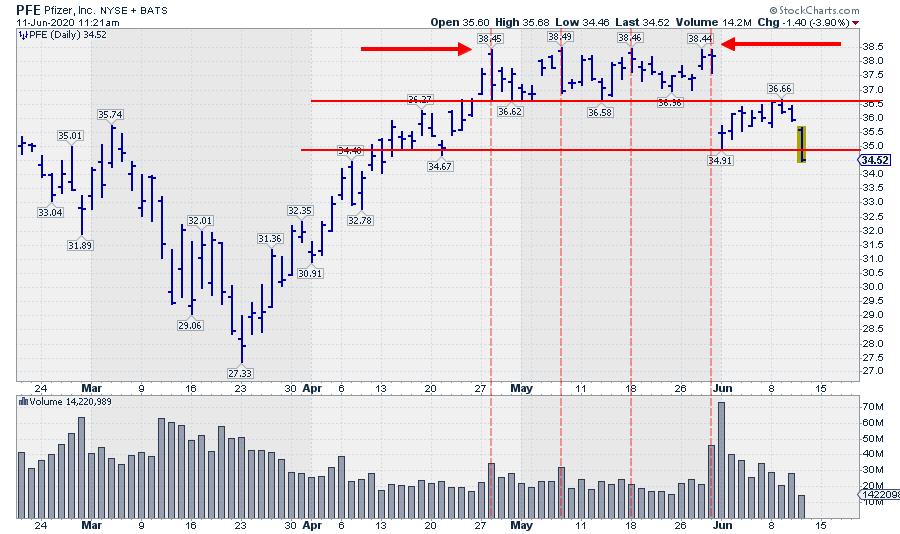
A lot of (very educated) people want us to believe that the market is a random walk. And you know... Maybe sometimes it is, but not always.
This morning, I ran into the chart of Pfizer (PFE) again. I've been monitoring that chart since I wrote about it...
READ MORE
MEMBERS ONLY
Sector Spotlight: The Turn of the Tail
by Julius de Kempenaer,
Senior Technical Analyst, StockCharts.com
On this episode of Sector Spotlight, after a quick overview of asset classes and sector rotation, I dive into the mailbag and answer three questions. One of them shows two quantitative studies involving expected returns after a tail turning into a 0-90 degree heading.
This video was originally broadcast on...
READ MORE
MEMBERS ONLY
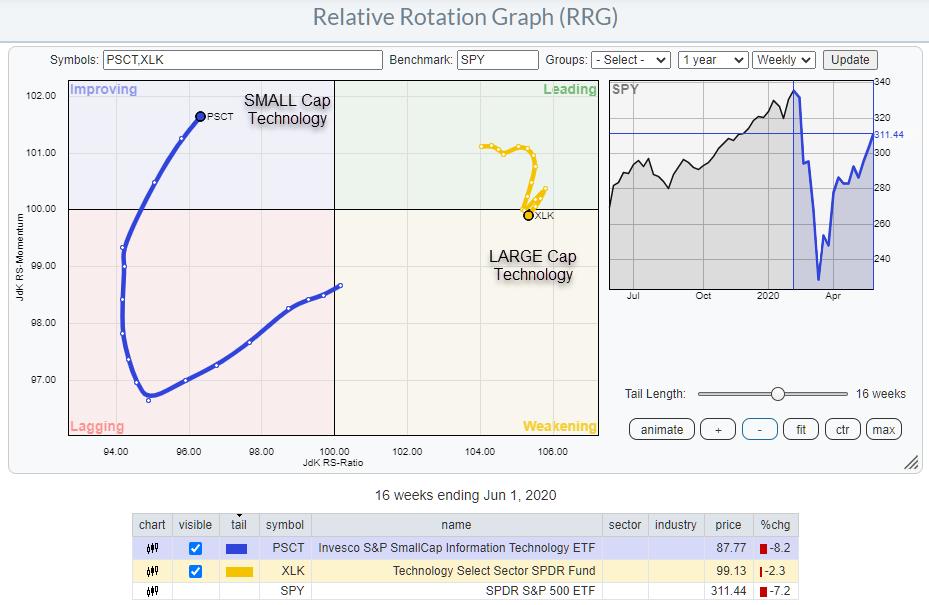
Smaller Stocks Lead at Bottoms. - JJM
by Julius de Kempenaer,
Senior Technical Analyst, StockCharts.com
The title for this article is a quote from John Murphy's book Trading with Intermarket Analysis. And I couldn't help but think of it when I was watching the Relative Rotation Graph that shows the rotation for different segments of market capitalization.
The most well-known RRG...
READ MORE
MEMBERS ONLY
Time to Sell MSFT and AAPL?
by Julius de Kempenaer,
Senior Technical Analyst, StockCharts.com
The recovery of the Technology sector out of the March low has been in line with the S&P 500, only 1.5% better. With its strong (out)performance in the run up to the February peak and the less disastrous decline into March, XLK remained at the right...
READ MORE
MEMBERS ONLY
Sector Spotlight: Seasonality Suggests XLV over XLF for June
by Julius de Kempenaer,
Senior Technical Analyst, StockCharts.com
On this episode of Sector Spotlight, I take a look at the longer-term picture for asset Classes and sectors using monthly bar-charts, then show how sometimes a shift to a line chart may give you even more insight. After this, I move on to combining the current RRG rotations with...
READ MORE
MEMBERS ONLY
Seasonality Prefers Health Care over Financials in June
by Julius de Kempenaer,
Senior Technical Analyst, StockCharts.com
In this week's episode of Sector Spotlight (Tuesday 10.30-11.00am ET), I ran out of time to review outstanding pair-trades so I am writing them up here in this article.
Monitoring (pair trade) ideas and how to properly communicate and track them remains an ongoing concern. Let...
READ MORE
MEMBERS ONLY
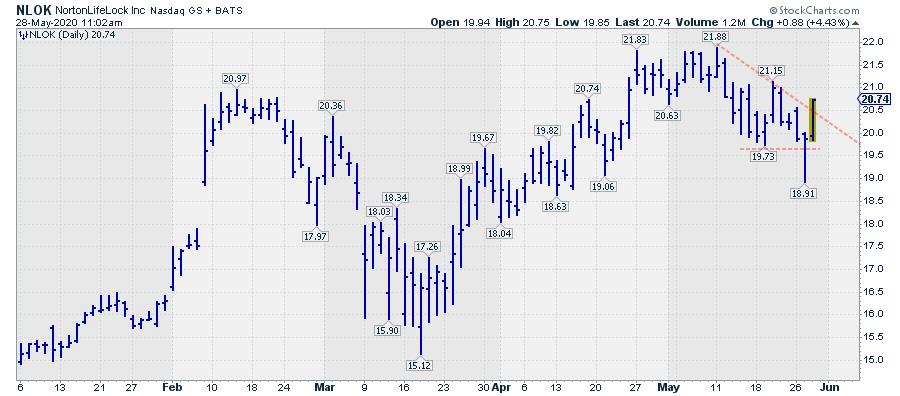
Is NortonLifeLock-ing In a New Low?
by Julius de Kempenaer,
Senior Technical Analyst, StockCharts.com
One of my alerts on StockCharts.com is based on the "Turtle Soup" Strategy, which was described by Larry Connors and Linda Raschke in their book Street Smarts in 1996!!
I like this setup because it looks for entries around potential tops and bottoms, and is therefore a...
READ MORE
MEMBERS ONLY
Sector Spotlight: Your View Depends on Your Timeframe
by Julius de Kempenaer,
Senior Technical Analyst, StockCharts.com
On this episode of Sector Spotlight, I review the current rotations for asset classes and sectors. In addition, I explain how your investment horizon and timeframe is crucial in determining how you view the markets.
This video was originally broadcast on May 26th, 2020. Click anywhere on the Sector Spotlight...
READ MORE
MEMBERS ONLY
Facebook On its Way to $290
by Julius de Kempenaer,
Senior Technical Analyst, StockCharts.com
Communication is key...
The Communication Services started to come alive again after a dull period, at least in relative terms.
Recently, I wrote about the sector here in a Don't Ignore This Chart article ("Is Everybody Calling and Texting or What?"). In addition, in the first...
READ MORE
MEMBERS ONLY
Sector BETA Can Help You with General Market Direction
by Julius de Kempenaer,
Senior Technical Analyst, StockCharts.com
Some time ago, I started to play around with BETA as a metric to gauge risk appetite for sectors, then went from there to the general market. If you search for BETA in ChartSchool you will find this entry:
Beta: A measure of a security's systematic or market...
READ MORE
MEMBERS ONLY
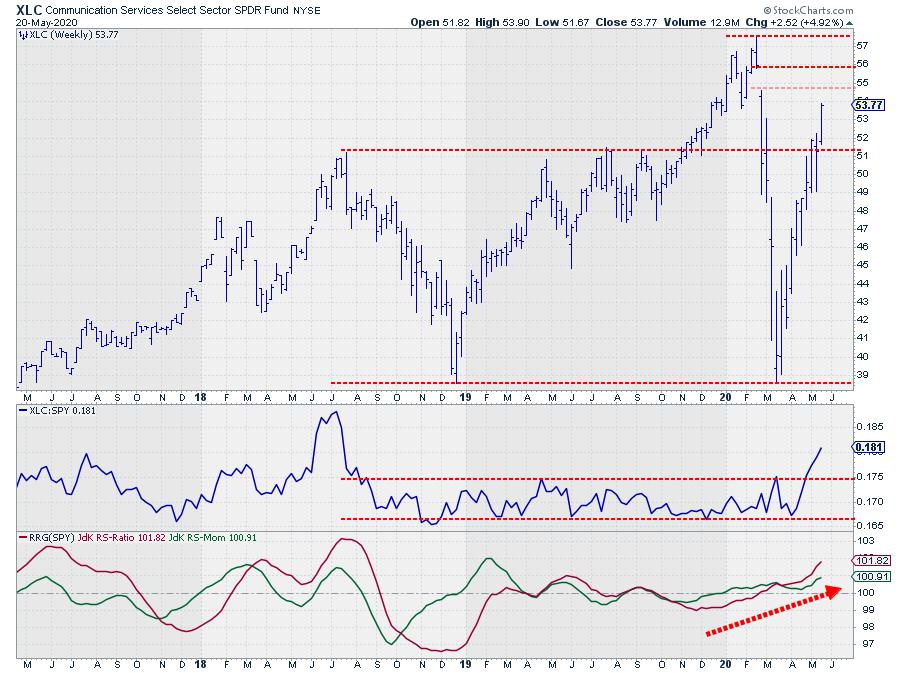
Is Everybody Calling and Texting or What?
by Julius de Kempenaer,
Senior Technical Analyst, StockCharts.com
Communication Services seem to be in high demand, looking at the price chart for XLC.
After the March crash - or was it "just a dip," with hindsight? - XLC rapidly bounced back with a vengeance. I have annotated the chart above with some horizontal support and resistance...
READ MORE
MEMBERS ONLY
Sector Spotlight: Sector Rotation to Higher BETAs
by Julius de Kempenaer,
Senior Technical Analyst, StockCharts.com
On this episode of Sector Spotlight, I look at recent rotations in asset classes and sectors. Next, I present updated BETA values for sectors and compare cap-weighted vs equal-weight values. Finally, I then finish up the show with a pair trade review.
This video was originally broadcast on May 19th,...
READ MORE