MEMBERS ONLY
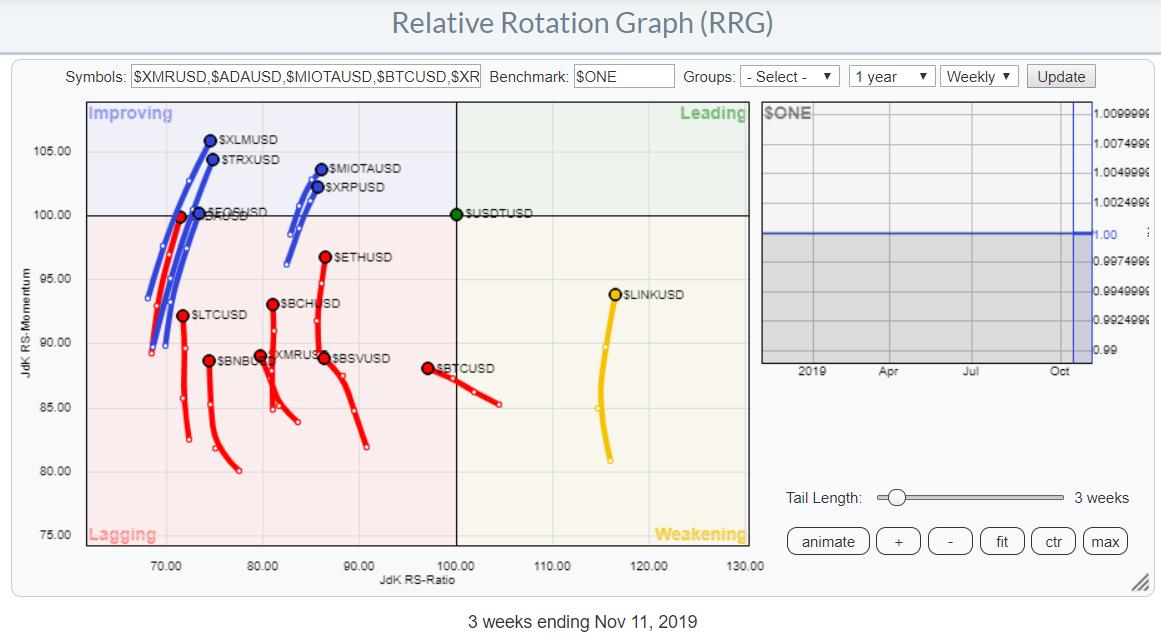
Always Wanted to See Cryptocurrencies on RRG? Now You Can.
by Julius de Kempenaer,
Senior Technical Analyst, StockCharts.com
On 8 November, StockCharts.com announced the arrival of cryptocurrency data in this ChartWatchers article. Regardless of what you think of cryptocurrencies, it's becoming increasingly hard to ignore them as the group of people that engage in trading them continues to grow.
Personally, I have no super-strong belief...
READ MORE
MEMBERS ONLY
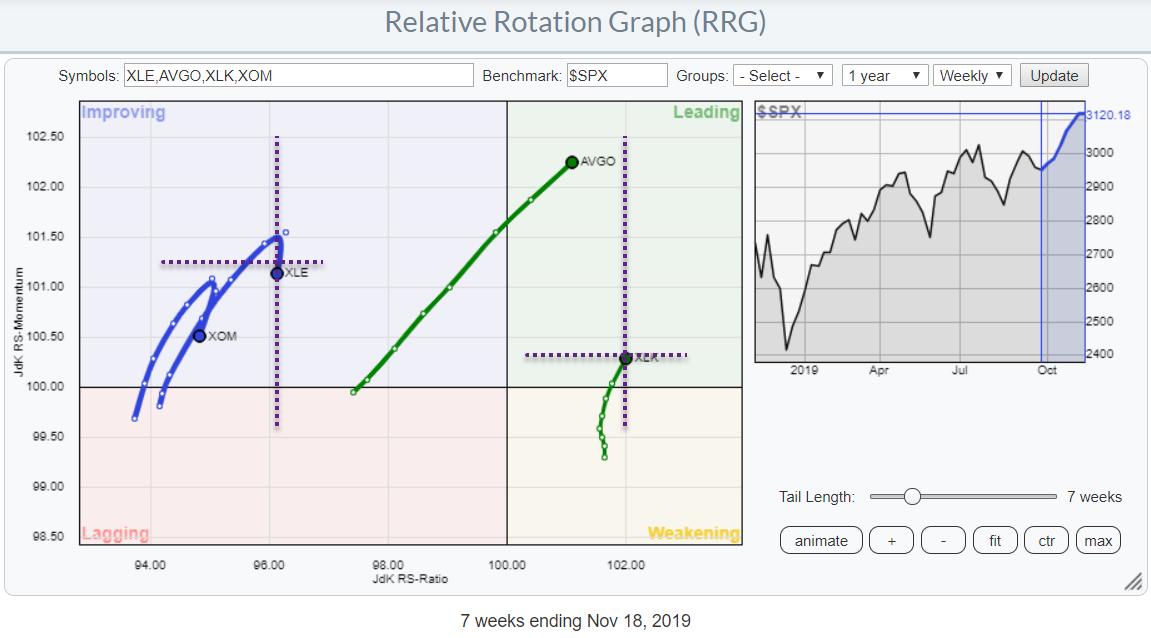
AVGO vs. XOM - Pair Trade Idea
by Julius de Kempenaer,
Senior Technical Analyst, StockCharts.com
Relative Rotation Graphs are perfectly suited for finding pair trade opportunities. In this week's episode of Sector Spotlight (November 19th), I showed one way to find a possible pair-trading opportunity.
Wanting to find a sector with high (or the highest) upward potential and the sector with high (or...
READ MORE
MEMBERS ONLY
Sector Spotlight: How to Spot a Pair Trade on RRG
by Julius de Kempenaer,
Senior Technical Analyst, StockCharts.com
How can you use RRGs (Relative Rotation Graphs) to spot potential pair trades?
In this episode of Sector Spotlight, I explain one way to find a potential pair trading opportunity, searching for a stock with high(est) potential in a sector with high(est) potential and off-setting that position with...
READ MORE
MEMBERS ONLY
How to Plot Cryptocurrencies on Relative Rotation Graphs
by Julius de Kempenaer,
Senior Technical Analyst, StockCharts.com
On 8 November, StockCharts.com announced the arrival of cryptocurrency data in this ChartWatchers article.Regardless of what you think of cryptocurrencies, it's becoming hard to ignore them as the group of people that engage in trading them continues to grow.
Personally, I have no super-strong belief (yet)...
READ MORE
MEMBERS ONLY
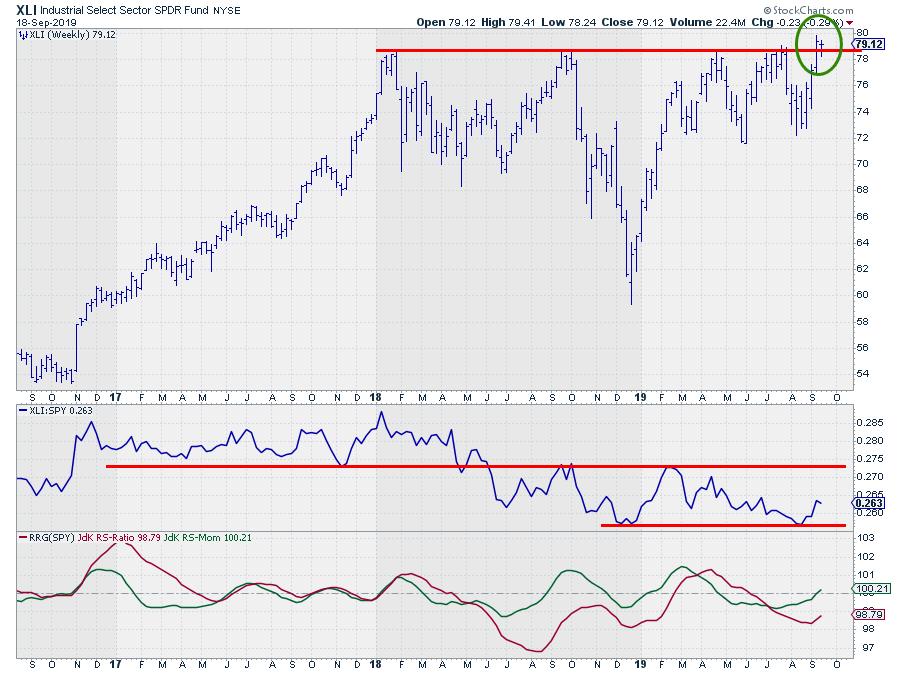
Industrials is a Sector to Watch - Here are Two Stocks that May Stand Out
by Julius de Kempenaer,
Senior Technical Analyst, StockCharts.com
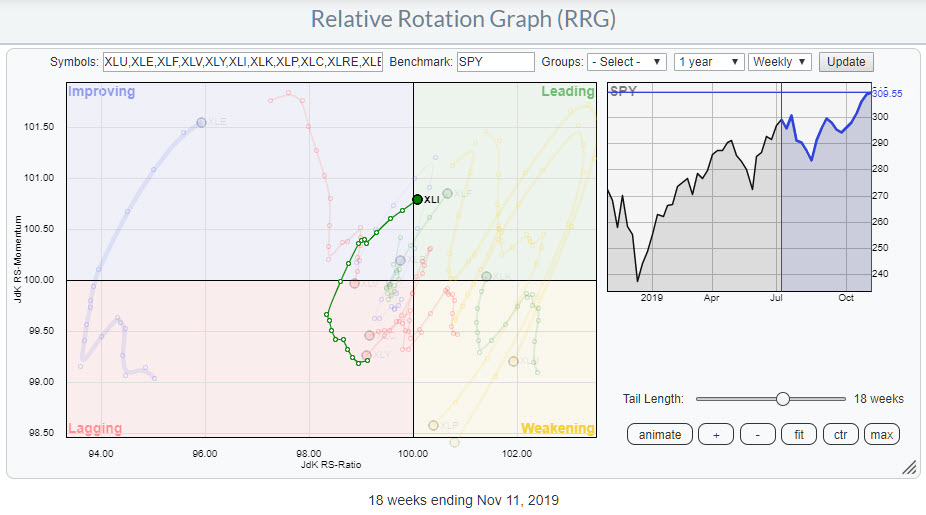
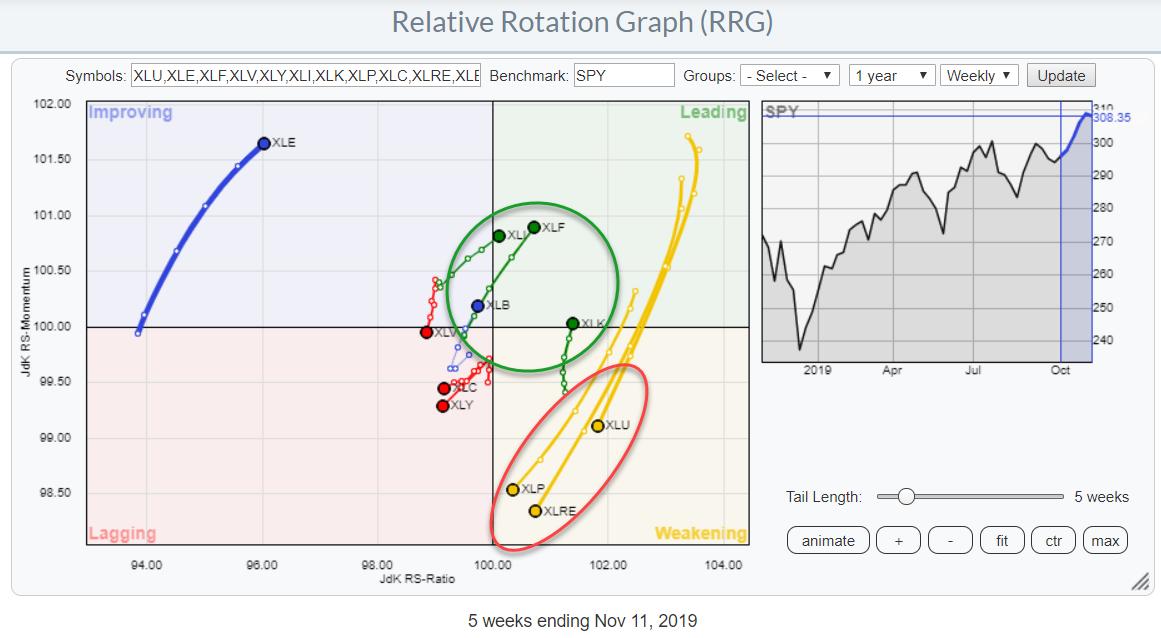
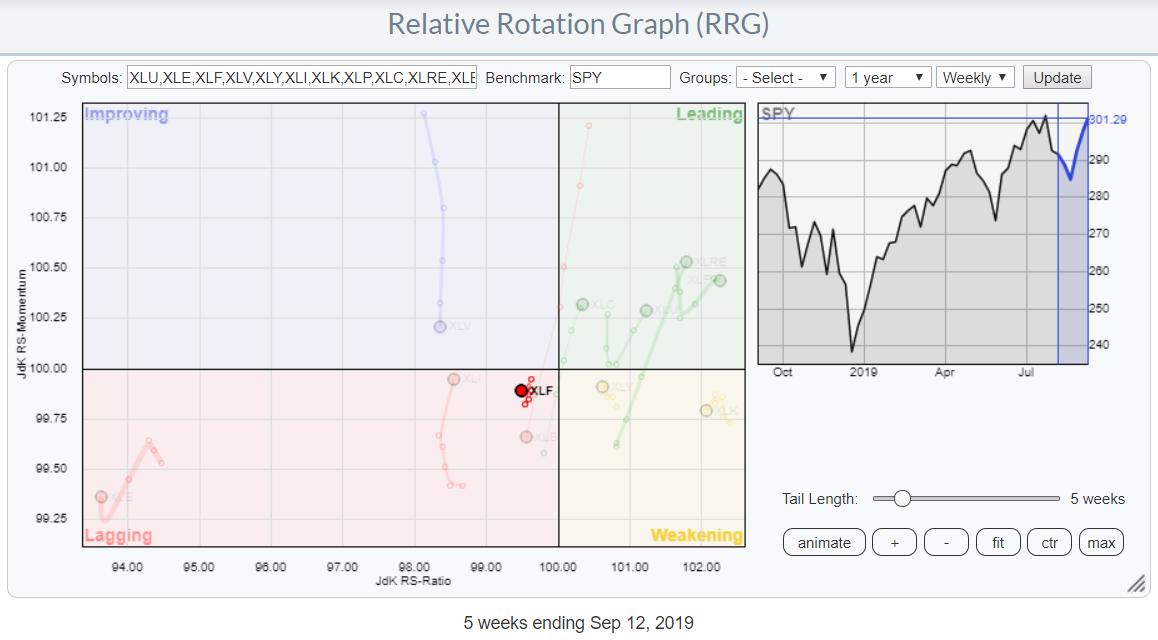
On the Relative Rotation Graph for US sectors, Industrials continue to show a strong rotation. They are now just about to cross over into the lagging quadrant on the weekly timeframe.
I spoke about this strong rotation more in depth in last week's Sector Spotlight show on StockCharts...
READ MORE
MEMBERS ONLY
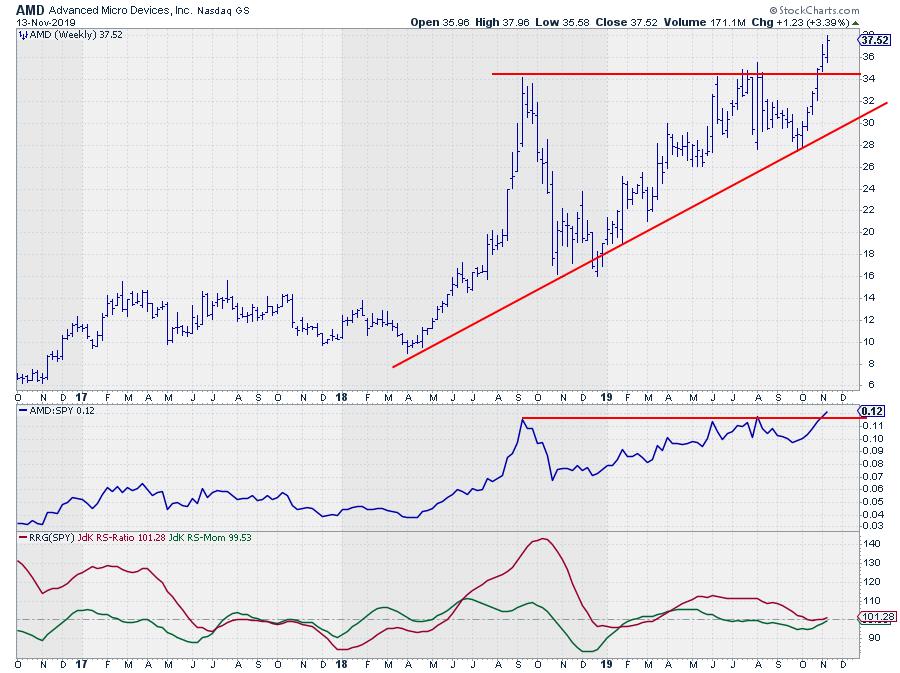
Rotating Back Into the Leading Quadrant While Breaking Above Resistance in Price and Relative Strength... What More Do You Want?
by Julius de Kempenaer,
Senior Technical Analyst, StockCharts.com
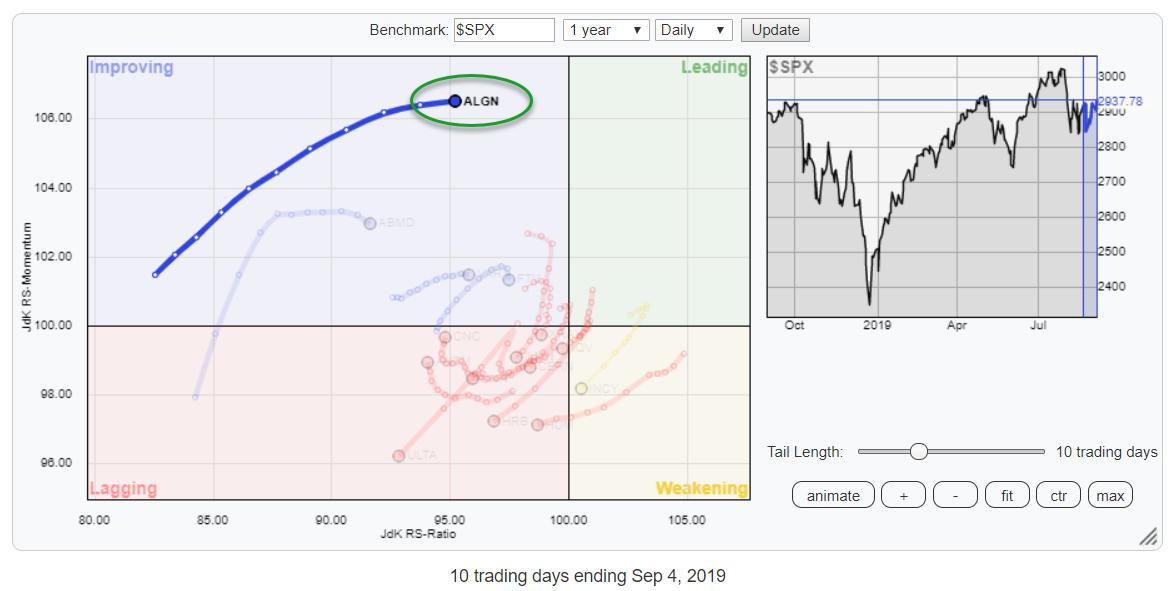
When I ran the RRG for the most active movers in the S&P 500 (at yesterday's close), I noted a strong rotation for AMD.
This stock entered the leading quadrant in the week of 18 March and moved inside that quadrant until the week of June...
READ MORE
MEMBERS ONLY
RRG Shows Bullish Sector Rotation!
by Julius de Kempenaer,
Senior Technical Analyst, StockCharts.com
As it turns out, finding an interesting chart for today's DITC article was not very difficult!
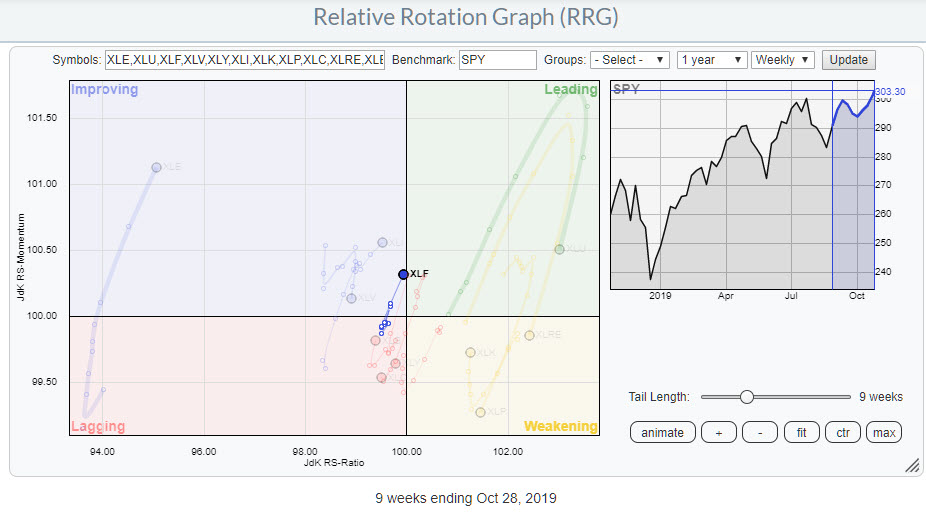
The weekly RRG, printed above, shows a very strong rotation in favor of offensive, high BETA sectors. Industrials, Financials, and Technology are already inside the leading quadrant and showing strong RRG headings....
READ MORE
MEMBERS ONLY
The Yield Curve, What is it? Why is it important? How can we use it?
by Julius de Kempenaer,
Senior Technical Analyst, StockCharts.com
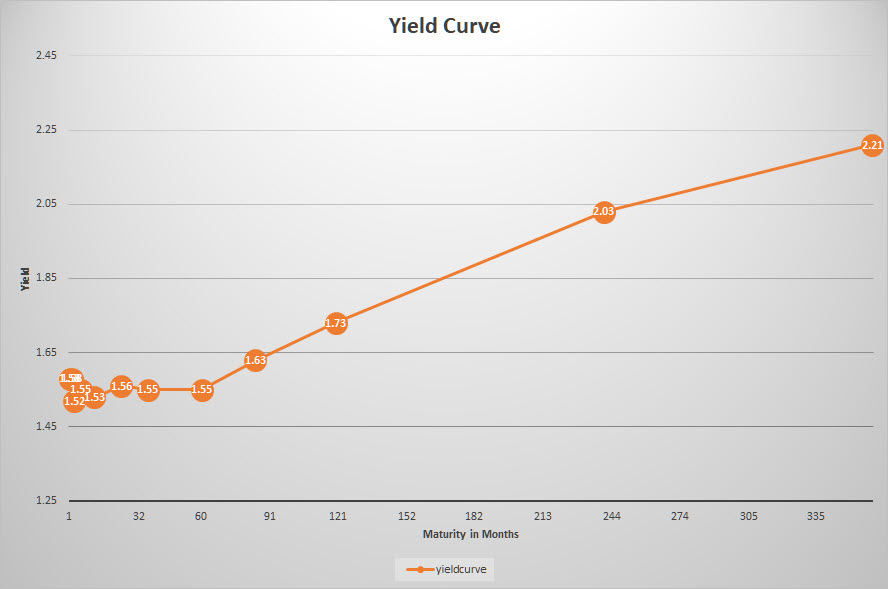
A yield curve is a graphical representation of yields on bonds with different maturities. The most common example is the government bond yield curve, but it is very well possible to render a yield curve for other types of bonds, such as corporate bonds, high yield bonds, etc.
The government...
READ MORE
MEMBERS ONLY
Growth vs Value... a Tough Call At The Moment!
by Julius de Kempenaer,
Senior Technical Analyst, StockCharts.com
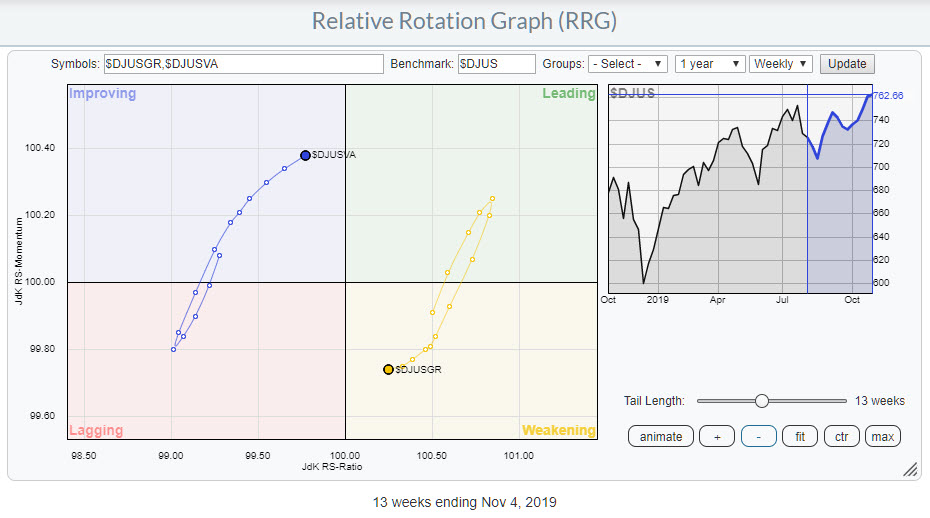
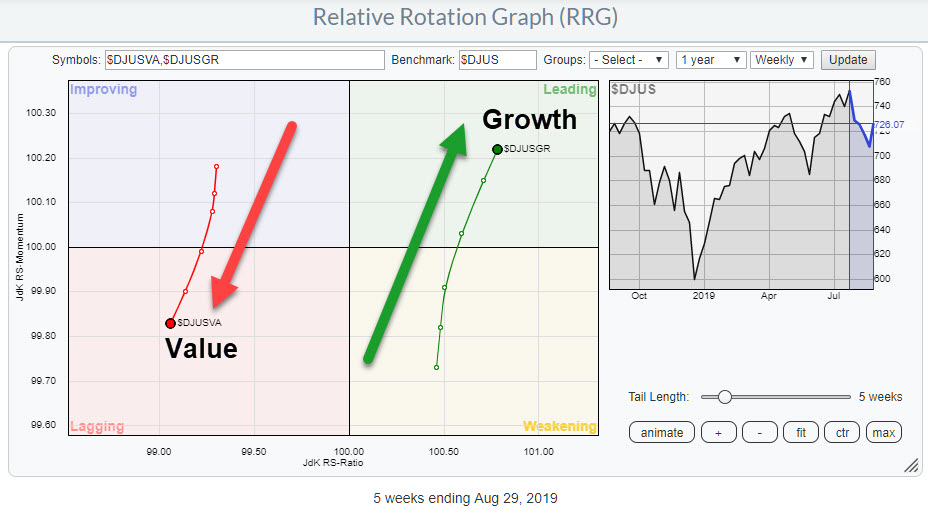
The Growth vs. Value relationship is always an interesting topic, as many believe it provides (additional) information or support for directional moves in the general market (S&P 500).
The Relative Rotation Graph above shows the relationship between these two market segments, using the DJ US index as the...
READ MORE
MEMBERS ONLY
Emerging Commodities?
by Julius de Kempenaer,
Senior Technical Analyst, StockCharts.com
Yesterday, 5 November, was the first Sector Spotlight show of the month. My goal is to use every first show of each month to review the big picture for asset classes and US sectors using monthly charts, and that's exactly what I did yesterday. If you missed the...
READ MORE
MEMBERS ONLY
Rockin' Russia!
by Julius de Kempenaer,
Senior Technical Analyst, StockCharts.com
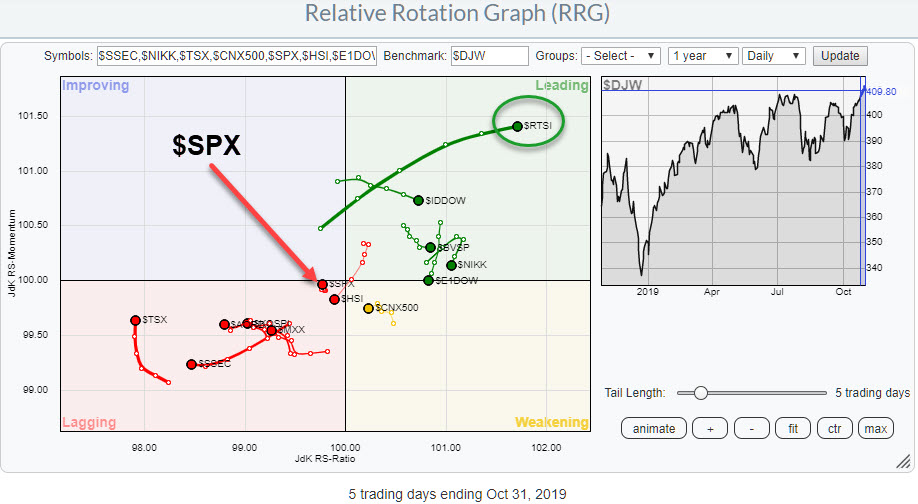
Despite the S&P 500 making new highs and looking strong on the charts, it is definitely not the strongest market in the world at the moment...
The RRG above shows the daily rotation for a universe of major stock market indexes around the world. The S&P...
READ MORE
MEMBERS ONLY
Banking Stocks Are Leading The Financial Sector Higher
by Julius de Kempenaer,
Senior Technical Analyst, StockCharts.com
The Relative Rotation Graph for US sectors remains characterized by steep moves on the vertical (JdK RS-Momentum) axis. This is the Rate of Change metric for the underlying relative trends. Sharp moves in an almost vertical direction, up or down, indicate a sudden change of the underlying trend.
Looking at...
READ MORE
MEMBERS ONLY
Ploughing Through Some Consumer Discretionary Stocks
by Julius de Kempenaer,
Senior Technical Analyst, StockCharts.com
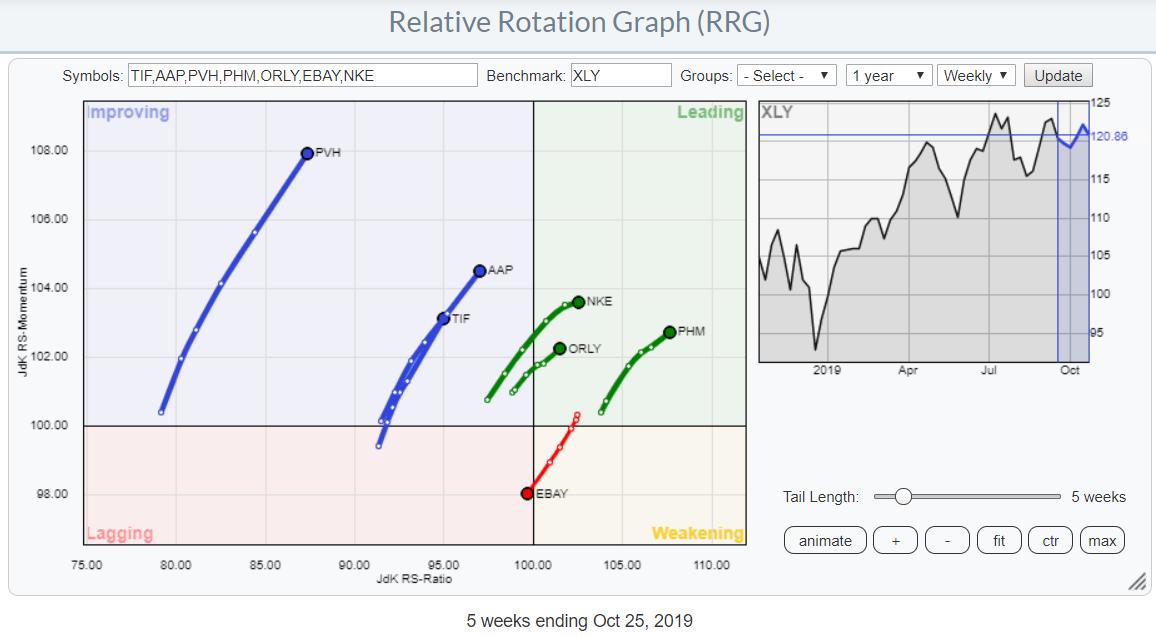
In last week's Sector Spotlight episode, I discussed the positive rotation of the Consumer Discretionary sector on RRG. During the live show, I focused (too much) on the sector and only managed to talk about a few individual stocks. This article will highlight some of the names in...
READ MORE
MEMBERS ONLY
PNC Signals Strength As Its Tail Rotates Back Into The Leading Quadrant on RRG
by Julius de Kempenaer,
Senior Technical Analyst, StockCharts.com
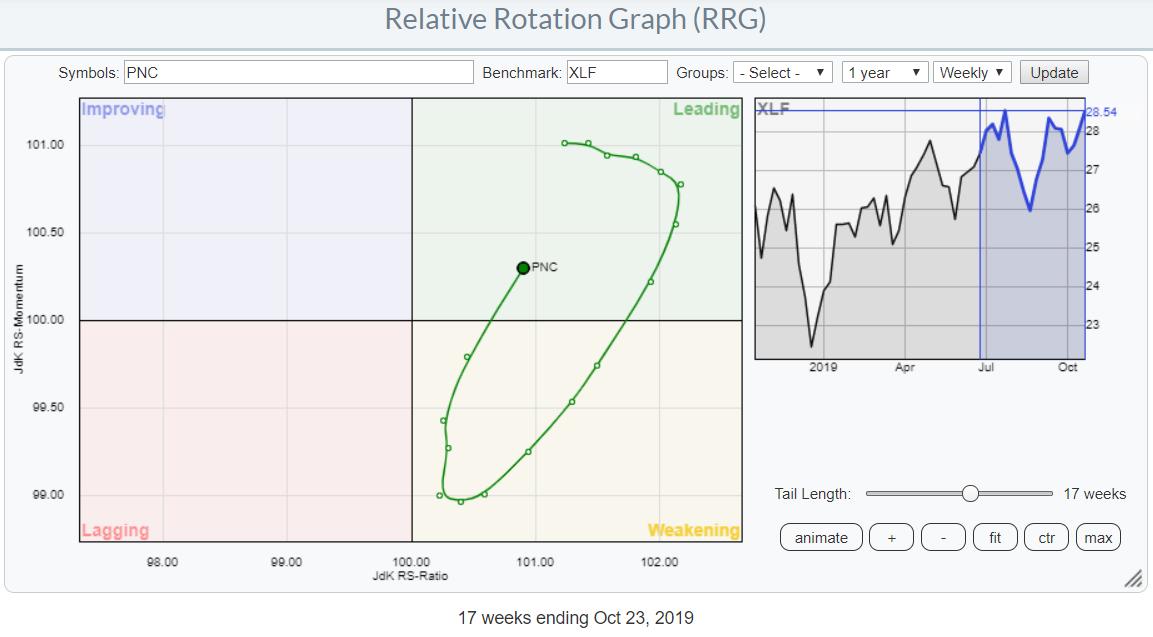
The Financial sector (XLF) continues to pick up relative strength. On the weekly RRG, XLF just moved into the improving quadrant and is positioned very close to the center of the chart. On the daily RRG, a very nice and strong rotation can be seen over the last three weeks....
READ MORE
MEMBERS ONLY
Consumer Discretionary On the Verge of Crossing Over Into The Leading Quadrant on RRG
by Julius de Kempenaer,
Senior Technical Analyst, StockCharts.com
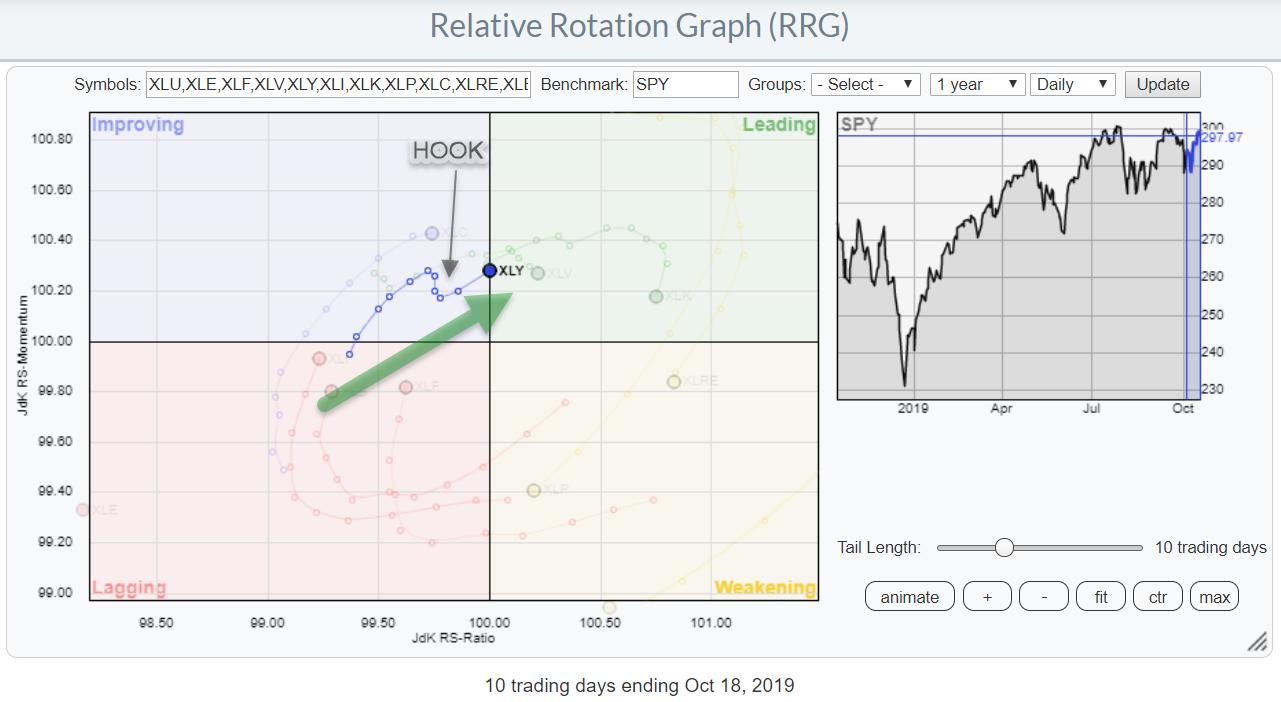
The RRG chart above shows the relative position for US sectors based on last Friday's close.
The sector that stands out most at the moment, at least for me, is Consumer Discretionary. After initially rolling over inside the improving quadrant, this sector "hooked" back on track...
READ MORE
MEMBERS ONLY
Semiconductors Have NOT Broken Out (Yet), But Here's a Pair Trade That May Offer an Opportunity
by Julius de Kempenaer,
Senior Technical Analyst, StockCharts.com
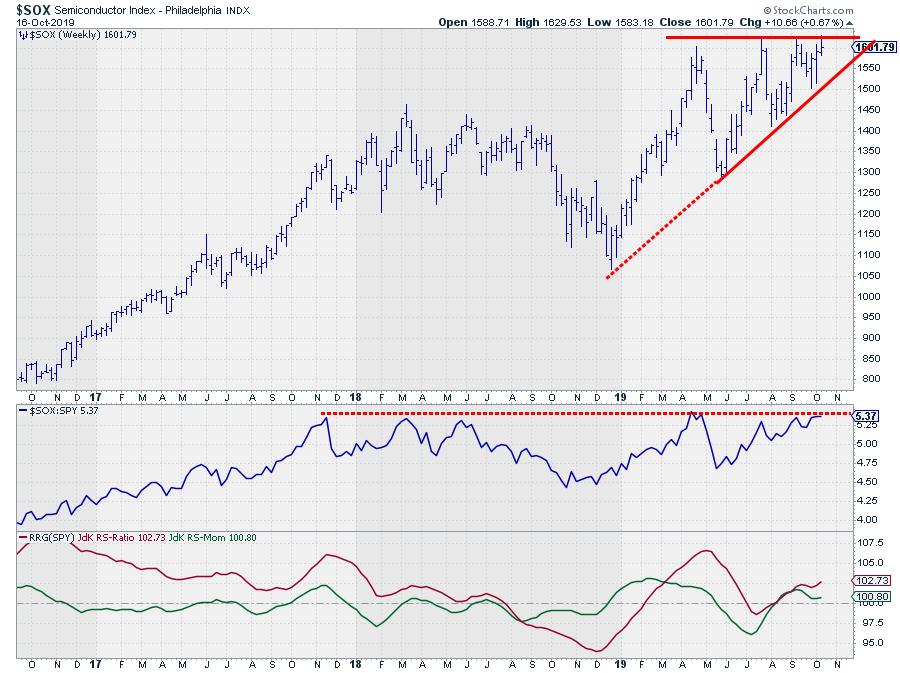
In the past week or so, I've seen a few headlines flying by mentioning the semiconductor index ($SOX) and an alleged breakout. In response, I checked out the chart of $SOX, as printed above, in combination with relative strength versus SPY.
What I see is a pretty big...
READ MORE
MEMBERS ONLY
Measuring Offensive vs Defensive Sectors Using BETA
by Julius de Kempenaer,
Senior Technical Analyst, StockCharts.com
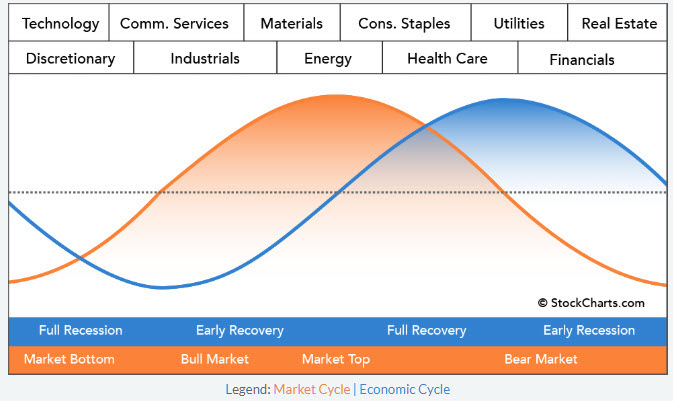
We, including myself, are always talking about offensive and defensive sectors, sector rotation from offensive to defensive, etc. Offensive sectors are the sectors that will do very well - and usually outperform - when the market goes up, while defensive sectors are the sectors that outperform when the market goes...
READ MORE
MEMBERS ONLY
Buying the Top SIX Stocks in The DJ Industrials Index (on a Monthly Basis) Can Keep You Ahead Of The Market
by Julius de Kempenaer,
Senior Technical Analyst, StockCharts.com
What Is Our Track Record?
Ever since the launch of Relative Rotation Graphs on the Bloomberg professional terminal in 2011, some of the most frequently asked questions we've received have been "What's their track record", "How well do they perform?" and "...
READ MORE
MEMBERS ONLY
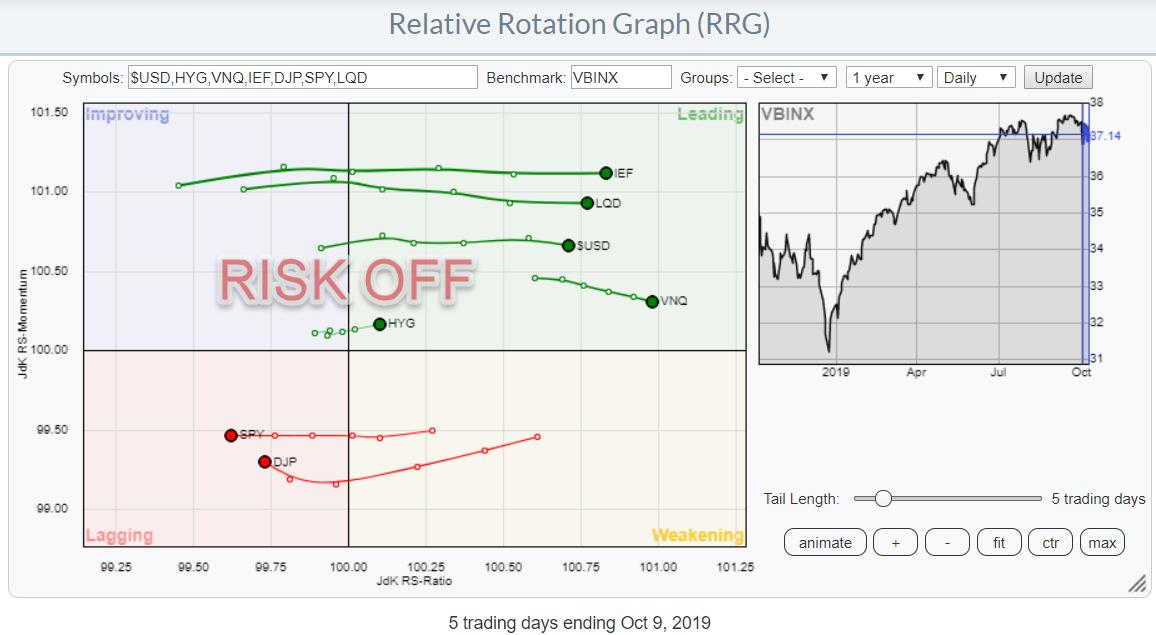
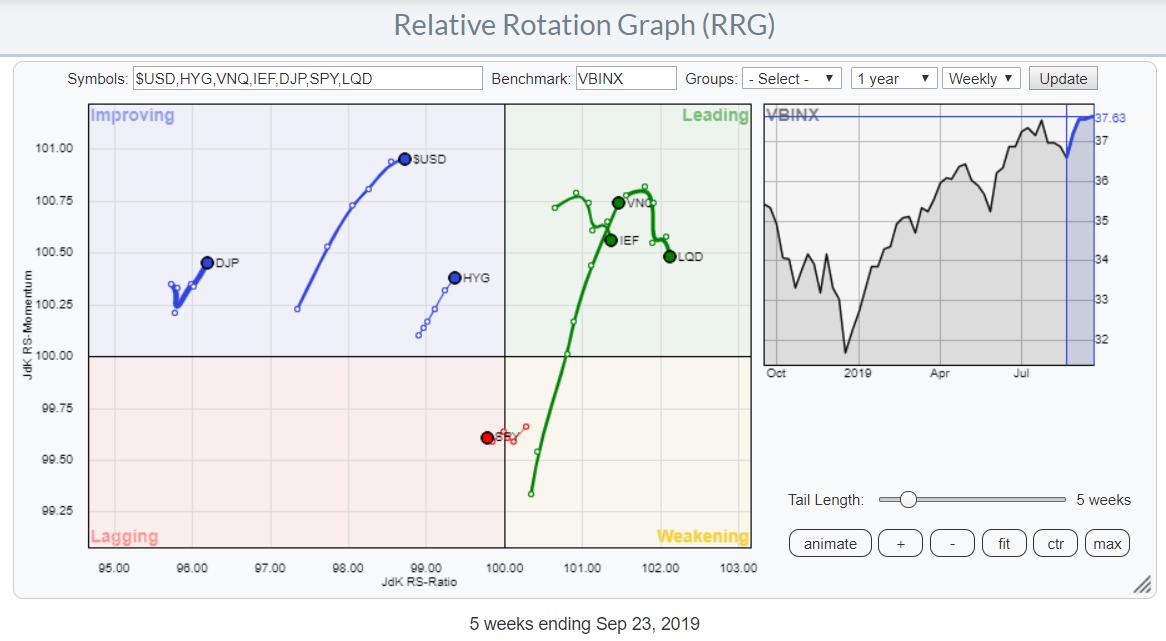
RRG Signals Risk-Off on Daily Chart
by Julius de Kempenaer,
Senior Technical Analyst, StockCharts.com
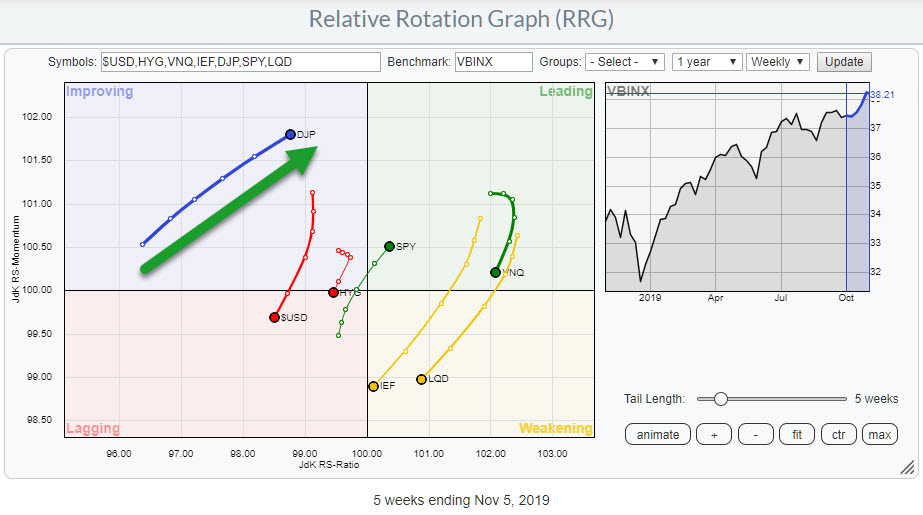
The monthly charts for major markets like the S&P 500 Index are still in clear uptrends - that has not changed. But, in shorter timeframes, things have started to shift with regard to preference for asset classes.
In the first episode of my new StockCharts TV series Sector...
READ MORE
MEMBERS ONLY
Answering Questions From the 1st Episode of Sector Spotlight.
by Julius de Kempenaer,
Senior Technical Analyst, StockCharts.com
Last week, on Tuesday 1st October I hosted the first episode of "Sector Spotlight".
Preparing for something new and then going into the first time hosting a live show was an exciting experience. The problem, at least for me, is that you do not really know how things...
READ MORE
MEMBERS ONLY
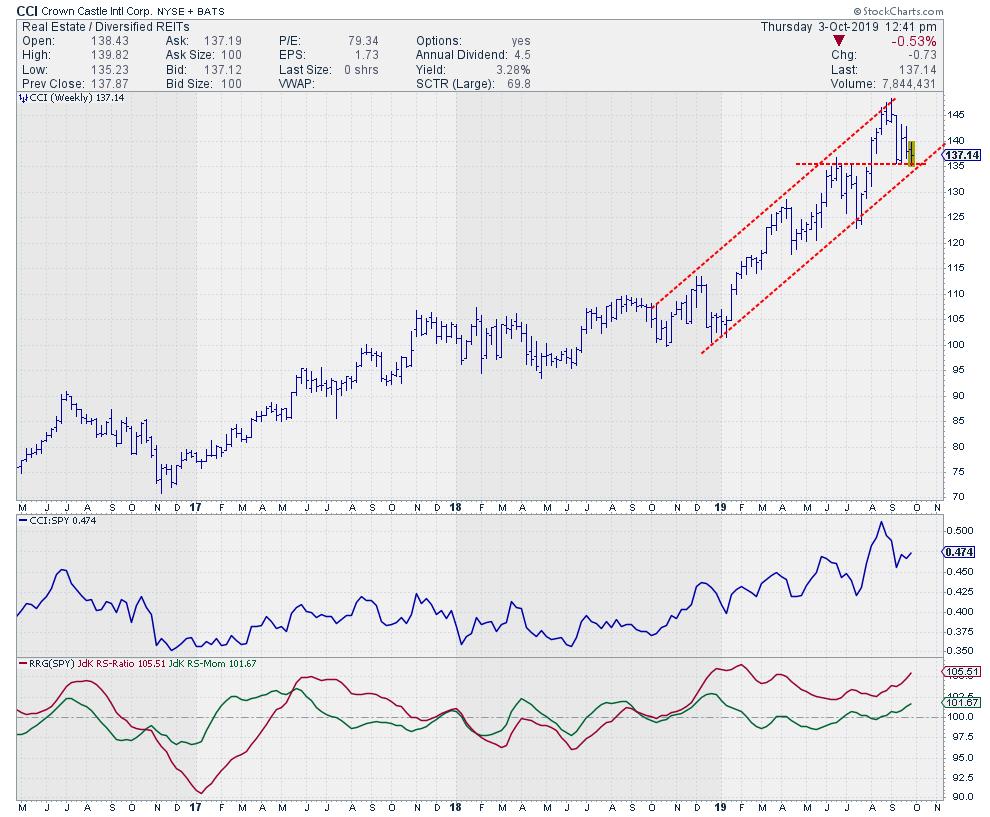
If You Are Looking To "Buy Dips" in Real Estate, Here is Your Dip For CCI!
by Julius de Kempenaer,
Senior Technical Analyst, StockCharts.com
This week is characterized by sinking stocks, at least in the first half of the week, as well as a stabilizing market (so far) on this Thursday. Situations like these lend themselves very well to search for stocks that "test support," especially when they are in a sector...
READ MORE
MEMBERS ONLY
Using Relative Rotation Graphs For "Overwatch" On International Stock Markets.
by Julius de Kempenaer,
Senior Technical Analyst, StockCharts.com
From time to time, you come across new or different ways to look at things or describe them. In my RRG blog from Tuesday, I introduced the concept of military overwatch tactics and compared them to Relative Rotation Graphs.
Since the public launch of Relative Rotation Graphs in 2011 on...
READ MORE
MEMBERS ONLY
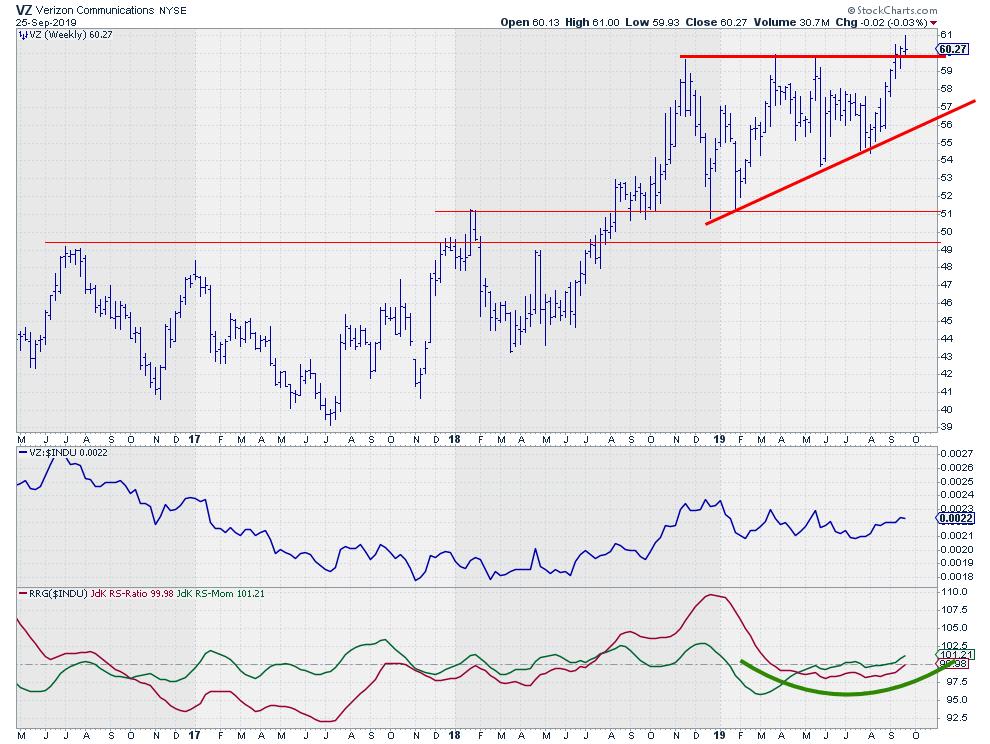
VZ Calling Home?
by Julius de Kempenaer,
Senior Technical Analyst, StockCharts.com
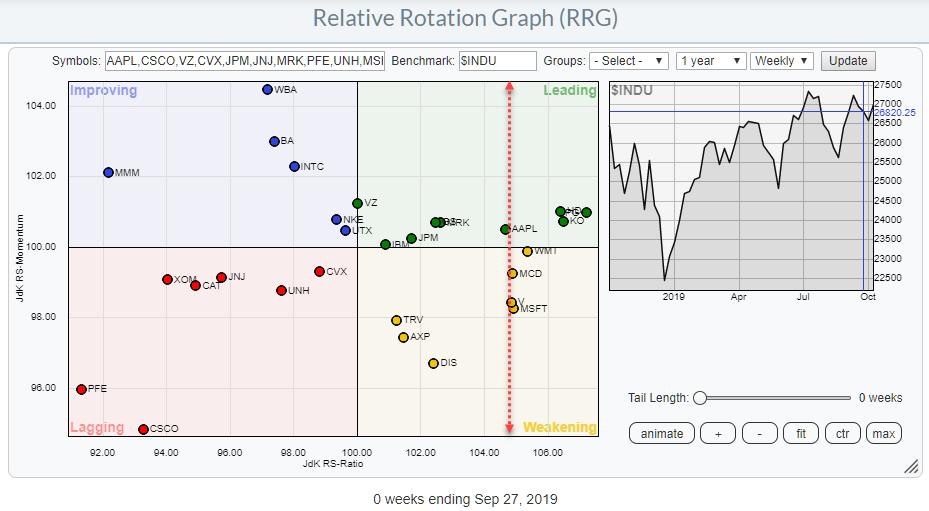
On the weekly Relative Rotation Graph holding the Dow 30 stocks, we can see Verizon (VZ) shooting from the improving quadrant towards leading.
The RRG below shows VZ in isolation. It is hard to see as the move went very fast, but, since mid-July, VZ has completed a rotation from...
READ MORE
MEMBERS ONLY
A Strong Overwatch Unit is Mission Critical
by Julius de Kempenaer,
Senior Technical Analyst, StockCharts.com
From time to time, you come across new or different ways to look at things or describe them.
Since the public launch of Relative Rotation Graphs in 2011 on Bloomberg terminals, we have been using the tag-line "RRG provides you with the BIG picture in ONE picture" as...
READ MORE
MEMBERS ONLY
Here Is Another Sector Breaking To New Highs!
by Julius de Kempenaer,
Senior Technical Analyst, StockCharts.com
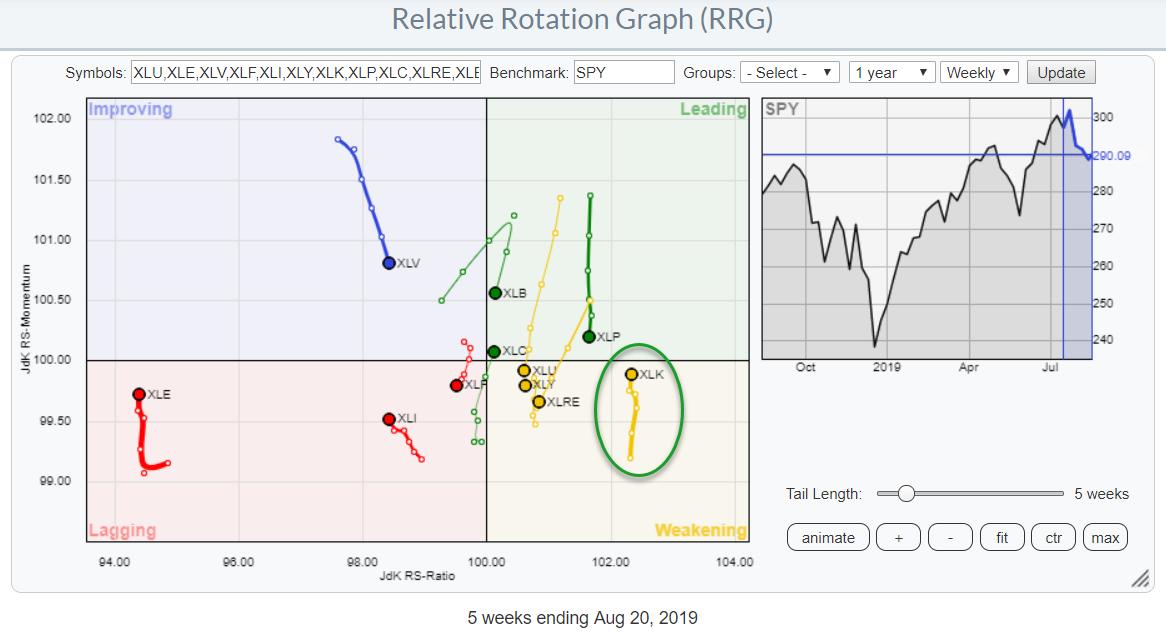
Today, I posted a Relative Rotation Graph for US sectors on my Twitter and Instagram feeds highlighting the clear split between some sectors now visible on the daily timeframe. One of these sectors is Industrials, which is traveling deeper into the leading quadrant at a stable, almost horizontal, relative momentum....
READ MORE
MEMBERS ONLY
The Financial Sector is Improving, Leadership Role for JPM
by Julius de Kempenaer,
Senior Technical Analyst, StockCharts.com
On the weekly Relative Rotation Graph for US sectors, the Financial sector is positioned just inside the lagging quadrant, very close to the benchmark (center of the chart). It arrived here after a nearly vertical drop from the improving quadrant after failing to rotate into leading.
During the last five...
READ MORE
MEMBERS ONLY
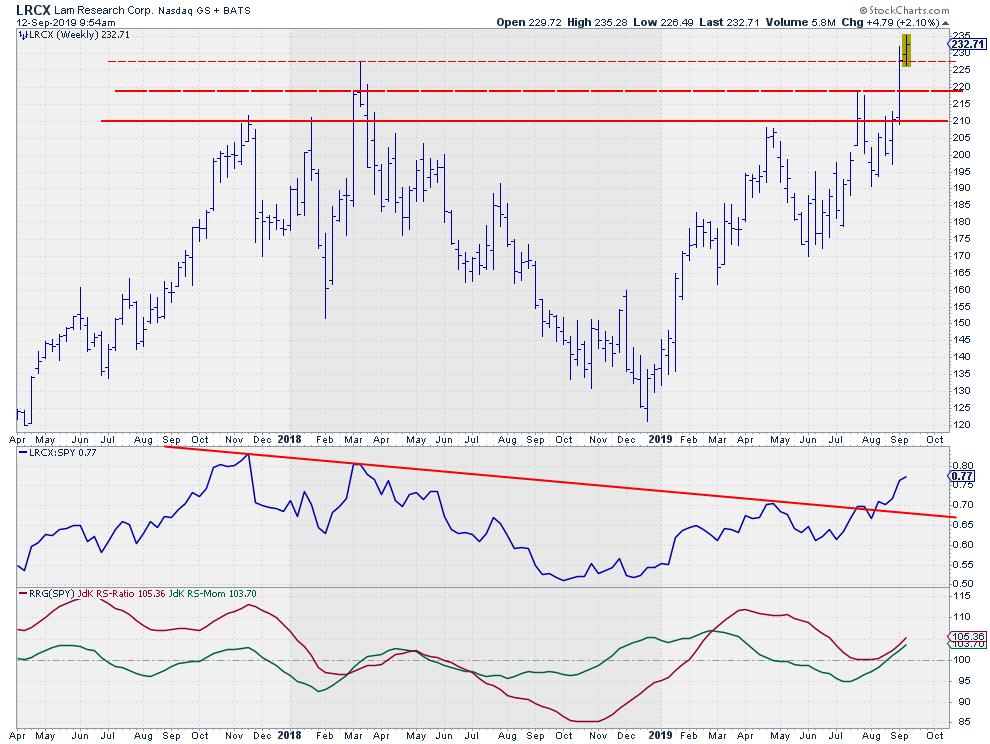
LRCX is Breaking To New Highs While Relative Strength is Picking Up
by Julius de Kempenaer,
Senior Technical Analyst, StockCharts.com
On the Relative Rotation Graph for technology stocks, LRCX stands out, with its relatively long tail and its push into the leading quadrant at a strong RRG-Heading. Such a rotation is more than enough reason to open up a regular chart for further investigation.
The chart above shows LRCX on...
READ MORE
MEMBERS ONLY
Using Scan and RRG for Bottom Fishing
by Julius de Kempenaer,
Senior Technical Analyst, StockCharts.com
One of the most frequently asked questions I receive, with regard to Relative Rotation Graphs on StockCharts.com, is if and how the scan engine can be used to scan for certain events on an RRG.
Well, the answer is you can NOT - not yet, anyway. It's...
READ MORE
MEMBERS ONLY
Is This Stock Ready For a Turnaround - or Just a Quick Bounce?
by Julius de Kempenaer,
Senior Technical Analyst, StockCharts.com
The Relative Rotation Graph (RRG) above is the result of a scan that I am running from time to time. Before you ask... ;) in an upcoming RRG Charts blog, I will explain how I got to this selection of stocks, including the scan-code.
For now, let's concentrate on...
READ MORE
MEMBERS ONLY
Growth vs. Value Rotation is Sending a Very Clear Message on RRG
by Julius de Kempenaer,
Senior Technical Analyst, StockCharts.com
One of the Relative Rotation Graphs that I like to keep an eye on in order to get a handle on the general market condition (for stocks) is the chart above, which shows the rotation of Value versus Growth stocks using the Dow Jones US Index as the benchmark. The...
READ MORE
MEMBERS ONLY
A (pair) Trade Idea in Consumer Discretionary
by Julius de Kempenaer,
Senior Technical Analyst, StockCharts.com
Looking at the daily Relative Rotation Graph for US sectors, we can see that Consumer Discretionary is inside the improving quadrant and about to cross over into leading at a strong RRG-Heading. For the near-term, this makes XLY a sector to keep an eye on.
In order to look for...
READ MORE
MEMBERS ONLY
What do you want from me?
by Julius de Kempenaer,
Senior Technical Analyst, StockCharts.com
Rumour has it that a new show will be launching soon on StockCharts TV. The focus for this weekly 30-minute adventure will be on sectors, with yours truly as the host/presenter for this program (so you can count on a healthy dose of RRG-related content).
Don't worry,...
READ MORE
MEMBERS ONLY
Here Is a Leading Stock In The Semiconductor Group
by Julius de Kempenaer,
Senior Technical Analyst, StockCharts.com
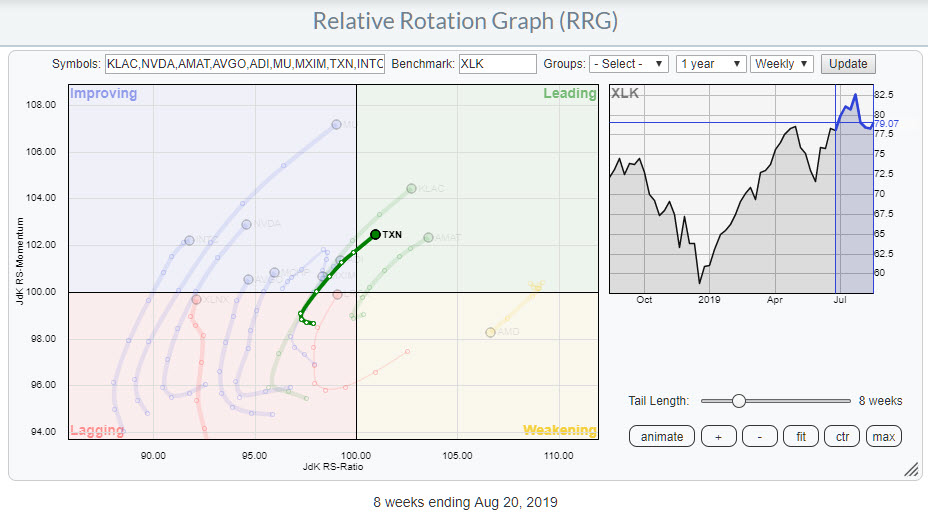
Yesterday, I wrote about the Technology sector in my RRG Charts blog, where I discussed how the semiconductor stocks as a group showed relative strength against XLK. For this DITC article, I want to work off that subset of stocks in the technology space.
The Relative Rotation Graph above shows...
READ MORE
MEMBERS ONLY
Strong Rotation for Technology Sector With a Positive RRG-Heading on Semiconductors
by Julius de Kempenaer,
Senior Technical Analyst, StockCharts.com
On the weekly Relative Rotation Graph, the Technology sector is currently inside the weakening quadrant, but is moving almost vertically up towards the leading quadrant. That is to say, it's moving back to the leading quadrant, as it already completed a strong rotation through that leading quadrant from...
READ MORE
MEMBERS ONLY
Relative Rotation Graphs Can Show You So Much More Than Just Sector Rotation
by Julius de Kempenaer,
Senior Technical Analyst, StockCharts.com
Relative Rotation Graphs, or "RRGs", were born while I was working as a sell-side analyst for an investment bank in Amsterdam, doing research and making calls on stocks and sectors. The clientele of the bank were all institutional investors, ranging from pension funds and endowments to hedge funds....
READ MORE
MEMBERS ONLY
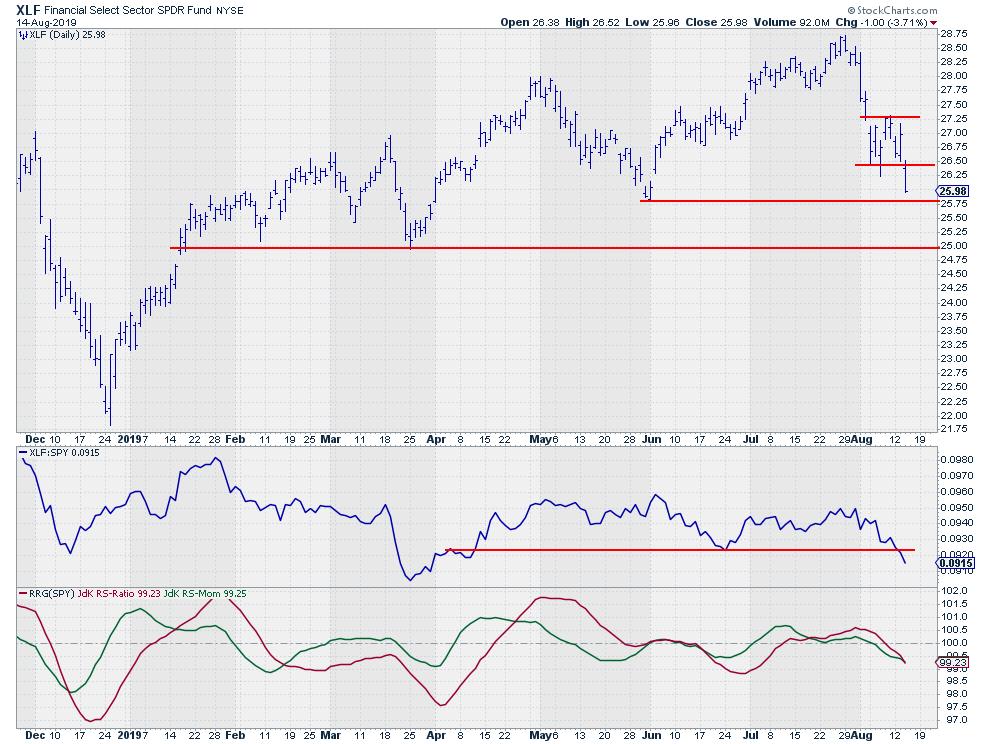
Financials Are Breaking (more) Support While Rotating Into the Lagging Quadrant On The RRG
by Julius de Kempenaer,
Senior Technical Analyst, StockCharts.com
On the Relative Rotation Graph for US sectors, the tail on XLF, the Financials sector, caught my eye this morning. After a short stint through the leading quadrant, XLF had a sharp turn lower and entered the weakening quadrant, in which it spent only three days before rotating into lagging....
READ MORE
MEMBERS ONLY
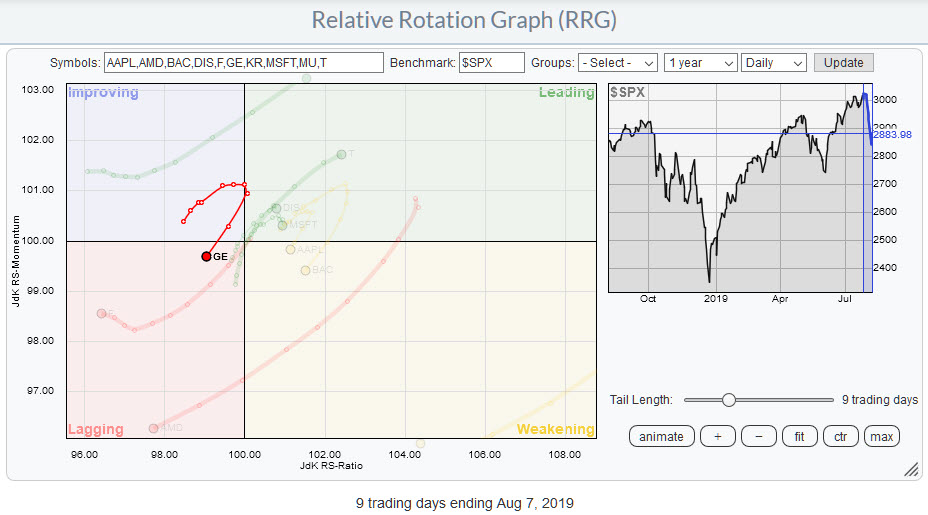
GE is Doing It Again!
by Julius de Kempenaer,
Senior Technical Analyst, StockCharts.com
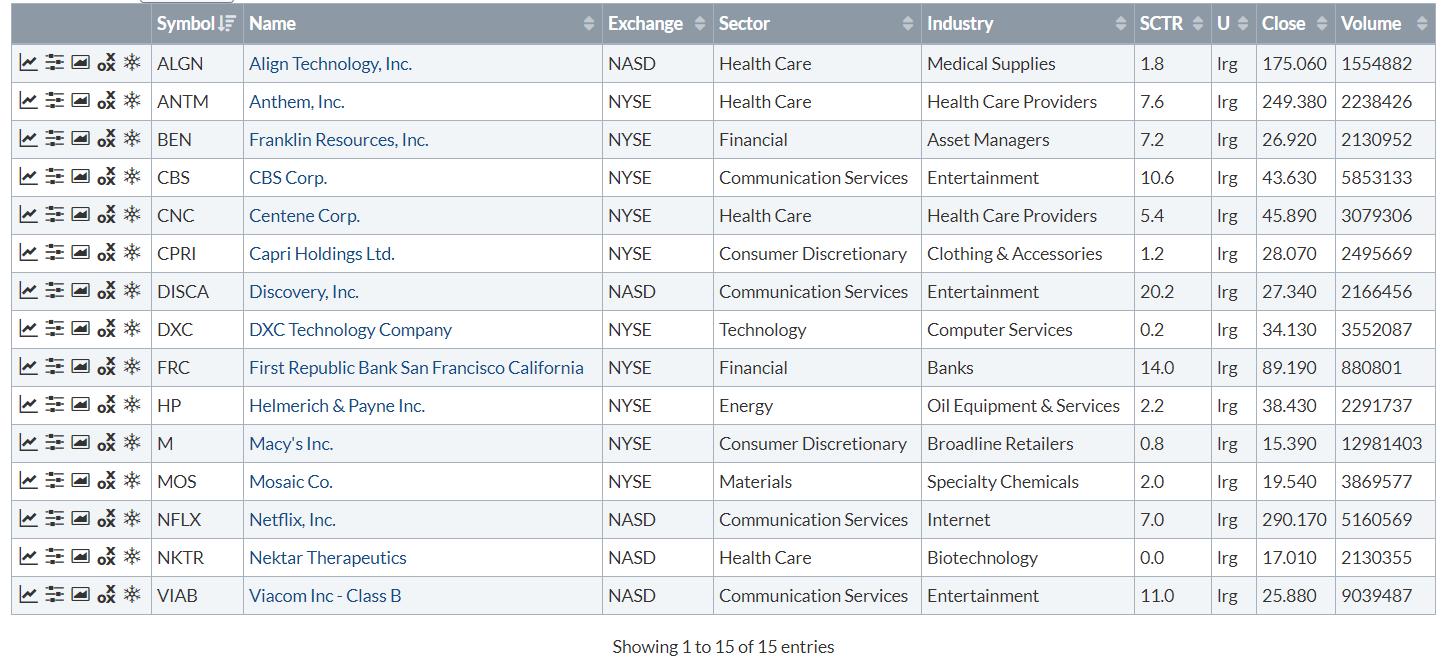
A good way for you to check what has been driving a particular market is to go to the "Market Movers" widget on your dashboard and select the universe that you are interested in.
To the right, I have printed the table showing the top 10 most active...
READ MORE
MEMBERS ONLY
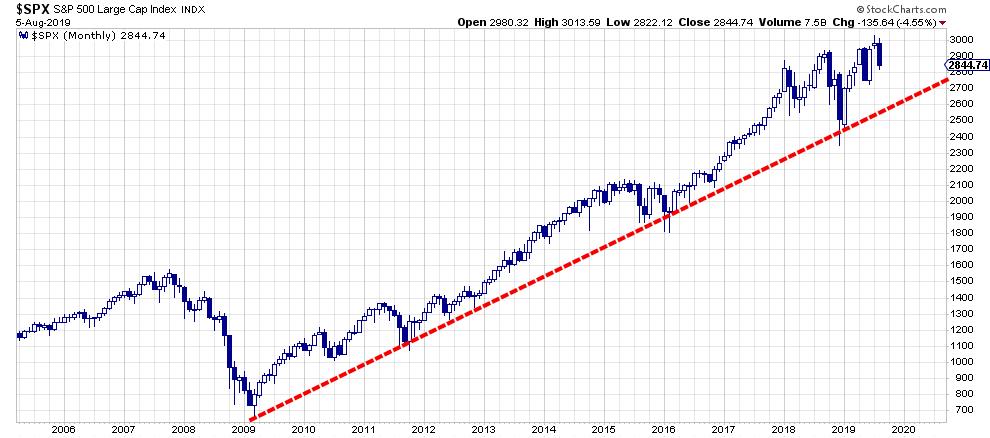
This is My Trendline, Which One is Yours?
by Julius de Kempenaer,
Senior Technical Analyst, StockCharts.com
Never a dull moment when it comes to the markets. Just when you thought you had it all figured out, Mr. Market throws us another curve-ball that we all have to deal with.
The last few days have been pretty hectic, given a 200-point drop in the S&P...
READ MORE
MEMBERS ONLY
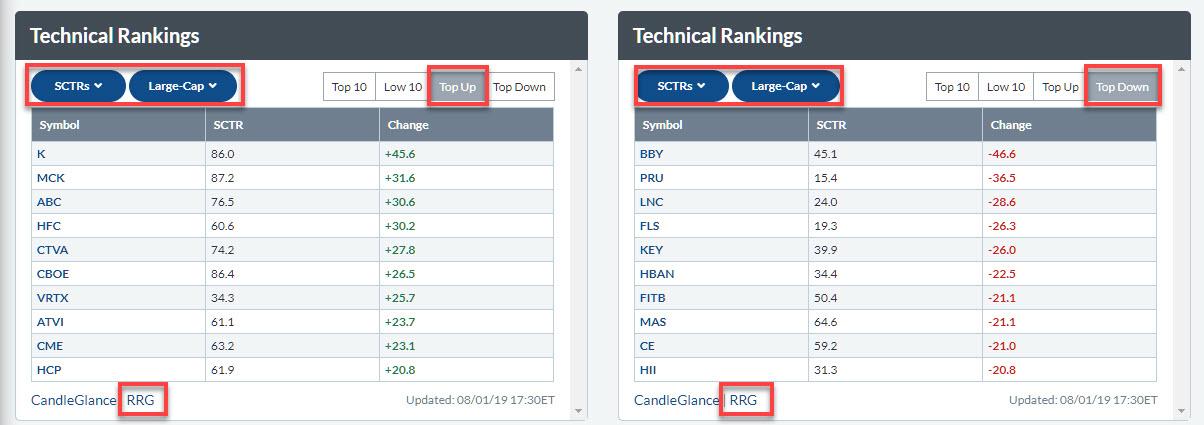
Using SCTRs to Fill Your Relative Rotation Graph
by Julius de Kempenaer,
Senior Technical Analyst, StockCharts.com
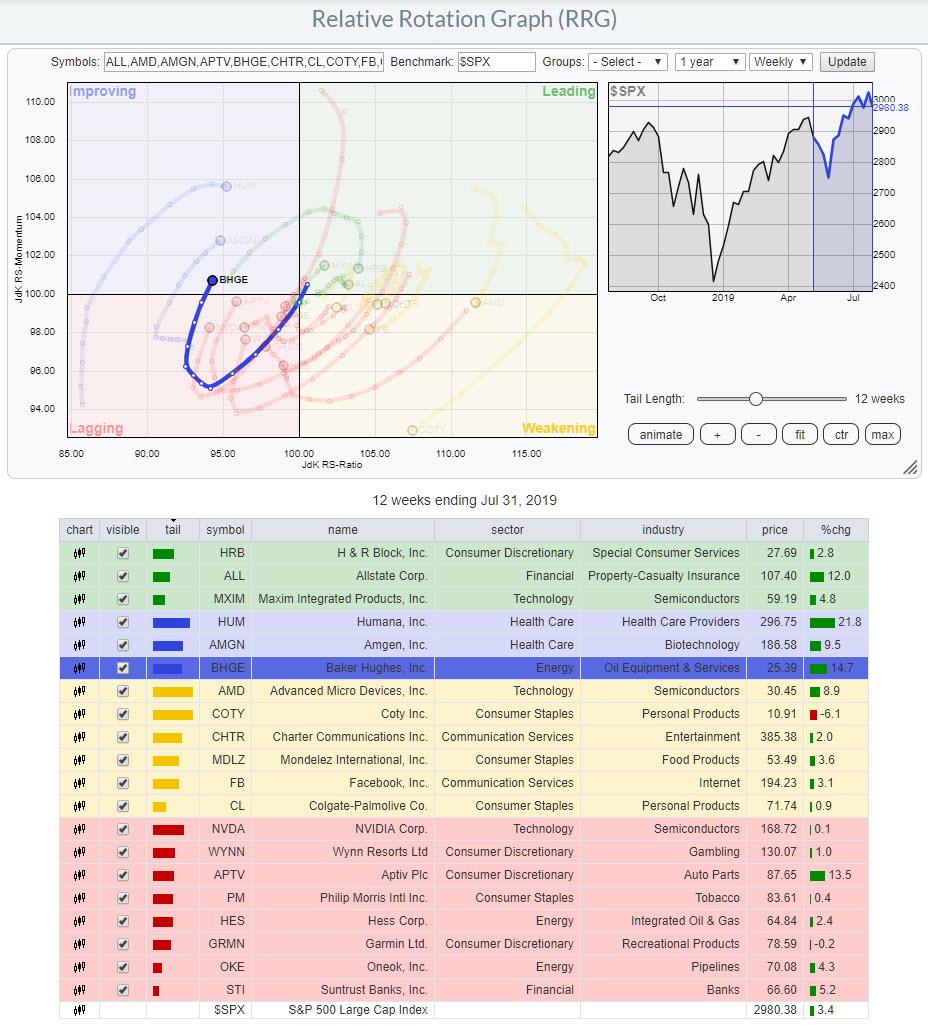
In my latest "Don't Ignore This Chart" article, I used a Relative Rotation Graph holding 20 stocks as a starting point to find an interesting-looking rotation and a possible trading opportunity for BHGE. The question: how was I able to select those 20 stocks to include...
READ MORE
MEMBERS ONLY
BHGE Rapidly Improving and Ready to Jump
by Julius de Kempenaer,
Senior Technical Analyst, StockCharts.com
Here's a Relative Rotation Graph filled with stocks that I got off my StockCharts.com dashboard this morning:
Your Dashboard is a great way to get an overview of what's going on in the market and organize your workflow on the site. If you are interested...
READ MORE