MEMBERS ONLY
Is Consumer Discretionary About to Take Over the Market?
by Julius de Kempenaer,
Senior Technical Analyst, StockCharts.com
Julius breaks down the latest asset class and sector rotations in order to show where real market strength is building. Stocks continue to outperform bonds, but the spotlight is on sectors: technology remains strong, financials and industrials are gaining, and consumer discretionary is accelerating with broad participation. Meanwhile, defensive groups...
READ MORE
MEMBERS ONLY
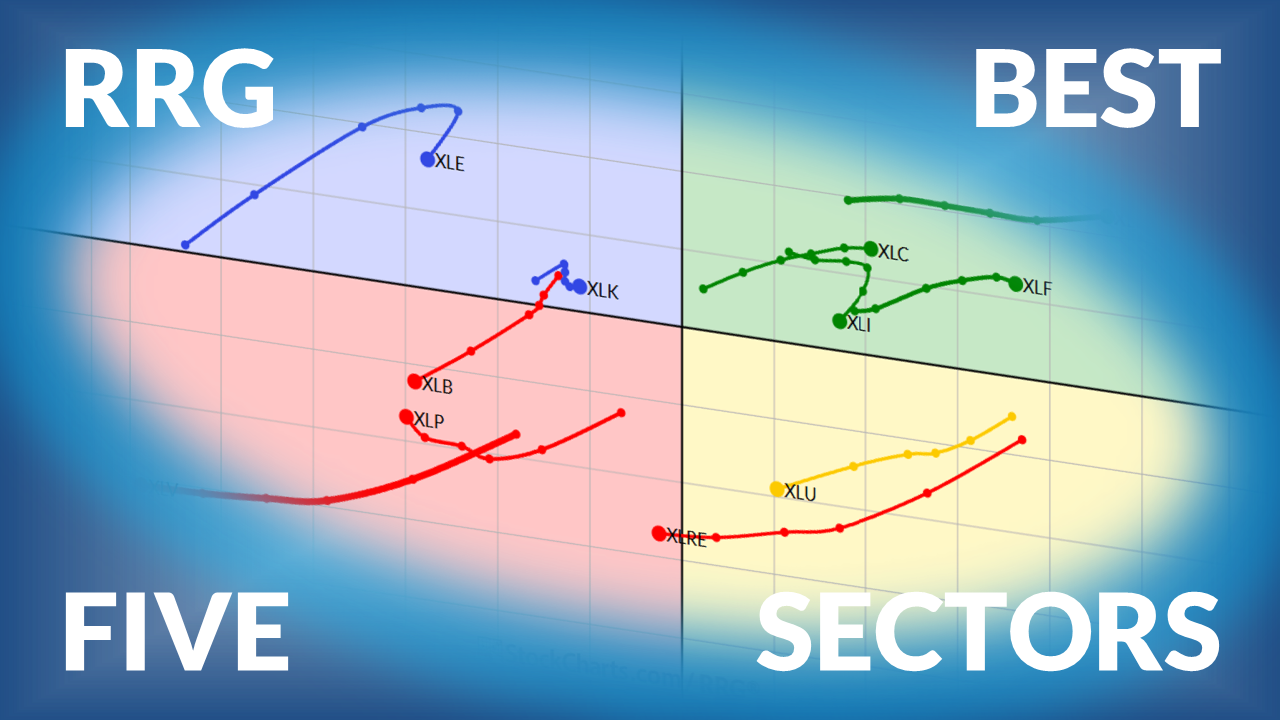
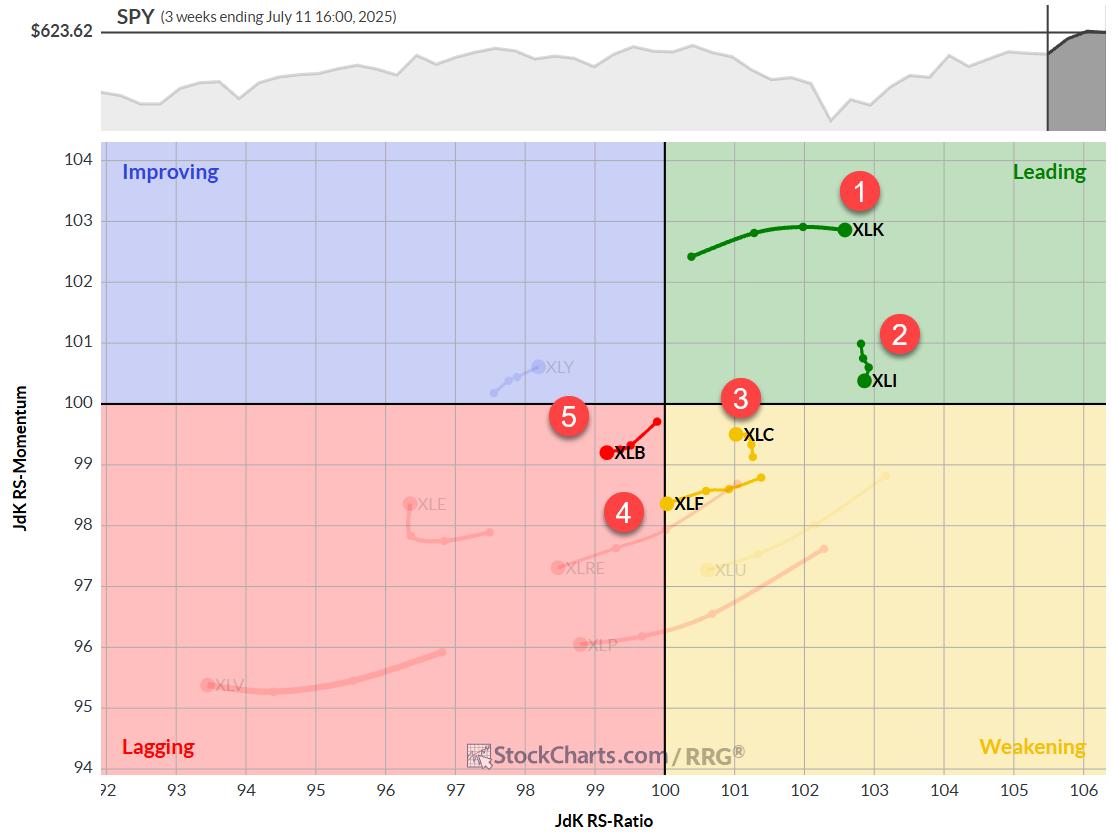
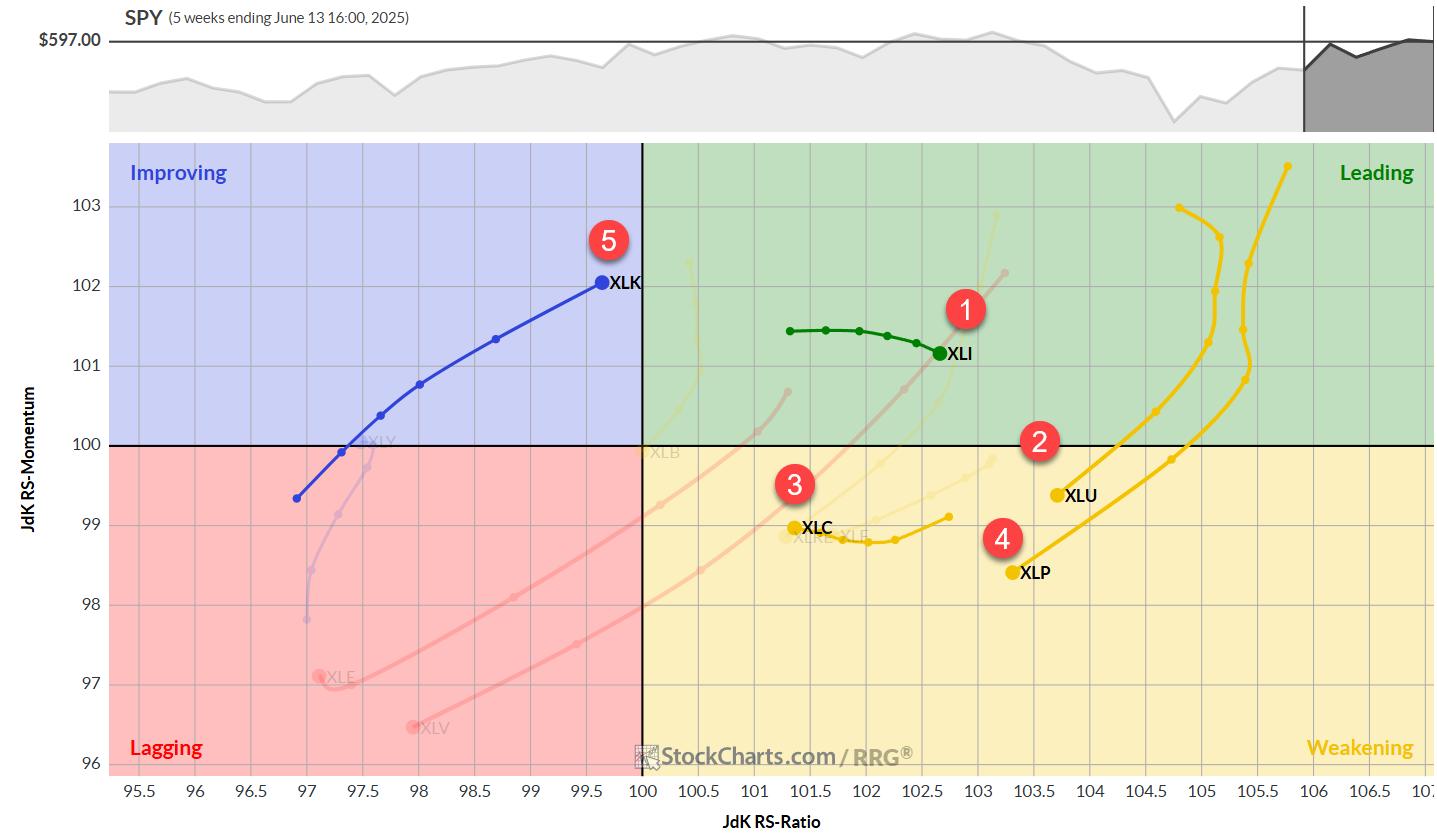
The Best Five Sectors this Week, #32
by Julius de Kempenaer,
Senior Technical Analyst, StockCharts.com
Weekly update on US sector rotation using Relative Rotation Graphs...
READ MORE
MEMBERS ONLY
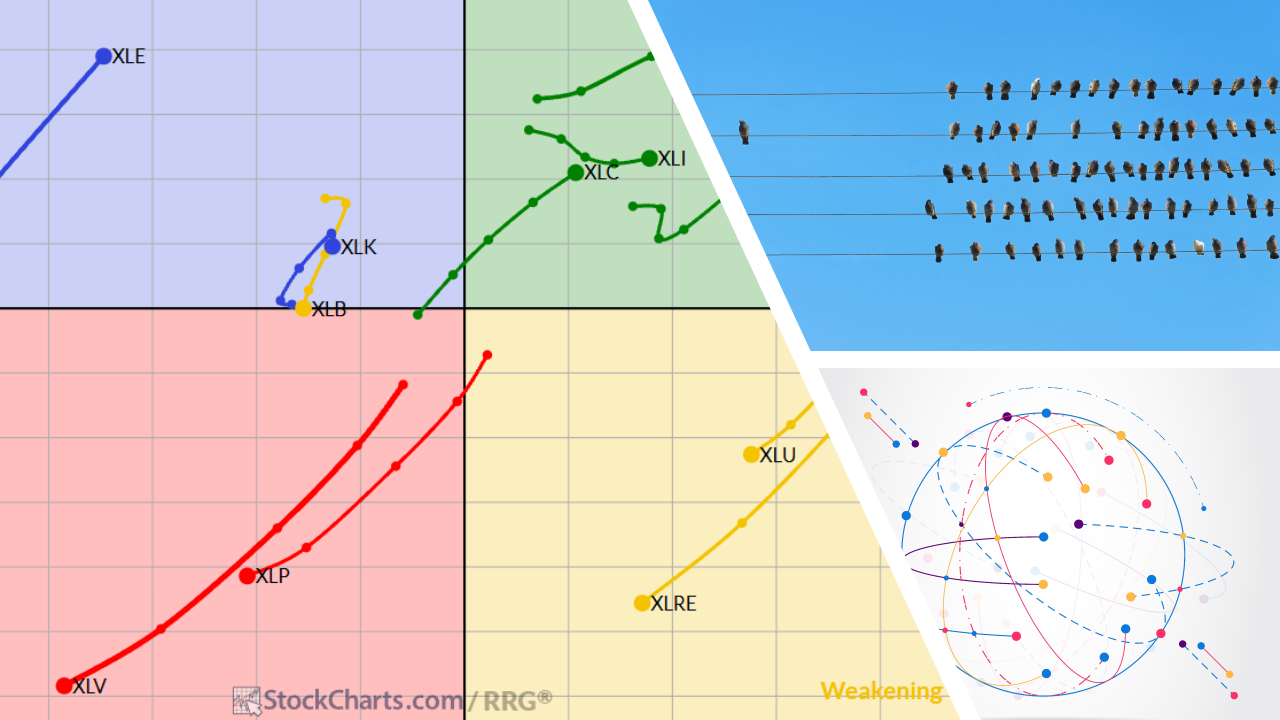
Visualizing Breadth and Rotation Using RRG
by Julius de Kempenaer,
Senior Technical Analyst, StockCharts.com
When it comes to understanding what’s really going on beneath the surface of the market, two key concepts come to mind: breadth and rotation. Breadth helps us gauge the participation behind a trend, while rotation reveals where the strength is moving within the universe we’re analyzing. Combine both,...
READ MORE
MEMBERS ONLY
Consumer Discretionary Breakouts — 3 Stocks to Watch Now
by Julius de Kempenaer,
Senior Technical Analyst, StockCharts.com
Discover which sectors are leading — and which to avoid — with Julius' latest RRG analysis. Follow along as he breaks down weekly and daily sector rotations, revealing technology’s dominance, potential in consumer discretionary, and why some defensive sectors are showing unexpected strength. Julius then dives deeper into the consumer...
READ MORE
MEMBERS ONLY
The Best Five Sectors, #31
by Julius de Kempenaer,
Senior Technical Analyst, StockCharts.com
Julius presents his weekly update on US sector rotation based on Relative Rotation Graphs....
READ MORE
MEMBERS ONLY
The Best Five Sectors, #30
by Julius de Kempenaer,
Senior Technical Analyst, StockCharts.com
Julius presents his weekly update on US sector rotation rankings using Relative Rotation Graphs (RRG)....
READ MORE
MEMBERS ONLY
Why Daily vs. Weekly RRGs Matter in Portfolio Construction
by Julius de Kempenaer,
Senior Technical Analyst, StockCharts.com
Relative Rotation Graphs can be rendered in similar intervals as regular bar- or candlestick charts. This article explains the differences between weekly and daily RRGs....
READ MORE
MEMBERS ONLY
RRG Reveals the Next Big Sector Moves!
by Julius de Kempenaer,
Senior Technical Analyst, StockCharts.com
In this video, Julius breaks down current market trends using Relative Rotation Graphs (RRG). He examines weekly and daily asset class rotations, highlighting key developments in stocks, commodities, bonds, the U.S. dollar, and crypto. From there, Julius analyzes sector momentum shifts, including technology, energy, and real estate, and explains...
READ MORE
MEMBERS ONLY
The Best Five Sectors, #29
by Julius de Kempenaer,
Senior Technical Analyst, StockCharts.com
Weekly update on US sector rotation using Relative Rotation Graphs...
READ MORE
MEMBERS ONLY
Using Relative Rotation Graphs to Visualize Sector Rotation
by Julius de Kempenaer,
Senior Technical Analyst, StockCharts.com
Relative Rotation Graphs or RRGs will help investors to keep an eye on relative trends that unfold within a universe. Among other things this will help to visualize sector rotation...
READ MORE
MEMBERS ONLY
The Best Five Sectors, #28
by Julius de Kempenaer,
Senior Technical Analyst, StockCharts.com
The Technology sector continues to dominate, while Industrials are rotating out of the leading quadrant....
READ MORE
MEMBERS ONLY
The Best Five Sectors, #27
by Julius de Kempenaer,
Senior Technical Analyst, StockCharts.com
KEY TAKEAWAYS
* Materials sector climbs to #5 in rankings, displacing Utilities
* Technology maintains leadership, but Communication Services and Financials show weakness
* Daily RRG reveals potential for Materials, caution needed for Comm Services and Financials
* Portfolio drawdown continues, currently 8% behind S&P 500 YTD
After a relatively quiet week...
READ MORE
MEMBERS ONLY
Small Caps Are Rotating In — Here's Why It Matters
by Julius de Kempenaer,
Senior Technical Analyst, StockCharts.com
After months of whiplash sector swings, the market may finally be showing signs of settling down.
In this video, Julius de Kempenaer uses Relative Rotation Graphs (RRG) to analyze asset class rotation at a high level and then dives into sectors and factors. Julius highlights the rotation into cryptocurrencies and...
READ MORE
MEMBERS ONLY
The Best Five Sectors, #26
by Julius de Kempenaer,
Senior Technical Analyst, StockCharts.com
The past week has been relatively stable in terms of sector rankings, with no new entrants or exits from the top five. However, we're seeing some interesting shifts within the rankings that warrant closer examination. Let's dive into the details and see what the Relative Rotation...
READ MORE
MEMBERS ONLY
The Best Five Sectors, #25
by Julius de Kempenaer,
Senior Technical Analyst, StockCharts.com
A Greek Odyssey
First of all, I apologize for any potential delays or inconsistencies this week. I'm currently writing this from a hotel room in Greece, surrounded by what I can only describe as the usual Greek chaos. Our flight back home was first delayed, then canceled, then...
READ MORE
MEMBERS ONLY
The Best Five Sectors, #24
by Julius de Kempenaer,
Senior Technical Analyst, StockCharts.com
Some Sector Reshuffling, But No New Entries/Exits
Despite a backdrop of significant geopolitical events over the weekend, the market's reaction appears muted -- at least, in European trading. As we assess the RRG best five sectors model based on last Friday's close, we're...
READ MORE
MEMBERS ONLY
RRG Alert Tech Vaults to ‘Leading'—Is XLK Signaling a New Rally?
by Julius de Kempenaer,
Senior Technical Analyst, StockCharts.com
This week, Julius breaks down the current sector rotation using his signature Relative Rotation Graphs, with XLK vaulting into the leading quadrant while utilities and staples fade. He spotlights strength in the technology sector, led by semiconductors and electronic groups that are outpacing the S&P 500. Microchip heavyweights...
READ MORE
MEMBERS ONLY
The Best Five Sectors, #23
by Julius de Kempenaer,
Senior Technical Analyst, StockCharts.com
This Time Technology Beats Financials
After a week of no changes, we're back with renewed sector movements, and it's another round of leapfrogging.
This week, technology has muscled its way back into the top five sectors at the expense of financials, highlighting the ongoing volatility in...
READ MORE
MEMBERS ONLY
RRG Update: Is Tech Ready to Break Out?
by Julius de Kempenaer,
Senior Technical Analyst, StockCharts.com
This week, Julius shows how the Technology sector is edging toward leadership, alongside Industrials and soon-to-follow Communication Services. He highlights breakout lines for SPY, XLK, and XLC, noting that conviction climbs when daily and weekly RRG tails align to point northeast together. Bitcoin is sprinting into the leading quadrant next...
READ MORE
MEMBERS ONLY
The Best Five Sectors, #22
by Julius de Kempenaer,
Senior Technical Analyst, StockCharts.com
Sector Rotation: A Week of Stability Amidst Market Dynamics
Last week presented an intriguing scenario in our sector rotation portfolio.
For the first time in recent memory, we witnessed complete stability across all sector positions -- no changes whatsoever in the rankings.
1. (1) Industrials - (XLI)
2. (2) Utilities...
READ MORE
MEMBERS ONLY
The Best Five Sectors, #21
by Julius de Kempenaer,
Senior Technical Analyst, StockCharts.com
Staples and Tech Swap Positions Again
The weekly sector rotation continues to paint a picture of a market in flux, with defensive sectors gaining ground while cyclicals take a step back. This week's shifts underscore the ongoing volatility and lack of clear directional trade that's been...
READ MORE
MEMBERS ONLY
Mixed Signals on the Charts? RRG Reveals Market Rotation Tension
by Julius de Kempenaer,
Senior Technical Analyst, StockCharts.com
Confused by mixed market signals? Follow along as Julius analyzes sector rotation, asset rotation, and global market trends using daily and weekly Relative Rotation Graphs (RRGs).
In this video, Julius puts the current sector rotation in perspective on both weekly and daily Relative Rotation Graphs (RRGs). He also examines asset...
READ MORE
MEMBERS ONLY
The Best Five Sectors, #20
by Julius de Kempenaer,
Senior Technical Analyst, StockCharts.com
Technology Back in Top-5
Last week's market decline of 2-2.5% (depending on the index) has led to some notable shifts in sector performance and rankings.
This pullback, coming after a strong rally, is changing the order of highs and lows on the weekly chart -- a particularly...
READ MORE
MEMBERS ONLY
The Best Five Sectors, #19
by Julius de Kempenaer,
Senior Technical Analyst, StockCharts.com
KEY TAKEAWAYS
* Industrials surge to #1 in sector ranking, replacing Real Estate in top 5
* Communication Services showing vulnerability, moving into weakening quadrant
* Utilities and Consumer Staples losing momentum but maintaining leading positions
* Portfolio maintains defensive positioning despite underperformance vs SPY
Sector Rotation Shakeup: Industrials Take the Lead
Another week...
READ MORE
MEMBERS ONLY
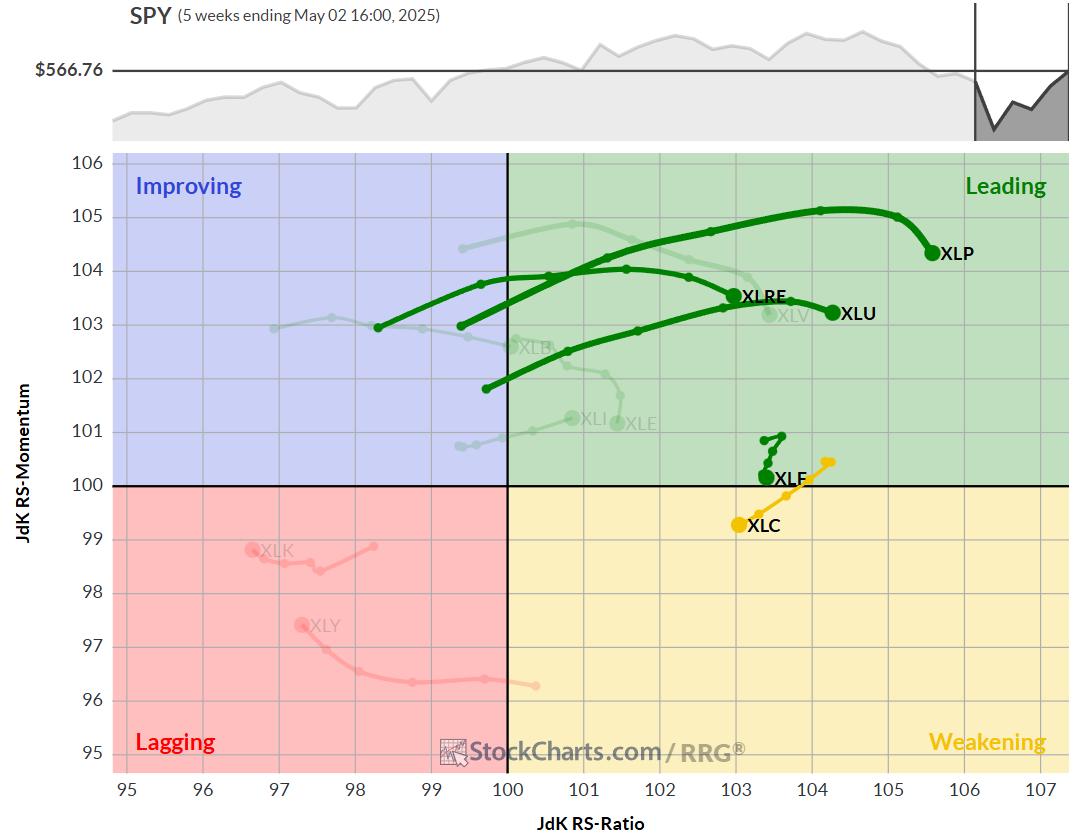
What Sector Rotation Says About the Market Cycle Right Now
by Julius de Kempenaer,
Senior Technical Analyst, StockCharts.com
Where are we in the market cycle? In this video, Julius reviews the sector rotation and asset class performance from the past 2-3 weeks to provide an objective take on where we stand in the current market cycle. Using his signature Relative Rotation Graphs (RRG), he uncovers shifts in momentum...
READ MORE
MEMBERS ONLY
The Best Five Sectors, #18
by Julius de Kempenaer,
Senior Technical Analyst, StockCharts.com
KEY TAKEAWAYS
* All 11 sectors changed positions, but the top-5 / bottom-6 composition remained the same.
* Utilities now strongest sector, despite overall market strength.
* Communication Services jumped from 5th to 2nd place.
* Portfolio still 3% behind the S&P 500 YTD, unchanged from last week.
Sector Shuffle: Same Players, New...
READ MORE
MEMBERS ONLY
Recession Ahead? Sector Rotation Model Warns of Rising Risk
by Julius de Kempenaer,
Senior Technical Analyst, StockCharts.com
Is a recession coming? In this video, Julius breaks down the latest updates to his powerful Sector Rotation Model, analyzing four key macroeconomic indicators and their impact on sector performance.
This video was originally published on May 9, 2025. Click on the icon above to view on our dedicated page...
READ MORE
MEMBERS ONLY
The Best Five Sectors, #18
by Julius de Kempenaer,
Senior Technical Analyst, StockCharts.com
KEY TAKEAWAYS
* Top 5 sectors remain unchanged, with minor position shifts
* Leading sectors showing signs of losing momentum
* Daily RRG reveals top sectors in weakening quadrant
* Communication services at risk of dropping out of top 5
Communication Services Drops to #5
The composition of the top five sectors remains largely...
READ MORE
MEMBERS ONLY
Sector Rotation + SPY Seasonality = Trouble for Bulls?
by Julius de Kempenaer,
Senior Technical Analyst, StockCharts.com
In this video, Julius analyzes current asset class rotation, revealing why stocks in the lagging quadrant may signal continued market weakness. By combining sector rotation trends—particularly strength in defensive sectors—with SPY seasonality, Julius builds a compelling case that downside risk in the S&P 500 may outweigh...
READ MORE
MEMBERS ONLY
The Best Five Sectors, #17
by Julius de Kempenaer,
Senior Technical Analyst, StockCharts.com
KEY TAKEAWAYS
* Defensive sectors maintain dominance in top 5, despite strong market performance.
* Real Estate enters top 5, replacing Health Care; Consumer Staples, Utilities, and Financials remain stable in top 3 positions.
* Defensive positioning has put a dent in portfolio performance after strong week.
Real Estate and Healthcare Swapping Positions...
READ MORE
MEMBERS ONLY
The Best Five Sectors, #16
by Julius de Kempenaer,
Senior Technical Analyst, StockCharts.com
KEY TAKEAWAYS
* Consumer staples and utilities continue to lead sector rankings.
* Defensive sectors are showing strength in both weekly and daily RRGs.
* Health care struggling, but maintains position in top 5
* RRG portfolio slightly underperforming S&P 500 YTD, but gap narrowing.
Top 5 Remains Unchanged
The latest sector...
READ MORE
MEMBERS ONLY
Sector Rotation Update: Value Stocks and Bonds Lead the Way!
by Julius de Kempenaer,
Senior Technical Analyst, StockCharts.com
Stocks vs. bonds? In this video, Julius breaks down the asset allocation outlook and why defensive sectors, large-cap value, and bonds may continue to outperform in this volatile market. He starts at the asset allocation level using Relative Rotation Graphs (RRGs) to analyze stocks vs bonds performance, then highlights the...
READ MORE
MEMBERS ONLY
The Best Five Sectors, #15
by Julius de Kempenaer,
Senior Technical Analyst, StockCharts.com
KEY TAKEAWAYS
* The entire top 5 has now changed positions.
* All defensive sectors are now in the top 5, while Healthcare has reentered.
* Portfolio is now lagging S&P 500.
Healthcare Re-Enters the Top 5
After a wild week in the markets, the sector ranking got quite a shake-up....
READ MORE
MEMBERS ONLY
Stock Market Volatility: Pain Points, Bright Spots, and Strategies
by Grayson Roze,
Chief Strategist, StockCharts.com
by Julius de Kempenaer,
Senior Technical Analyst, StockCharts.com
Is the stock market volatility making you nervous?
In this video, Grayson Roze and Julius de Kempenaer unpack the volatile market environment and discuss pain points, some of the "bright spots" they are seeing in the market, and the StockCharts tools they are using to identify shifts in...
READ MORE
MEMBERS ONLY
The Best Five Sectors, #14
by Julius de Kempenaer,
Senior Technical Analyst, StockCharts.com
KEY TAKEAWAYS
* Consumer Staples replaces Healthcare in top 5
* More defensive rotation underway
* RRG portfolio remains in line with market performance
This article was first posted on 4/4/2025 and contained only rankings and charts. Then updated with comments 4/7/2025
I am attending and speaking at the...
READ MORE
MEMBERS ONLY
The Best Five Sectors, #13
by Julius de Kempenaer,
Senior Technical Analyst, StockCharts.com
KEY TAKEAWAYS
* Financials jump to #1 spot in S&P 500 sector rankings.
* Three sectors now in leading quadrant on weekly RRG
* Only Tech and Consumer Discretionary showing negative RRG headings
* RRG portfolio outperforming S&P 500 YTD by 10 basis points
Financials take the lead.
No changes...
READ MORE
MEMBERS ONLY
S&P & Tech Stocks: Will Seasonality Lead to More Pain?
by Julius de Kempenaer,
Senior Technical Analyst, StockCharts.com
Sector rotation is shaping the S&P 500's next big move! In this exclusive StockCharts video,Julius analyzes SPY support levels, key sector trends, and the latest seasonal patterns—which indicate further downside for Technology stocks. He breaks down two critical support areas that could signal the...
READ MORE
MEMBERS ONLY
The Best Five Sectors, #12
by Julius de Kempenaer,
Senior Technical Analyst, StockCharts.com
KEY TAKEAWAYS
* Energy sector jumps to position #2 in top 5
* Consumer Staples drops out of portfolio
* Communication Services remains at #1 spot
* Modest pick up of relative momentum for XLK and XLY not enough yet
Energy Jumps to #2
A big move for the energy sector last week as...
READ MORE
MEMBERS ONLY
The Best Five Sectors, #11
by Julius de Kempenaer,
Senior Technical Analyst, StockCharts.com
KEY TAKEAWAYS
* At the moment, we're seeing a big shakeup in sector rankings.
* Healthcare has entered the top five.
* Technology is dropping to last position.
* All defensive sectors are now in the top five.
Big Moves in Sector Ranking
The ranking of US sectors continues to shift. At...
READ MORE