MEMBERS ONLY
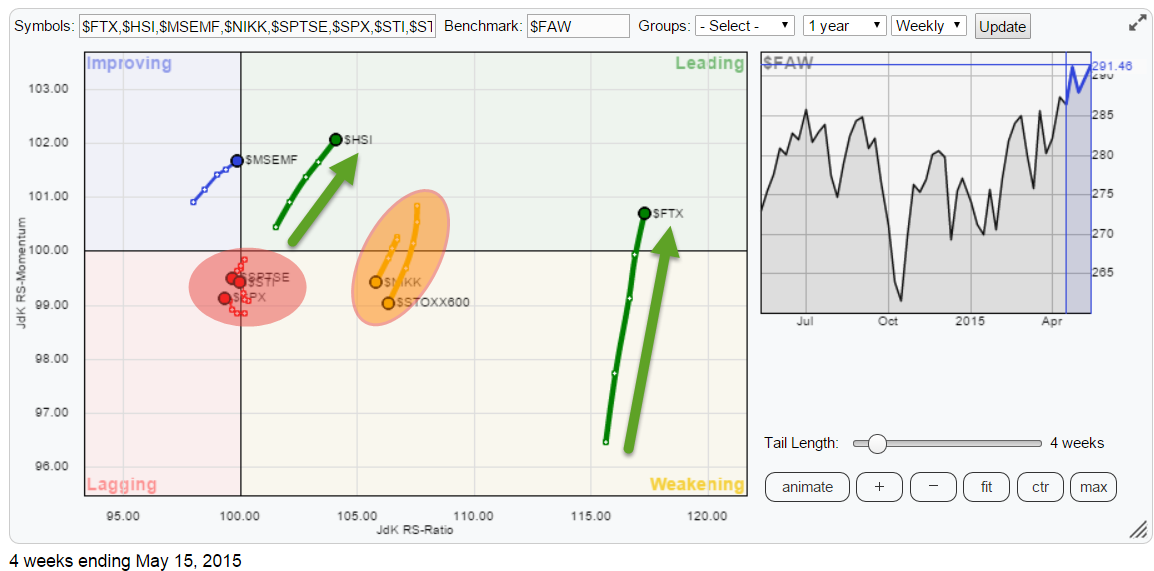
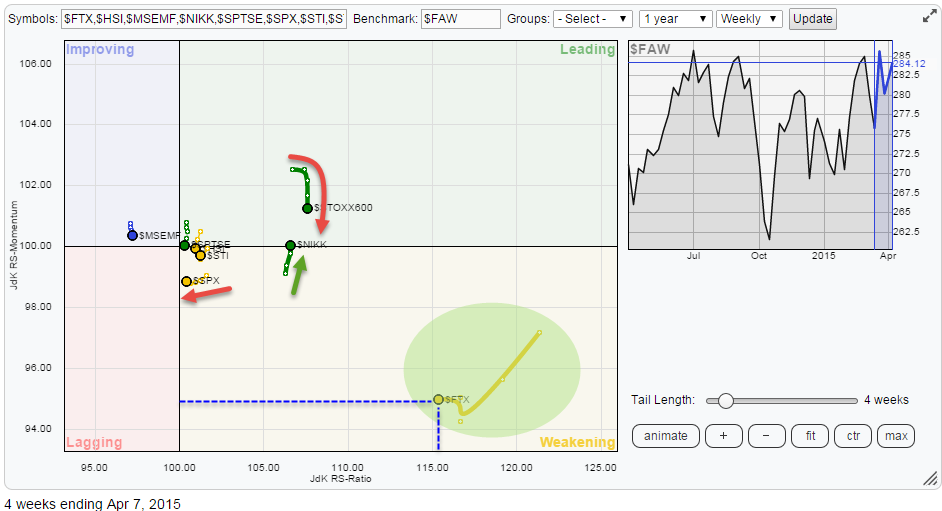
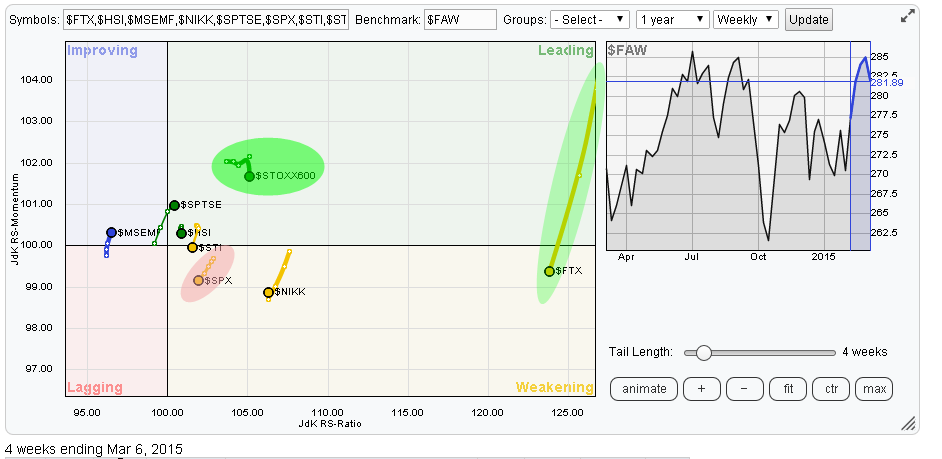
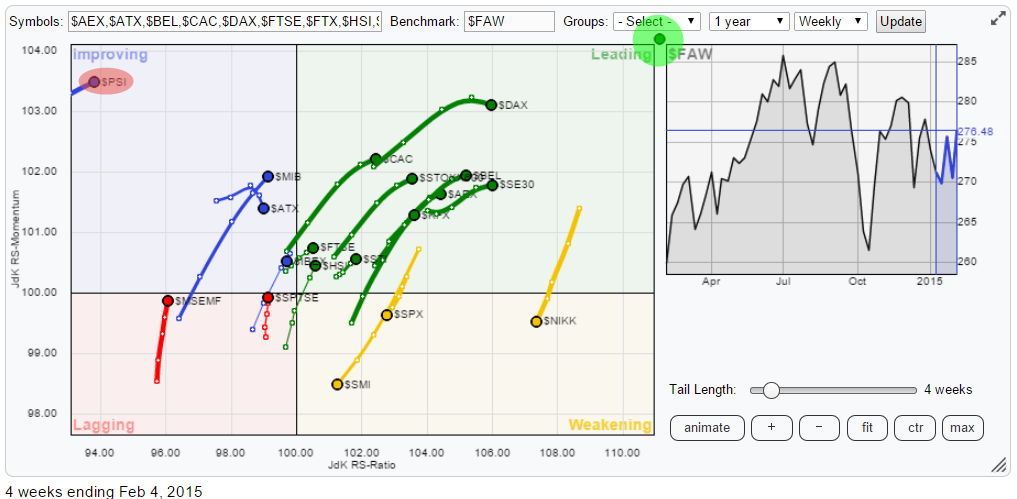
Hong Kong ($HSI) on track towards all-time-high
by Julius de Kempenaer,
Senior Technical Analyst, StockCharts.com
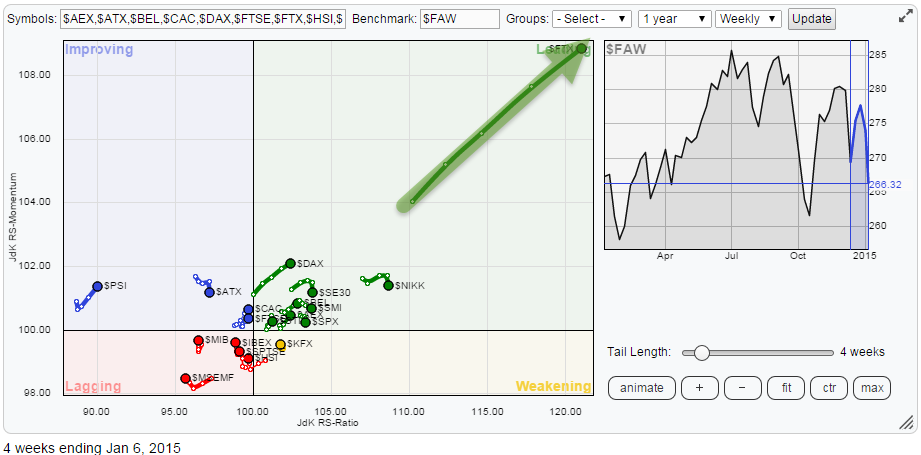
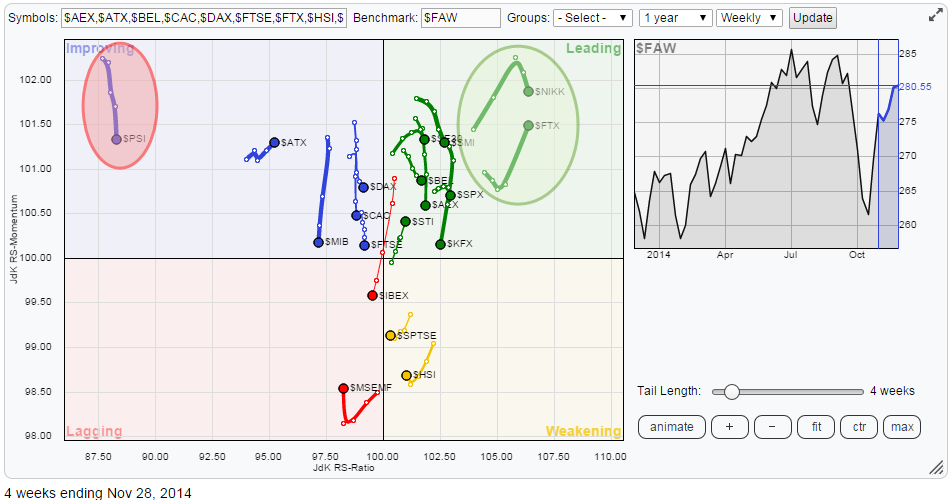
The Relative Rotation Graph below holds a number of world equity indices and shows their relative rotation versus the FTSE all world index ($FAW).
click the chart to open the live RRG
Initial observations
A couple of quick observations from the RRG before we move into more detail of the...
READ MORE
MEMBERS ONLY
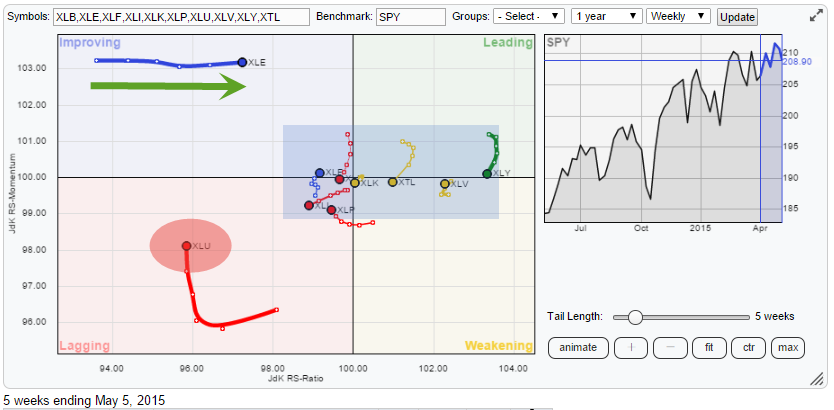
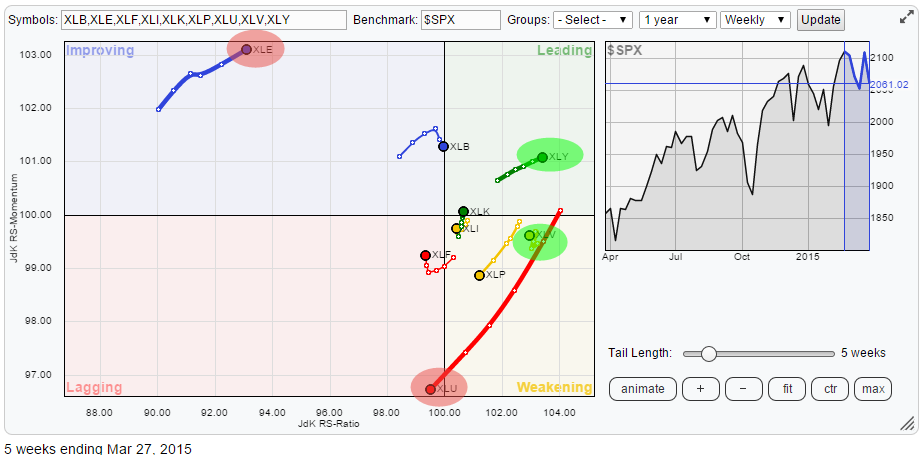
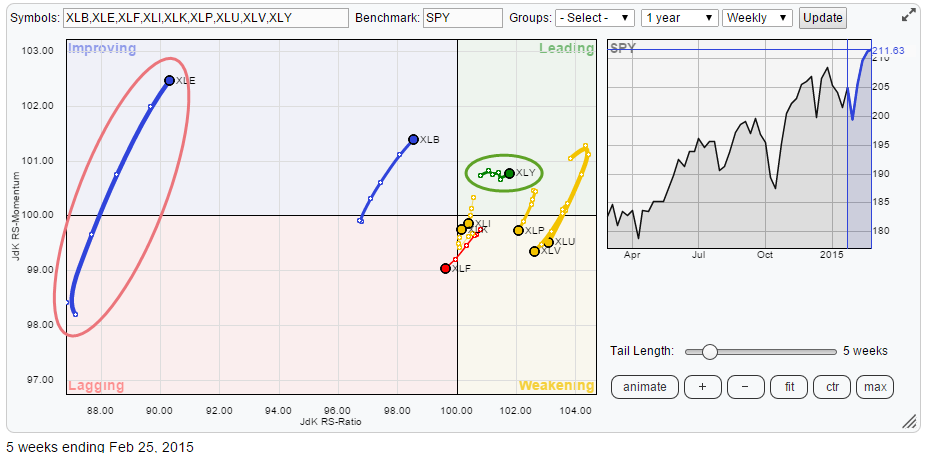
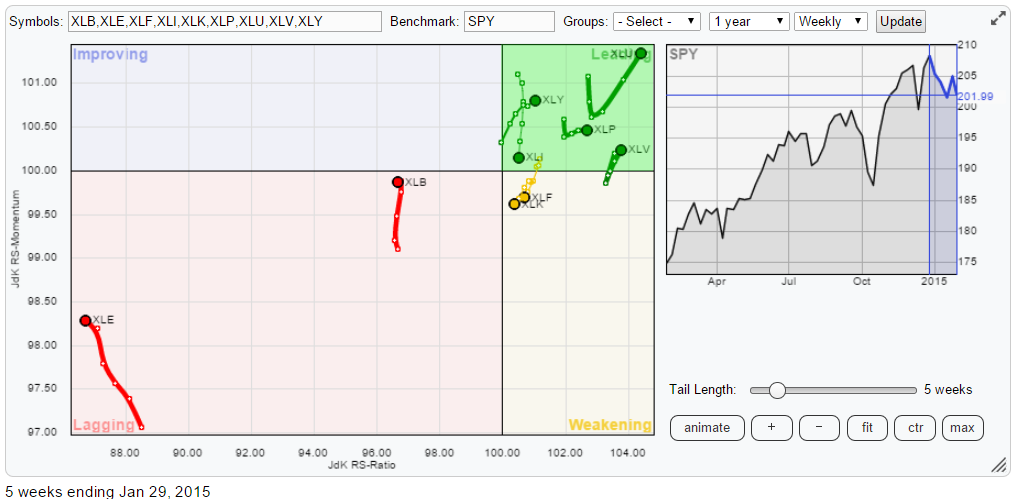
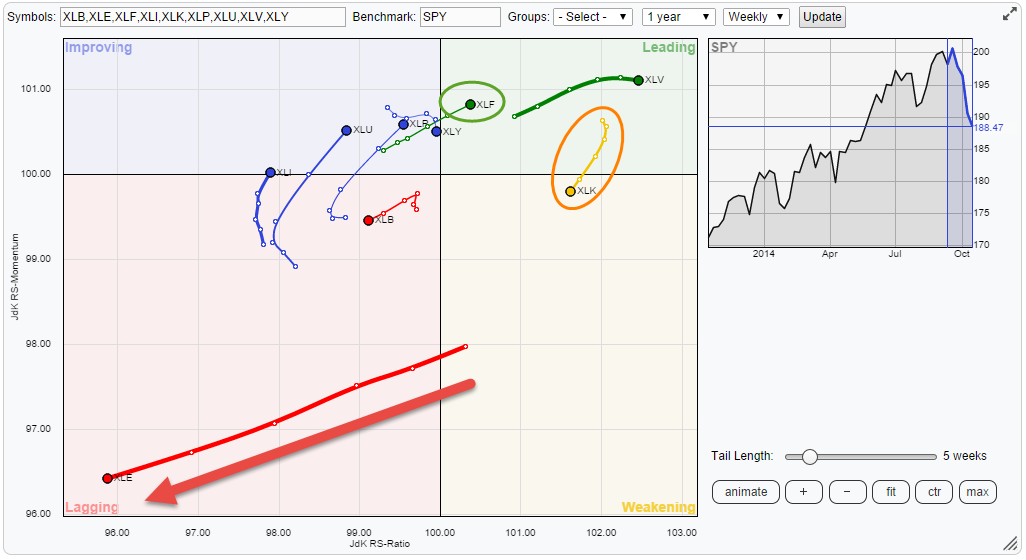
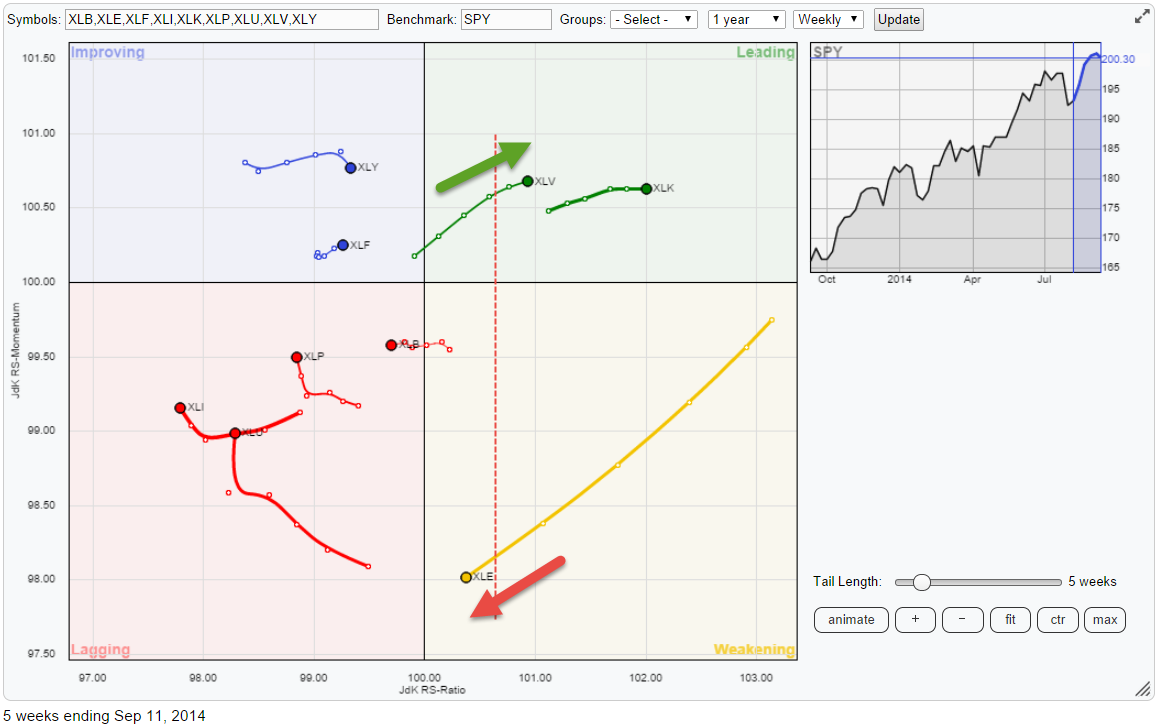
Weak industrials (XLI) vs. strong(er) energy (XLE)
by Julius de Kempenaer,
Senior Technical Analyst, StockCharts.com
Sector time!
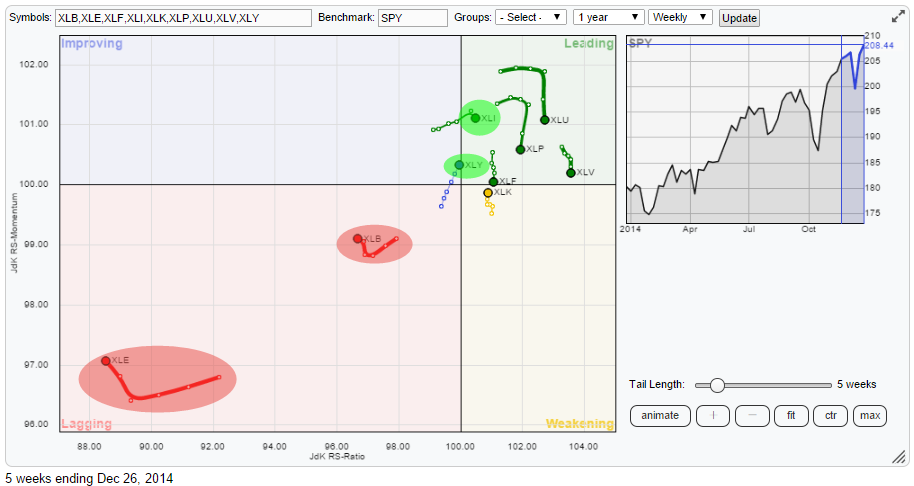
With the general market picture being a bit 'un-clear' and showing pretty wide swings from week to week, the Relative Rotation Graph holding the ten (I added XTL - Telecom) sector ETFs will shine some light on the sector rotation that is going on within the...
READ MORE
MEMBERS ONLY
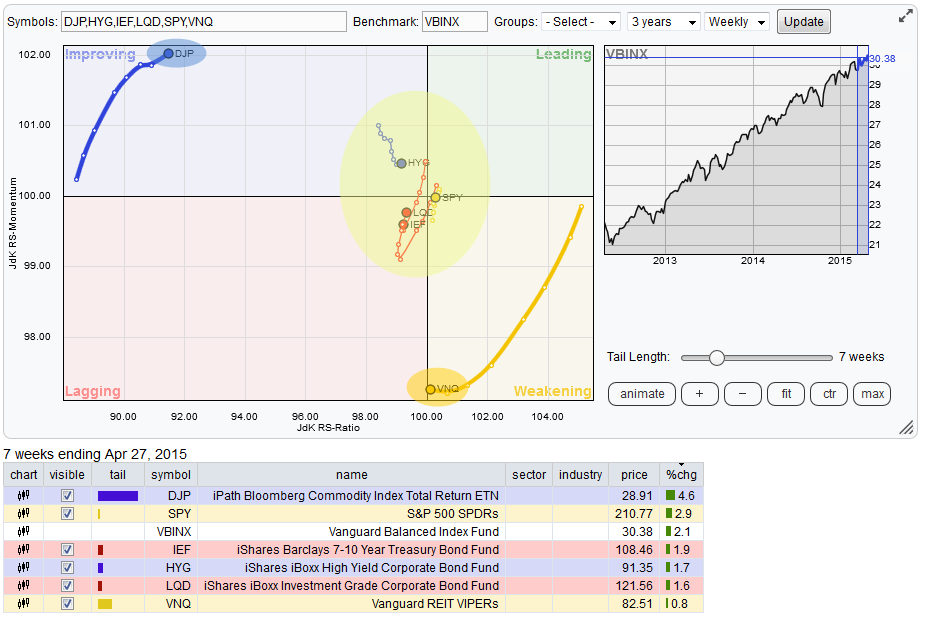
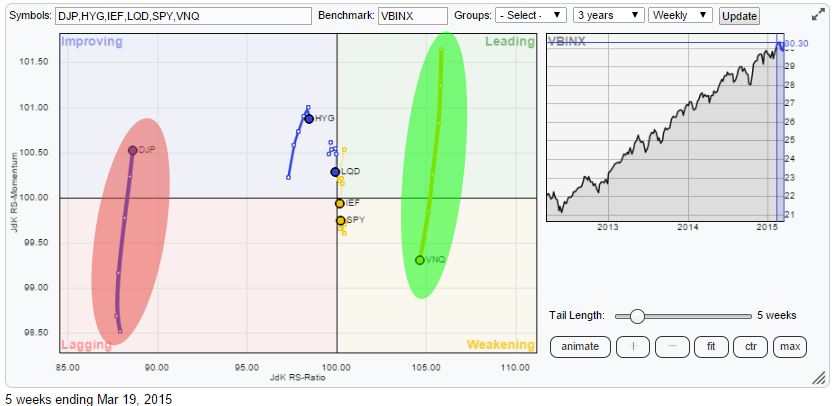
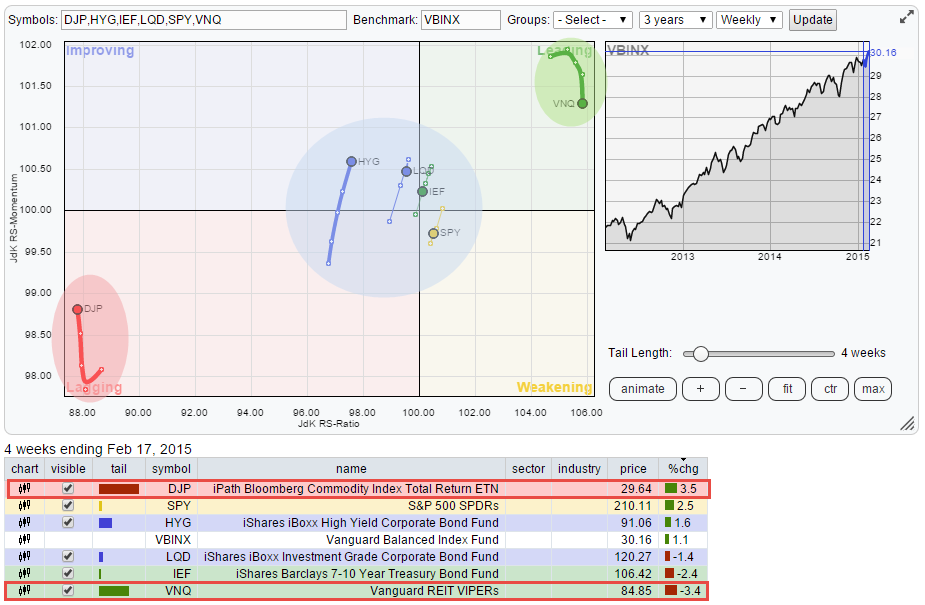
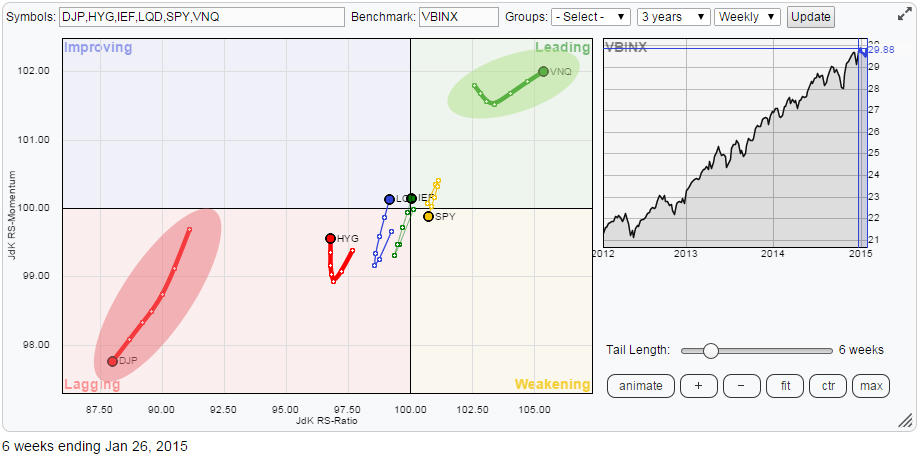
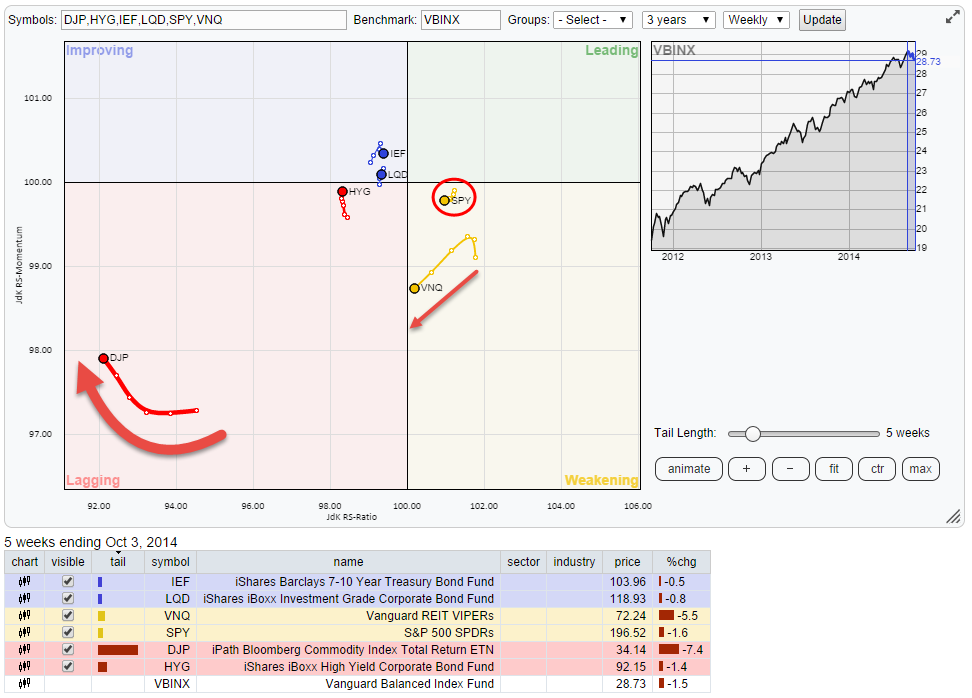
All asset classes starting to hug the benchmark
by Julius de Kempenaer,
Senior Technical Analyst, StockCharts.com
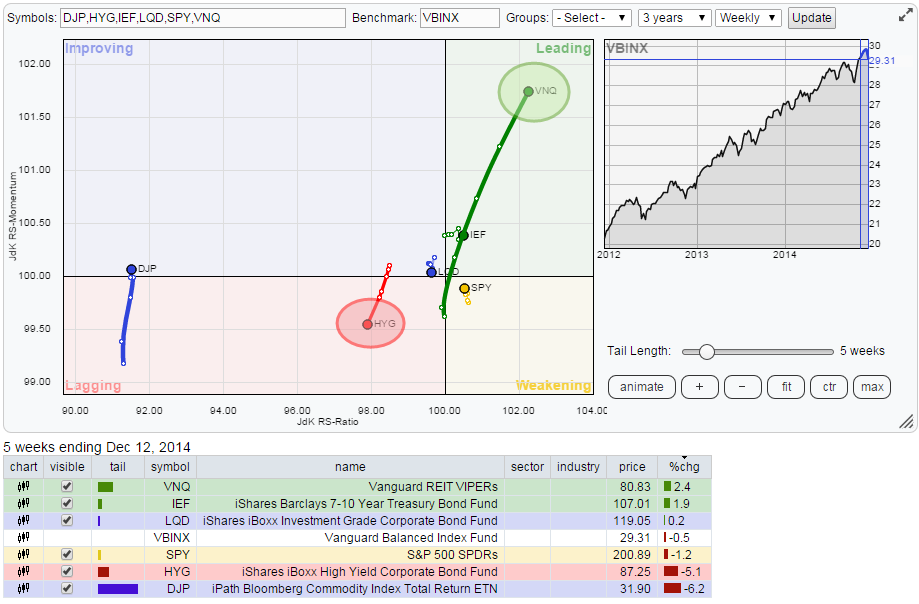
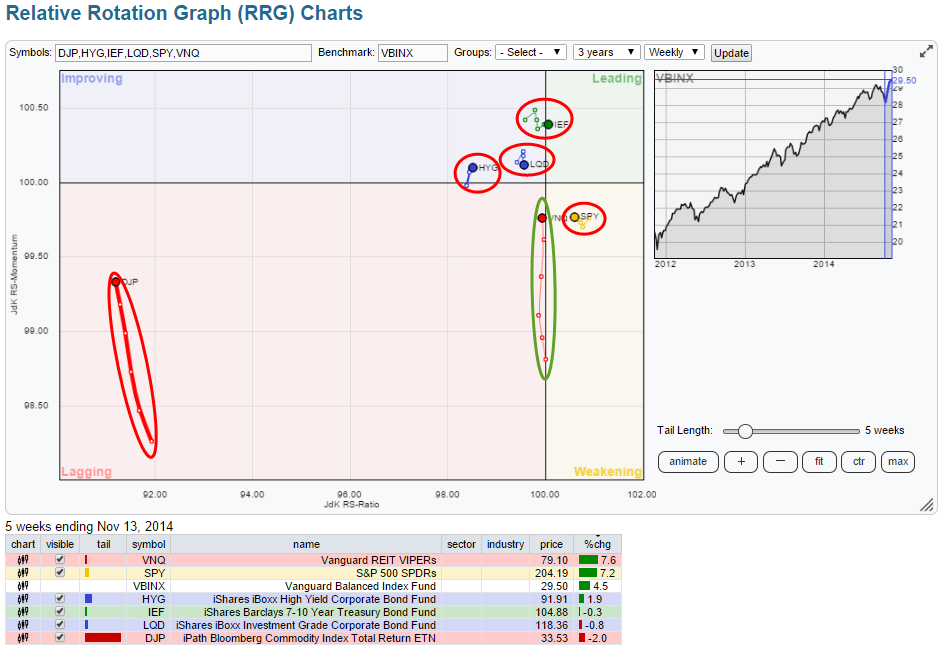
The Relative Rotation Graph below shows the rotation of various asset classes (ETFs) around a balanced portfolio as represented by VBINX (Vanguard Balanced Index Fund).
While reading this RRG the two asset classes that remain on the outskirts of the plot are commodities (DJP) and Real Estate (VNQ). All other...
READ MORE
MEMBERS ONLY
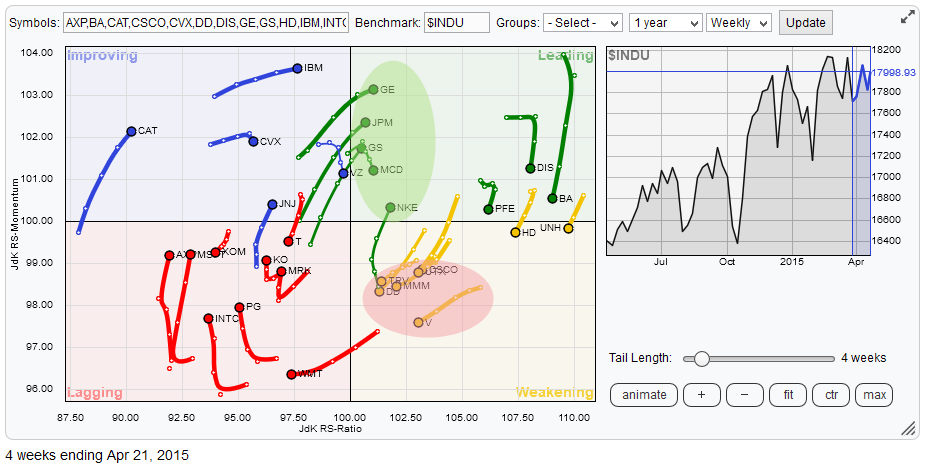
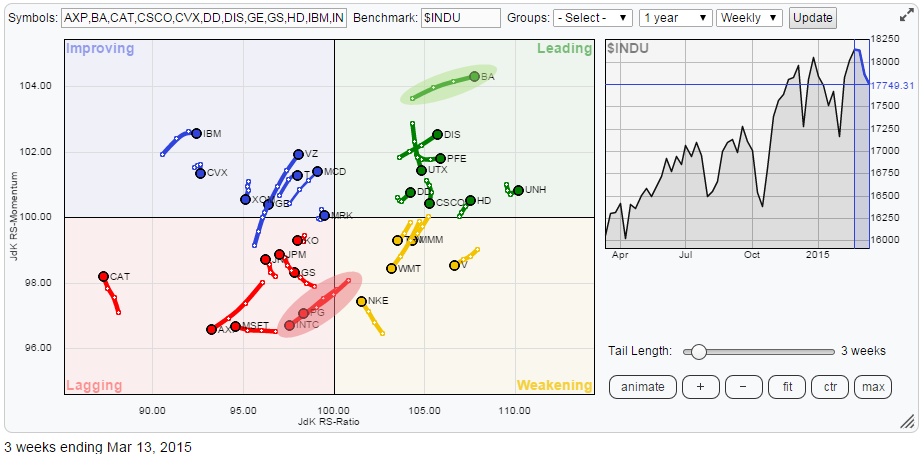
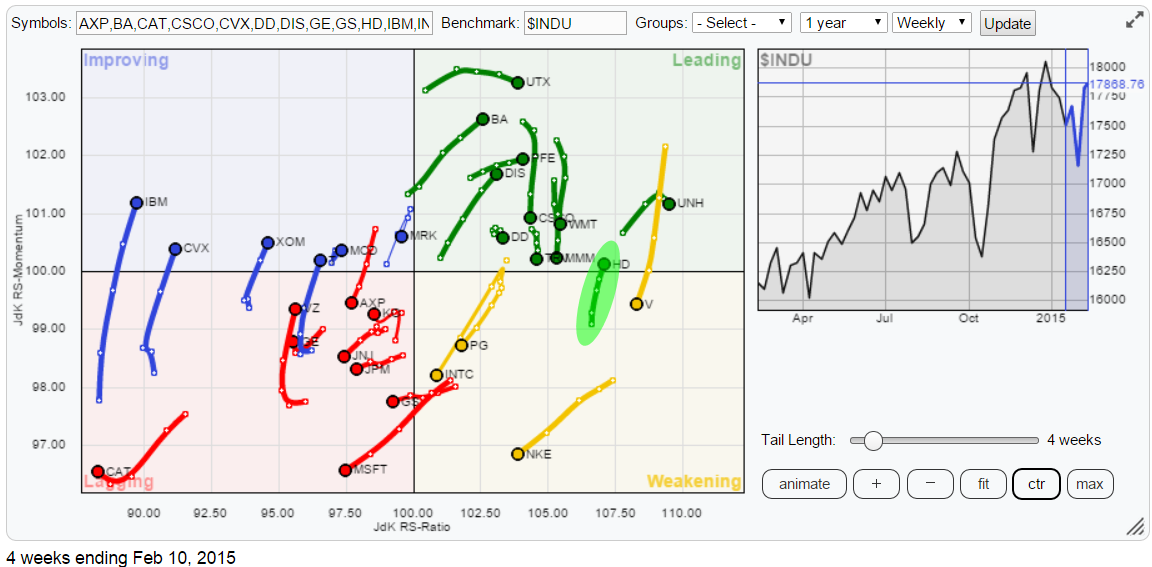
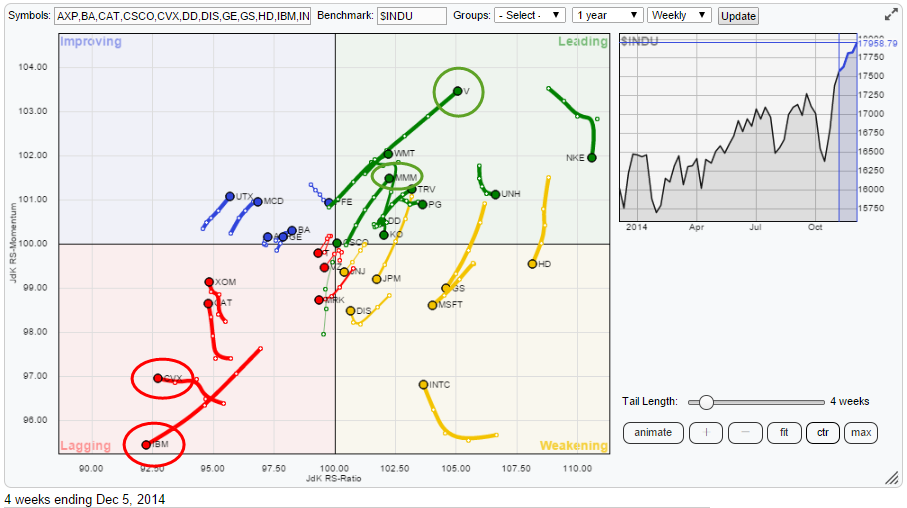
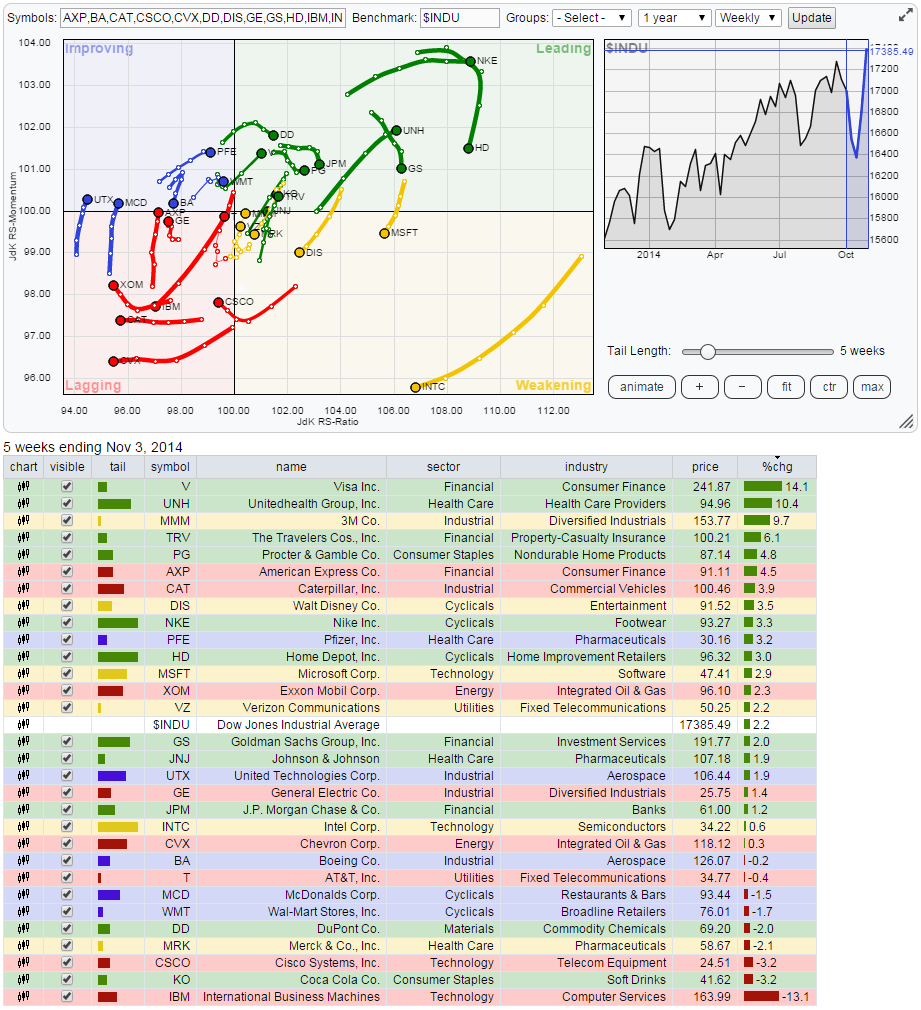
Strong relative rotation for GE, JPM and GS
by Julius de Kempenaer,
Senior Technical Analyst, StockCharts.com
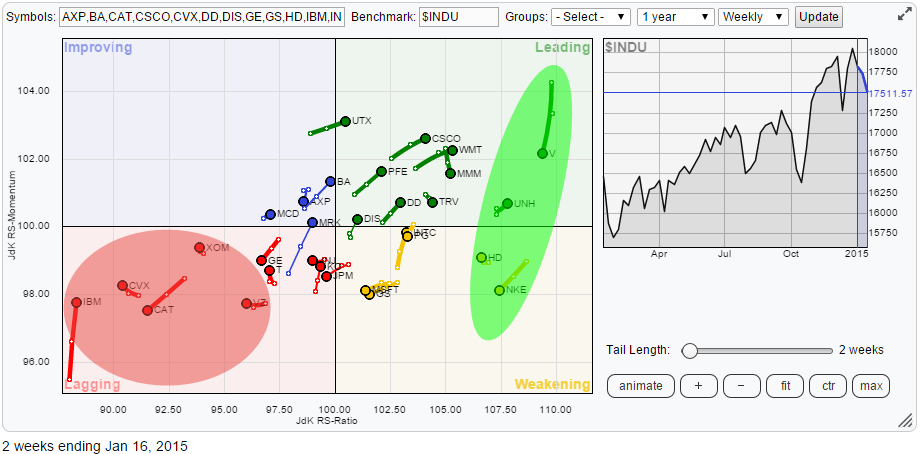
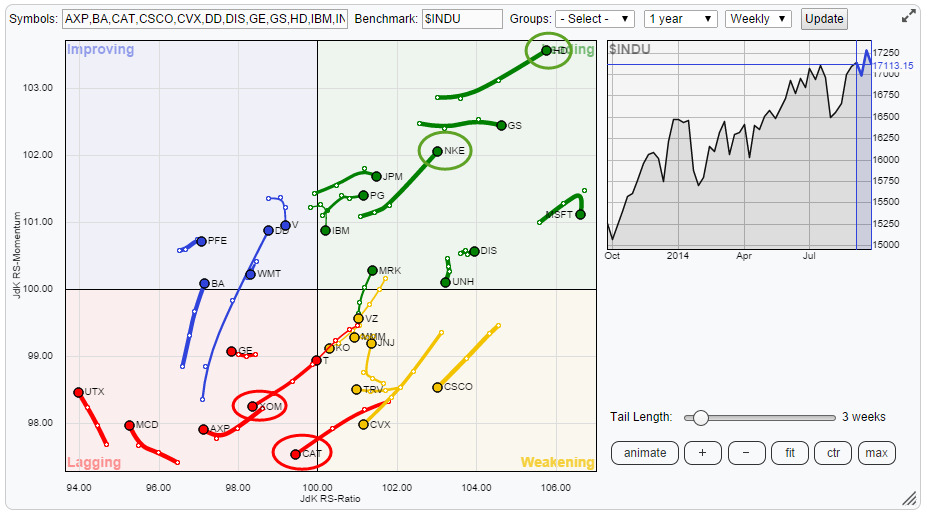
It is time for a look at the relative rotation of the Dow 30 industrial stocks again. The Relative Rotation Graph below shows the 30 stocks that make up this index.
When I look at that RRG there are two things that immediately catch my eye.
The first thing is...
READ MORE
MEMBERS ONLY
China flying off the (RRG) charts!
by Julius de Kempenaer,
Senior Technical Analyst, StockCharts.com
The first time I wrote about international equity markets on this blog was last year in October. Already back then China had entered the leading quadrant on the Relative Rotation Graph holding a number of international equity indices. And if we look today we will see that China is still...
READ MORE
MEMBERS ONLY
XLV remains a very "healthy" sector
by Julius de Kempenaer,
Senior Technical Analyst, StockCharts.com
In the previous article on US sectors I mentioned Energy (XLE) and Consumer Discretionary (XLY) as sectors to watch for sector-rotation. XLE as being suspect and at risk for more or renewed under-performance and XLY as pushing further into the leading quadrant and thus expanding its out-performance. Looking at the...
READ MORE
MEMBERS ONLY
Commodities still in trouble
by Julius de Kempenaer,
Senior Technical Analyst, StockCharts.com
The Relative Rotation Graph holding a number of ETFs tracking various asset classes continues to be dominated, or distorted if you wish, by the two asset classes that are moving far away from the center for quite some time already.
Regular readers of this blog will recognize VNQ (Vanguard REIT...
READ MORE
MEMBERS ONLY
Touch and go for Boeing
by Julius de Kempenaer,
Senior Technical Analyst, StockCharts.com
Last Tuesday I joined Arthur Hill's market message webinar which was great fun. Not only because the (stock selection) approach we are taking makes total sense, at least that is what I tend to believe. But also because it gives Art and myself a good excuse to meet...
READ MORE
MEMBERS ONLY
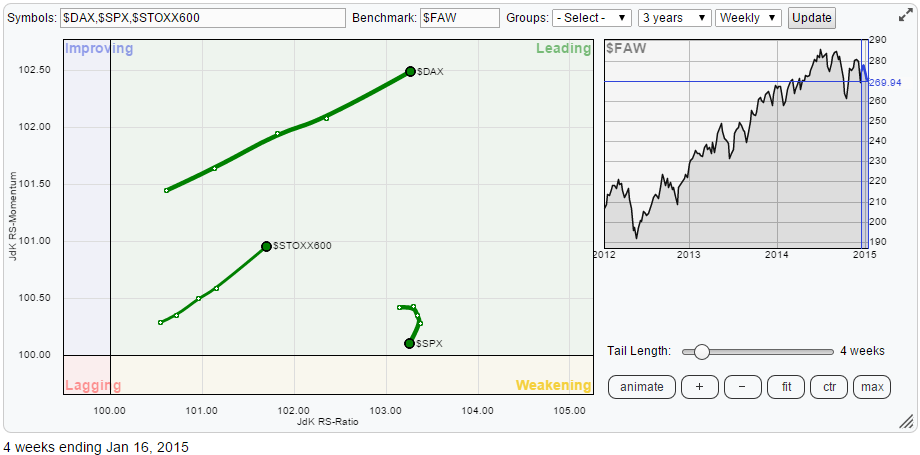
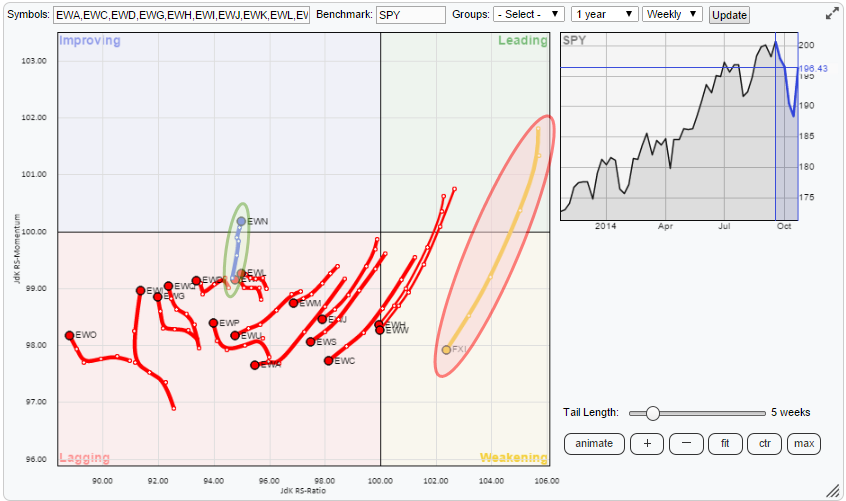
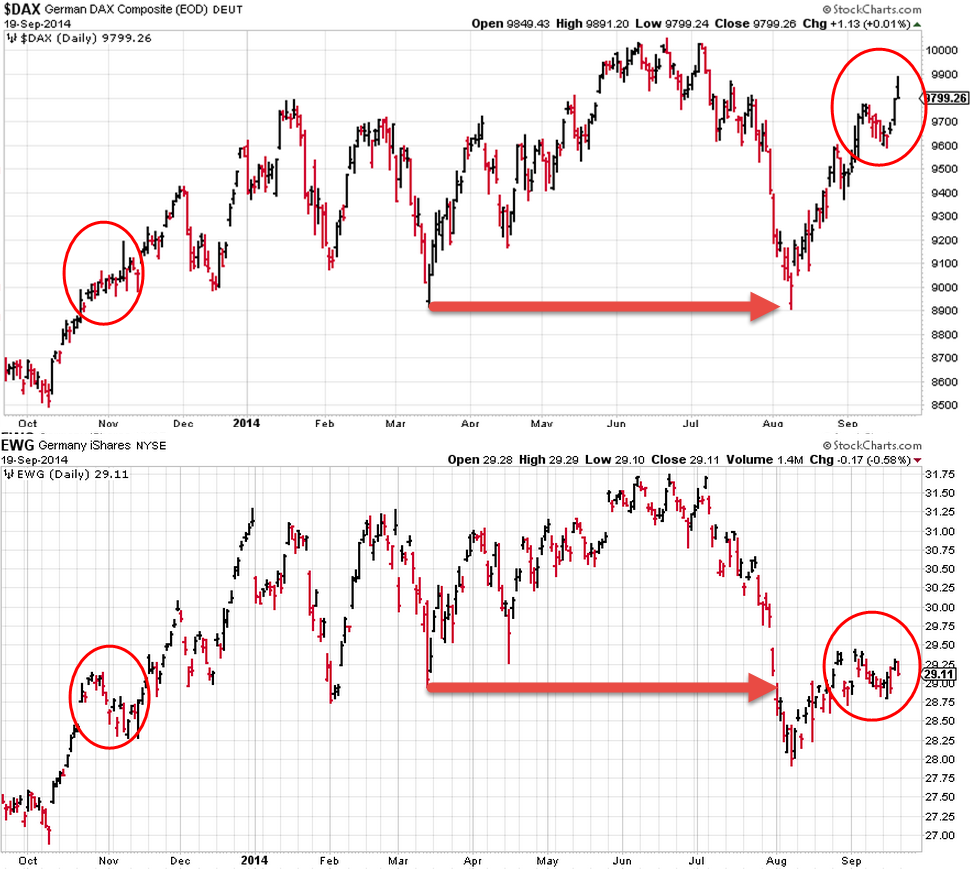
It's lonely for Europe in the leading quadrant...
by Julius de Kempenaer,
Senior Technical Analyst, StockCharts.com
In previous blogs on international (equity) markets I used to plot all markets on one RRG canvas which makes a pretty crowded picture. As most individual ticker symbols are from European markets which are much more fragmented than other global regions I have grouped them together by using one ticker...
READ MORE
MEMBERS ONLY
High ENERGY move is suspect
by Julius de Kempenaer,
Senior Technical Analyst, StockCharts.com
On the Relative Rotation Graph showing the sector rotation in the nine S&P sector ETFs there is one that really stands out. But is it good or is it bad?
XLE, the Energy select sector SPDR is showing up in the top-left 'improving' quadrant with a...
READ MORE
MEMBERS ONLY
Asset Class rotation remains close to home
by Julius de Kempenaer,
Senior Technical Analyst, StockCharts.com
The rotation of relative trends close to "home" over the past 3-4 weeks. HOME in this context is VBINX (Vanguard Balanced Index Fund) which represents a balanced investment portfolio holding approximately 60% in Equities and 40% in bonds.
The Relative Rotation Graph below shows the relative trends for...
READ MORE
MEMBERS ONLY
Home run for HD?
by Julius de Kempenaer,
Senior Technical Analyst, StockCharts.com
The Relative Rotation Graph of the 30 Dow stocks shows nicely balanced rotations. All 30 names are more or less evenly spread around on the RRG chart. This is often seen on Relative Rotation Graphs holding a closed universe of securities without one or two mega-caps distorting the picture.
I...
READ MORE
MEMBERS ONLY
Europe is taking over
by Julius de Kempenaer,
Senior Technical Analyst, StockCharts.com
The Relative Rotation Graph below holds a number of international, country and regional, stock indices. In order to get a bit more clarity I have zoomed in to the central area that holds the most observations. You will see one observation "off the grid" in the top right-hand...
READ MORE
MEMBERS ONLY
Utilities leading the (relative) way
by Julius de Kempenaer,
Senior Technical Analyst, StockCharts.com
The Relative Rotation Graph below holds the nine S&P sector ETFs showing the weekly relative trends against the S&P 500 (SPY) and against each other.
As you can see it is pretty crowded in the top-right, leading quadrant and a lot less so in the opposite...
READ MORE
MEMBERS ONLY
Long Real Estate and Short Commodities .... End of Story
by Julius de Kempenaer,
Senior Technical Analyst, StockCharts.com
The relative rotation of various asset classes continues to tell the same story as it has been doing for quite a while now.
I could make this a very short article by just saying that the short version of this party line remains to be long or overweight real estate...
READ MORE
MEMBERS ONLY
Are US stocks losing their edge?
by Julius de Kempenaer,
Senior Technical Analyst, StockCharts.com
In my first article of this year I talked about more developed markets improving versus Emerging Markets. In the past few weeks however I have been monitoring rotation in international equity markets with interest as I think we are at cross-roads with regard to some relationships in this universe.
Obviously...
READ MORE
MEMBERS ONLY
No Mickey Mouse rally for DIS
by Julius de Kempenaer,
Senior Technical Analyst, StockCharts.com
Below is the Relative Rotation Graph holding the 30 stocks that make up the Dow Jones Industrials index.
When I start analysing a universe like this I always start to look at what's going on on the outskirts of the RRG. In this case they are the names...
READ MORE
MEMBERS ONLY
Swap Emerging Markets for something more developed
by Julius de Kempenaer,
Senior Technical Analyst, StockCharts.com
It's time to check the world again.
The Relative Rotation Graph below shows the relative positions and movement of international equity markets against the FTSE All World index. Please note that I am using $ ticker symbols for the actual indices and not the ETFs to avoid the currency...
READ MORE
MEMBERS ONLY
Avoid Materials and Energy
by Julius de Kempenaer,
Senior Technical Analyst, StockCharts.com
It's sector rotation time again!
For those of you who haven't noticed it by now. I am (trying to) maintain some sort of subject-rotation in my blogs as well.... The subjects being; Asset Class rotation, (US) Sector rotation, International equity markets rotation, and (DOW 30) Individual...
READ MORE
MEMBERS ONLY
Relatively Rock Solid Real-Estate
by Julius de Kempenaer,
Senior Technical Analyst, StockCharts.com
The Relative Rotation Graph below holds a number of ETFs that represent various asset classes while using VBINX (Vanguard Balanced Index Fund) as the benchmark.
For sure that long fat green tail on VNQ catches my attention...
In my last blog on asset class rotation I mentioned in the conclusions...
READ MORE
MEMBERS ONLY
CVX lacking (relative) fuel
by Julius de Kempenaer,
Senior Technical Analyst, StockCharts.com
Below is the weekly Relative Rotation Graph holding the constituents of the Dow Jones Industrials index. My starting point to have a look at the relative positioning and movements of its components.
Many observations can be made off of this chart but I have circled a few that I want...
READ MORE
MEMBERS ONLY
China (and Japan) Paying off
by Julius de Kempenaer,
Senior Technical Analyst, StockCharts.com
The Relative Rotation Graph™ below shows the relative position and movement of international equity markets against the FTSE All World index.
At one glance we can immediately see which markets deserve our attention. THAT is the big advantage of RRG™ Charts.
In this case it is $PSI, the Portuguese equity...
READ MORE
MEMBERS ONLY
Strong Rotation for Utilities and Staples
by Julius de Kempenaer,
Senior Technical Analyst, StockCharts.com
The Relative Rotation Graph below shows the weekly rotation pattern for the nine S&P sector ETFs.
The single one sector that immediately catches attention is Energy (XLE) in the bottom left-hand corner (lagging). This is by far the weakest sector on the chart. Further to the energy sector...
READ MORE
MEMBERS ONLY
Still RISK ON for Asset Allocation ?
by Julius de Kempenaer,
Senior Technical Analyst, StockCharts.com
Wow...! What a difference a month makes .... I had lunch with Arthur Hill yesterday in Breda (the Netherlands) which is halfway where he lives in Belgium and where I live in the Netherlands (Amsterdam). Obviously the discussion was mainly about the freaky market move we have seen in October. At...
READ MORE
MEMBERS ONLY
Boeing on final approach for landing at "lagging" runway
by Julius de Kempenaer,
Senior Technical Analyst, StockCharts.com
The Relative Rotation Graph below shows the members of the Dow Jones Industrials index with that same index acting as the benchmark. As all members of the benchmark universe are present on the plot we call this a "closed universe".
Open and Closed RRG-charts
On a RRG holding...
READ MORE
MEMBERS ONLY
US Equities remain firmly in the lead
by Julius de Kempenaer,
Senior Technical Analyst, StockCharts.com
The landscape for international equities continues to show a rotation out of Emerging Markets into more developed markets. At least that is the big picture. There are a few ways that we can use to approach this equity universe and I will use three different relative rotation graphs in this...
READ MORE
MEMBERS ONLY
Energy continues weakness but Financials rotating into leading quadrant
by Julius de Kempenaer,
Senior Technical Analyst, StockCharts.com
Printed below is the weekly Relative Rotation Graph(tm) of the nine S&P sector ETFs against SPY. The clear eye-catcher on this picture is the move of XLE (Energy) deep inside the lagging quadrant and still heading deeper into it. The second observation is that the strong relative...
READ MORE
MEMBERS ONLY
Commmmmmodities and Real(ly weak)-Estate
by Julius de Kempenaer,
Senior Technical Analyst, StockCharts.com
On the Relative Rotation Graph holding a number of, indices representing various, Asset Classes there are two that are standing out and deserve our attention. The first one is Commodities and the second one is Real-Estate. The graph below shows the weekly RRG chart for asset classes with a five...
READ MORE
MEMBERS ONLY
Single stock rotation within $INDU
by Julius de Kempenaer,
Senior Technical Analyst, StockCharts.com
In previous posts I have been looking at asset classes, sectors, countries etc. In this post I am going to throw the 30 constituents of the Dow Jones Industrials index ($INDU) at a Relative Rotation Graph and also look for confirmation between weekly and daily time-frames.
When you open up...
READ MORE
MEMBERS ONLY
International equity market rotation on Relative Rotation Graphs(tm)
by Julius de Kempenaer,
Senior Technical Analyst, StockCharts.com
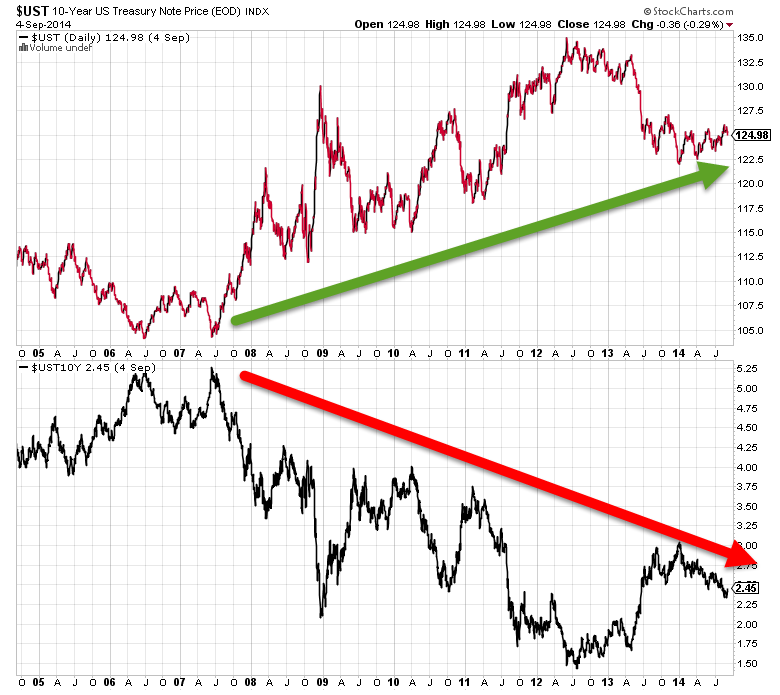
In a previous article we looked at using Relative Rotation Graphs for analyzing asset class rotation. One of the main caveats that was pointed out in that blog was to be very careful on what ticker symbols to use to construct the RRG with. Especially the mixture of yield series...
READ MORE
MEMBERS ONLY
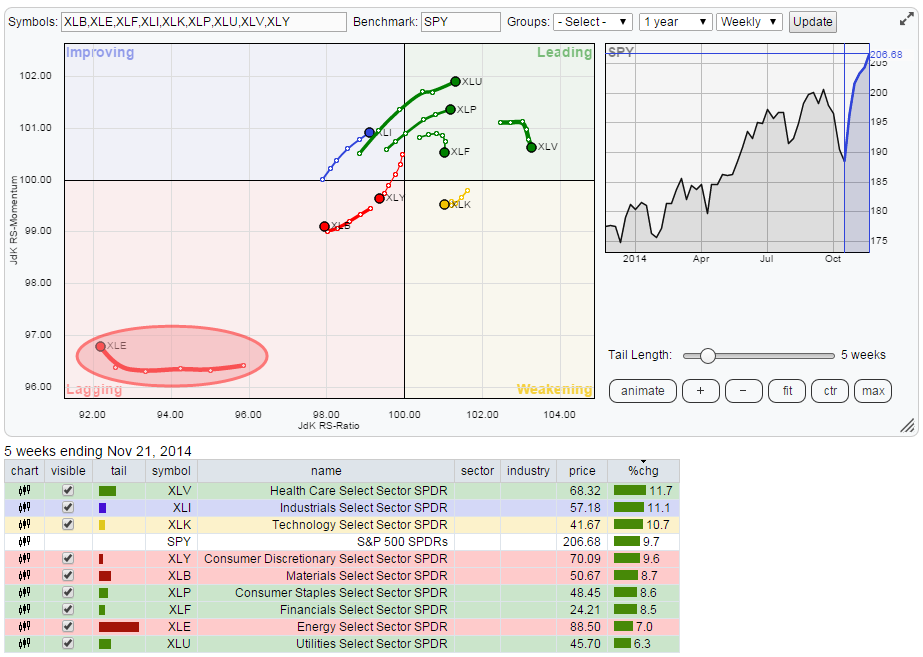
Strong relative rotation for Health Care and Technology
by Julius de Kempenaer,
Senior Technical Analyst, StockCharts.com
The Relative Rotation Graph of the nine sector ETFs against the S&P 500 (SPY) is showing some clear and distinct rotations at the moment. Especially the right hand side of the plot where we find the sectors that are (still) in relative up-trends against the broader S&...
READ MORE
MEMBERS ONLY
Using RRG charts for Asset Allocation
by Julius de Kempenaer,
Senior Technical Analyst, StockCharts.com
One of the comments on my last article (daily data now available for RRG charts) mentioned using RRG charts in relation to monitoring different asset classes, which just happened to be the subject of this article that I was already working on when the comment came in.
"Can RRG...
READ MORE
MEMBERS ONLY
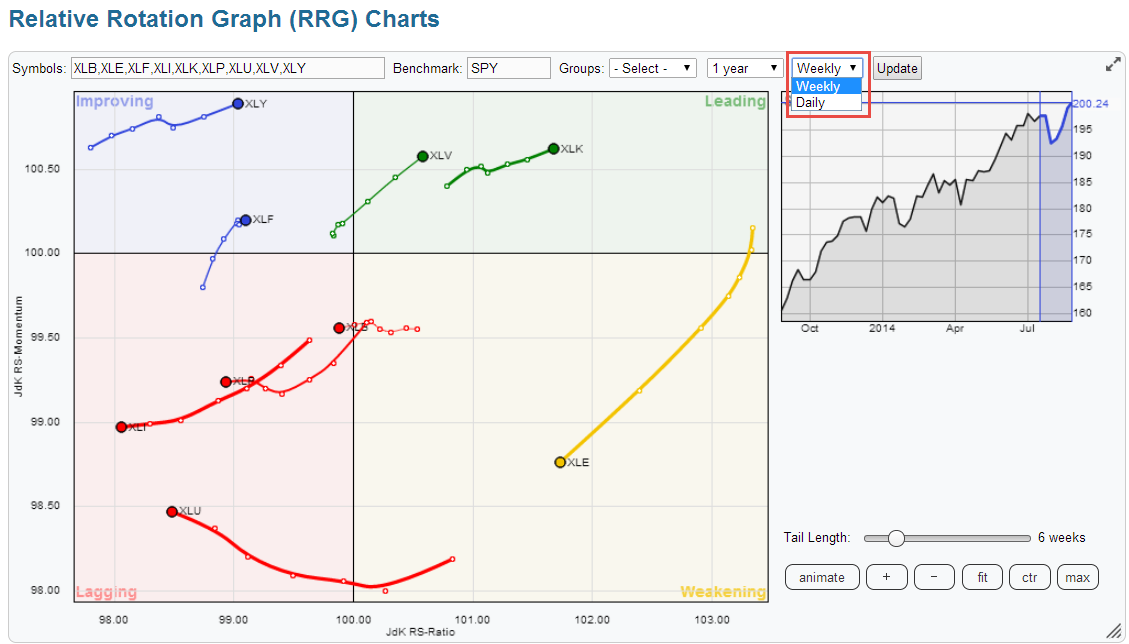
DAILY data now available for RRG charts
by Julius de Kempenaer,
Senior Technical Analyst, StockCharts.com
Until now Relative Rotation Graphs on StockCharts.com could only be rendered using weekly data-streams... Not any more! The early adapters and users who check in on RRGs on a daily basis may have seen the new addition already.
When you open up an RRG chart you will notice that...
READ MORE
MEMBERS ONLY
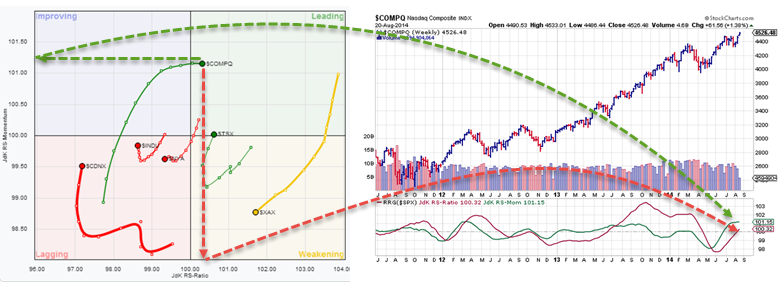
Add RRG (Indicator) Lines to Your Price Charts
by Julius de Kempenaer,
Senior Technical Analyst, StockCharts.com
Relative Rotation Graphs, RRGs, are a wonderful tool to get a grip on the bigger picture of markets and the rotational movement of trends in relative strength across various instruments in a universe or a portfolio. However, this is only the beginning. Once you have detected something that could be...
READ MORE
MEMBERS ONLY
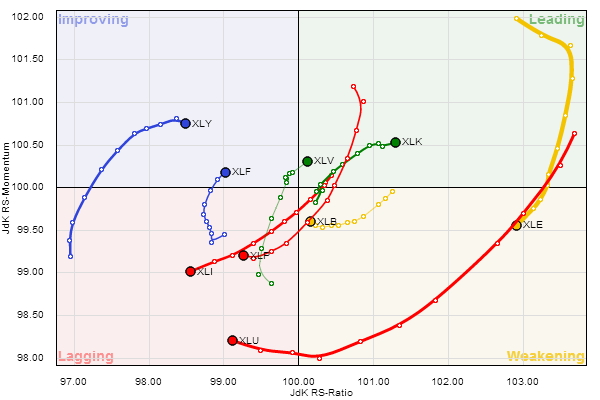
Just to get my feet wet, Industrials to Tech rotation working well
by Julius de Kempenaer,
Senior Technical Analyst, StockCharts.com
Accessing the RRG chart tool from the home page will bring up a number of major index as the default universe. The drop down box labelled "pre-defined" groups will show a number of, indeed just like the title says, pre defined groups for use on a Relative Rotation...
READ MORE
MEMBERS ONLY
RRG's Road to StockCharts.com
by Julius de Kempenaer,
Senior Technical Analyst, StockCharts.com
Editor's Note: Julius de Kempenaer is the creator of Relative Rotation Graphs ("RRGs"). He will be contributing regular articles to this blog about RRGs and how they can be used to improved your investing results. Welcome Julius!
As of last Saturday 19 July 2014 StockCharts.com...
READ MORE