MEMBERS ONLY
This is Your Most Important Decision
by Julius de Kempenaer,
Senior Technical Analyst, StockCharts.com
I talk about it almost every week in Sector Spotlight, but I just realized that I have not written about it for quite a while.
The investment decision that has the most significant impact on your results...
Asset Allocation.
Many, especially retail investors, are so focused on the stock market...
READ MORE
MEMBERS ONLY
Sector Spotlight: Sector Rotation with Seasonality -- A Strong Combination
by Julius de Kempenaer,
Senior Technical Analyst, StockCharts.com
In this episode of StockCharts TV's Sector Spotlight, for this first week of February, I cover both the seasonality and the monthly charts. We have an interesting alignment of seasonal expectation and current sector rotation floating to the surface, offering a nice potential pair trading opportunity.
This video...
READ MORE
MEMBERS ONLY
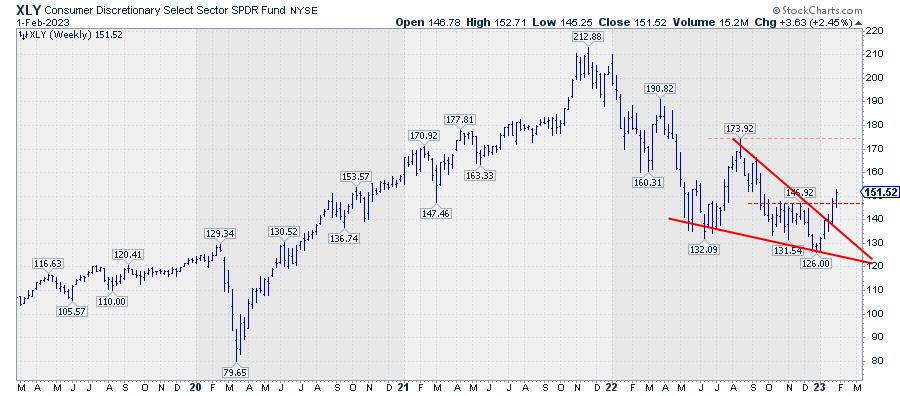
You Gotta Love a Good Wedgie
by Julius de Kempenaer,
Senior Technical Analyst, StockCharts.com
In the second half of 2022, the price chart for XLY started to form a falling wedge pattern.
This pattern or formation is characterized by two converging trendlines, BOTH moving lower. The falling wedge variant comes in two variations. It can be either a continuation within an established uptrend or...
READ MORE
MEMBERS ONLY
Sector Spotlight: Sector Rotation Out of Defense
by Julius de Kempenaer,
Senior Technical Analyst, StockCharts.com
In this episode of StockCharts TV's Sector Spotlight, I address the current state of asset class rotation, then move on to sector rotation. I divide the market in three groups -- Offensive, Defensive and Sensitive -- and find an interesting alignment that should be taken seriously as an...
READ MORE
MEMBERS ONLY
Will This Be THE Break?
by Julius de Kempenaer,
Senior Technical Analyst, StockCharts.com
In this week's episode of Sector Spotlight, I looked at market breadth using two different variations of Relative Rotation Graphs. Following that show, I received an email from a user reminding me of another set of market breadth indices that we keep for sectors: the BullishPercent indices.
You...
READ MORE
MEMBERS ONLY
Two Highly Entertaining Stocks to Watch
by Julius de Kempenaer,
Senior Technical Analyst, StockCharts.com
After a 50% decline, you need to make a 100% return to break even.
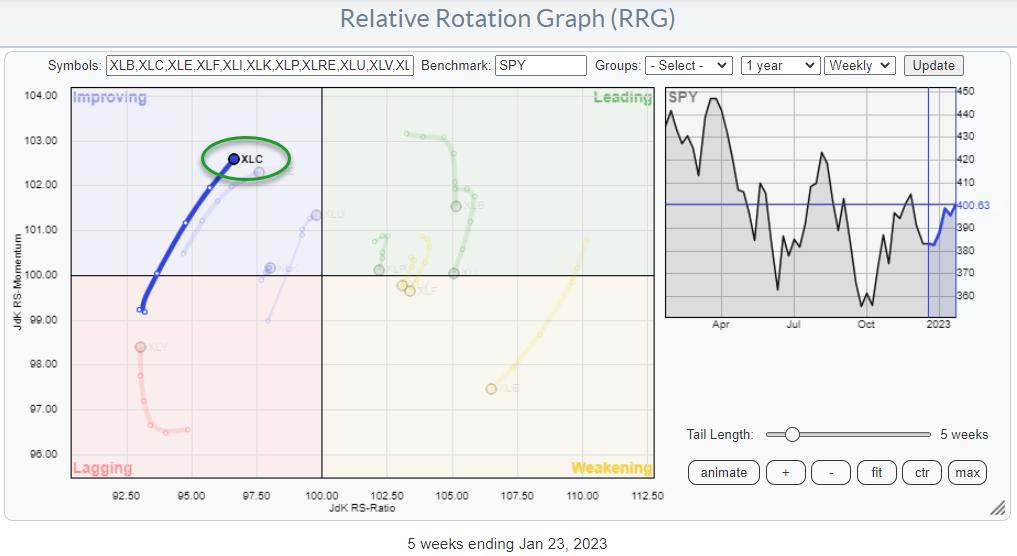
That is precisely what happened to the Communication Services sector. In August 2021, the Communications Services Select Sector SPDR fund (XLC) peaked at 85 and, from that point onward, started a disastrous decline, bringing its price...
READ MORE
MEMBERS ONLY
Sector Spotlight: Sector Rotation Model All Over the Place
by Julius de Kempenaer,
Senior Technical Analyst, StockCharts.com
In this episode of StockCharts TV's Sector Spotlight, I look at the current state of sector rotation, then walk through all 11 sector charts to make an assessment on their individual (relative) trends and their near-term support and resistance levels. Next, I use all this information to "...
READ MORE
MEMBERS ONLY
Return of the REITs?
by Julius de Kempenaer,
Senior Technical Analyst, StockCharts.com
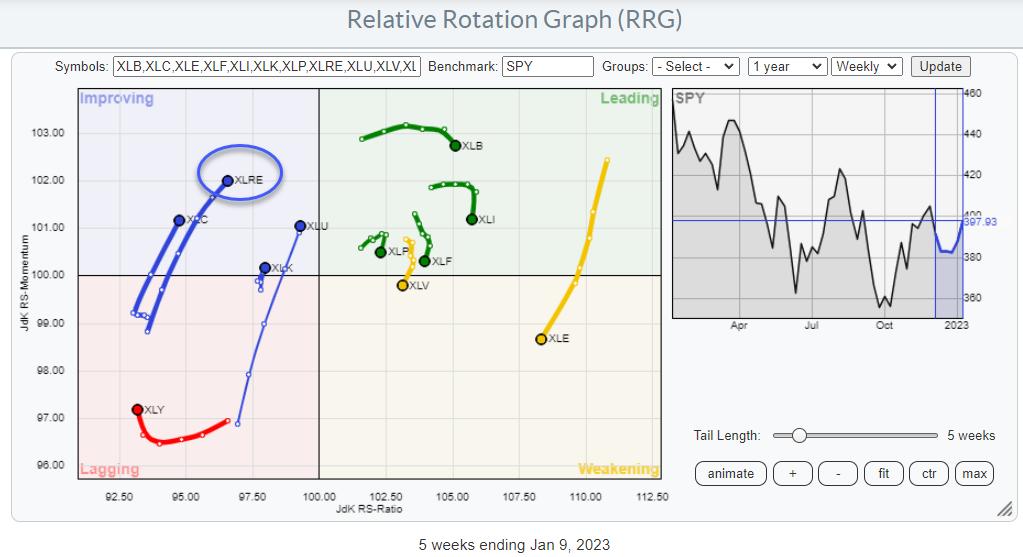
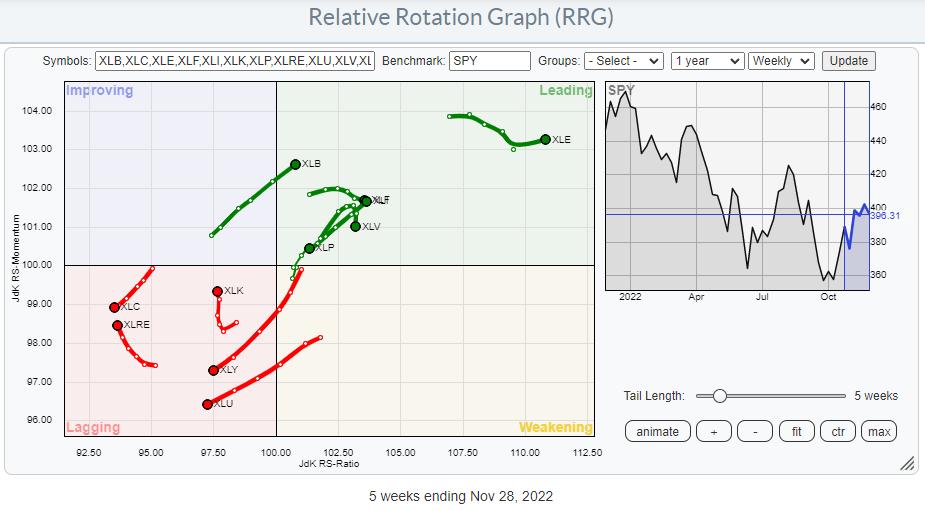
On the Relative Rotation Graph for US sectors, the tail for XLRE, the Real Estate Select Sector Fund, is inside the improving quadrant and heading towards leading at a positive RRG-Heading.
This is one of the few tails with a positive RRG-Heading, between 0-90 degrees. The other ones are Utilities,...
READ MORE
MEMBERS ONLY
Sector Spotlight: Reverse Engineering a Price Target for SPY
by Julius de Kempenaer,
Senior Technical Analyst, StockCharts.com
In this year's first episode of StockCharts TV's Sector Spotlight, I take a look at the Sector Rotation Model and address the current state of stock market sector rotation. Then, I discuss the four macroeconomic indicators that form an integral part of the model to assess...
READ MORE
MEMBERS ONLY
Useful (Multi)Utilities
by Julius de Kempenaer,
Senior Technical Analyst, StockCharts.com
From the Sector Level
On the Relative Rotation Graph for US sectors, the tail for the Utilities sector stands out. It is relatively long compared to the other tails on the graph, which indicates that there is quite a bit of power behind the move. With the tail moving from...
READ MORE
MEMBERS ONLY
Sector Spotlight: Seasonality Points to a Weak Start for 2023!
by Julius de Kempenaer,
Senior Technical Analyst, StockCharts.com
In this year's first episode of StockCharts TV's Sector Spotlight, I address the expected seasonal performance for the stock market and the individual sectors. I locate one sector at high odds for outperforming the S&P 500 in January, as well as a sector with...
READ MORE
MEMBERS ONLY
Looking Back at The Biggest Rotation of 2022
by Julius de Kempenaer,
Senior Technical Analyst, StockCharts.com
I have been quiet on the video and blog side of things over the past weeks. Still, just before you pop the champagne for a grand New Year's eve celebration, I want to take the opportunity to look back at maybe the most important or dominant rotation that...
READ MORE
MEMBERS ONLY
How to Benefit From a Two-Stock Wrecking Ball
by Julius de Kempenaer,
Senior Technical Analyst, StockCharts.com
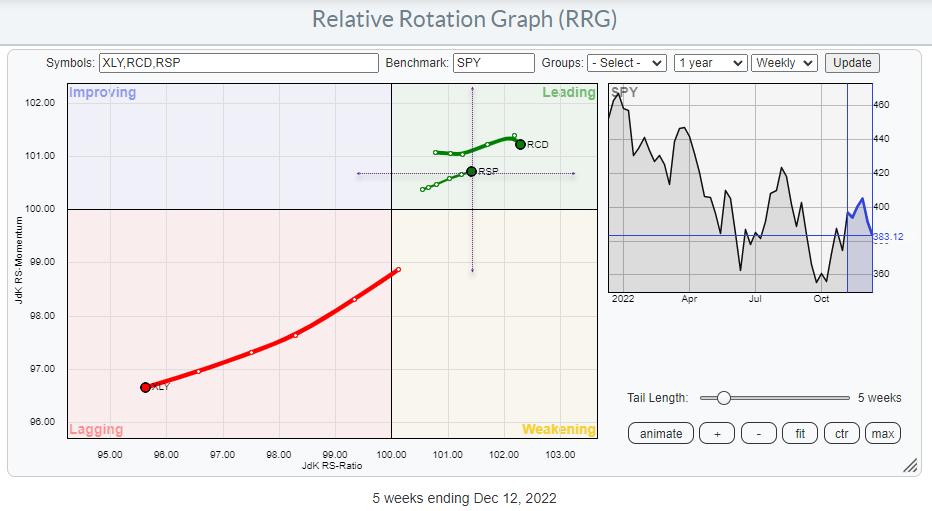
The Relative Rotation Graph above shows an intriguing picture.
Opposite Rotations
Last week in Sector Spotlight, I discussed the opposite rotations for XLY and its equal-weight counterpart RSP vs. their respective benchmarks (SPY and RSP). When you bring up the Relative Rotation Graphs for cap-weighted S&P sectors alongside...
READ MORE
MEMBERS ONLY
Sector Spotlight: Stealth Sector Rotation for XLY
by Julius de Kempenaer,
Senior Technical Analyst, StockCharts.com
In this episode of StockCharts TV's Sector Spotlight, I present a thorough review of the current state of sector rotation in the US market. Materials and Industrials are showing strong tails on the Relative Rotation Graph, but the most interesting -- Under The Hood Rotation -- is showing...
READ MORE
MEMBERS ONLY
Stock Market View: Look Beyond The Length of Your Nose!
by Julius de Kempenaer,
Senior Technical Analyst, StockCharts.com
EUR/USD Under Pressure From Long-Term Resistance
The EUR/USD ($EURUSD) relationship has been under pressure since late 2021, when a peak was set at 1.2350. In a steady downtrend, EUR/USD declined to a recent low of 0.9540. During this decline, a significant support level around 1....
READ MORE
MEMBERS ONLY
Sector Spotlight: USD Index Resting on Major Support
by Julius de Kempenaer,
Senior Technical Analyst, StockCharts.com
In this episode of StockCharts TV's Sector Spotlight, on this first Tuesday of the month, I address the trends for asset classes and sectors on the monthly charts. There is no clear trend for "the market" -- only one sector is in an uptrend, while five...
READ MORE
MEMBERS ONLY
Sector Spotlight: Are Financials Ready to Push?
by Julius de Kempenaer,
Senior Technical Analyst, StockCharts.com
In this episode of StockCharts TV's Sector Spotlight, wrapping up the month of November, I address the seasonality effects for stocks in general, as well as sectors. I then align these historical observations with the actual rotations as they are playing out on the Relative Rotation Graph, while...
READ MORE
MEMBERS ONLY
SPY Remains Under Pressure, But These Sectors are Improving
by Julius de Kempenaer,
Senior Technical Analyst, StockCharts.com
Relative Strength is Losing Its Concentration
Recent sector rotation shows a relative strength loss for two of the three defensive sectors. This is a move away from the trend we have seen for many months, where the defensive sectors were leading the market, sometimes even when the S&P...
READ MORE
MEMBERS ONLY
Sector Spotlight: AMZN & TSLA Causing Weak XLY Rotation
by Julius de Kempenaer,
Senior Technical Analyst, StockCharts.com
In this episode of StockCharts TV's Sector Spotlight, I present a big sector special for the Consumer Discretionary sector. This follows a very brief review of Asset Classes and, more specifically, BTC, followed by a quick look at general sector rotation. For Consumer Discretionary, I highlight the difference...
READ MORE
MEMBERS ONLY
This Stock Trades At a 70% Discount In a Sector That Shows Strong Rotation
by Julius de Kempenaer,
Senior Technical Analyst, StockCharts.com
For weeks already, the rotation of the Industrial sector has been continuing its way deeper into the leading quadrant at a strong RRG-Heading.
For my appearance on the panel of The Pitch this month, I looked at the Relative Rotation Graph of US Sectors to identify three strong sectors where...
READ MORE
MEMBERS ONLY
Sector Spotlight: RRG Shows Rotation from Discretionary to Energy
by Julius de Kempenaer,
Senior Technical Analyst, StockCharts.com
This episode of StockCharts TV's Sector Spotlightis dedicated to a review of the current state of sector rotation in both asset classes and sectors. At Asset Class level, the rotations for the USD and its digital counterpart Bitcoin are worth a closer look as both are showing interesting...
READ MORE
MEMBERS ONLY
Sector Spotlight: Sector Rotation Model Shows the Way
by Julius de Kempenaer,
Senior Technical Analyst, StockCharts.com
On this episode of StockCharts TV's Sector Spotlight, I update the theoretical sector rotation model with my current observations of the ongoing rotation of sectors on the Relative Rotation Graph. For this, I use the equal-weight sector universe, as well as the charts of the four macro economic...
READ MORE
MEMBERS ONLY
Another Risk OFF Signal
by Julius de Kempenaer,
Senior Technical Analyst, StockCharts.com
Discretionary vs Staples Rotation
While preparing for my show Sector Spotlight this week and trying to put things together in a meaningful fashion, I also remembered to look at the XLY:XLP ratio.
When you look at the positioning of the various sectors that are likely to outperform during the...
READ MORE
MEMBERS ONLY
Sector Spotlight: Stocks Rally, But Monthly Trend Remains Down
by Julius de Kempenaer,
Senior Technical Analyst, StockCharts.com
It's the 150th episode of StockCharts TV's Sector Spotlight! This week, I tackle the long-term trends in asset classes and sectors, looking at the monthly Relative Rotation Graphs and the monthly price charts. Despite the recent rally in stocks and the strong recovery for most sectors...
READ MORE
MEMBERS ONLY
Strong Rotation to Value Stocks
by Julius de Kempenaer,
Senior Technical Analyst, StockCharts.com
Over the last 13 weeks, a notable shift from growth to value stocks has taken place. After a rotation from leading, through weakening, into lagging between April and mid-October, the tail for value stocks has re-entered the leading quadrant at a strong RRG-Heading.
Generally, value stocks are seen as more...
READ MORE
MEMBERS ONLY
SPY Rally While Technology and Discretionary Remain On Negative RRG-Heading
by Julius de Kempenaer,
Senior Technical Analyst, StockCharts.com
I don't like it when parts of a puzzle don't match. You just don't get a clear picture.
As participants in the markets, we are trying to solve the puzzle of the markets every day/week/month, and at the start of every new...
READ MORE
MEMBERS ONLY
Sector Spotlight: Inverted Yield Curve Looms Over Stock Market
by Julius de Kempenaer,
Senior Technical Analyst, StockCharts.com
After one week of hiatus, I'm back with a new episode of StockCharts TV's Sector Spotlight. I'll be catching up with a refresher on asset class rotation, as well as sector rotation. In the AC segment, I point to the still-inverted yield curve and...
READ MORE
MEMBERS ONLY
About That Yield Curve Inversion
by Julius de Kempenaer,
Senior Technical Analyst, StockCharts.com
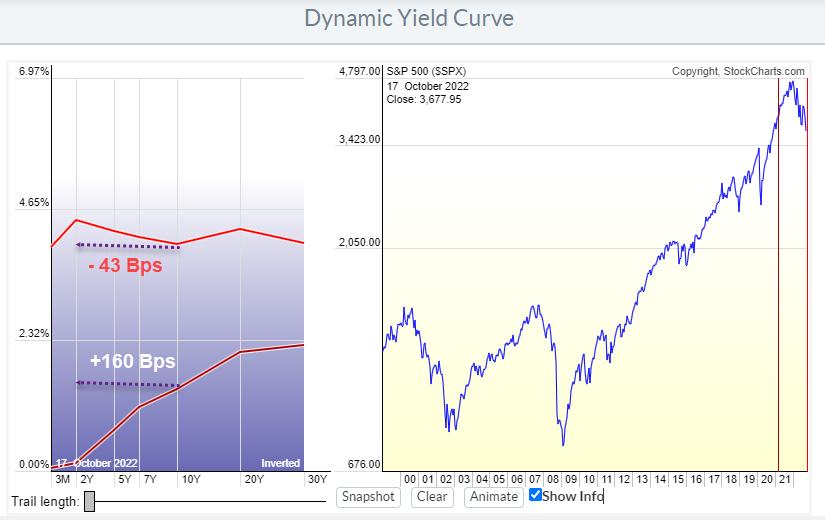
In March 2021, lending money to the US Government for ten years would give you a return of around 1.7%/ann over the next 10 years. Lending money to the government for 2 years at the same time would give you roughly 0.1%/ann for the next 2...
READ MORE
MEMBERS ONLY
Strong Sector Rotation To Financials, But Will It Be Enough to Turn the Market Back Up?
by Julius de Kempenaer,
Senior Technical Analyst, StockCharts.com
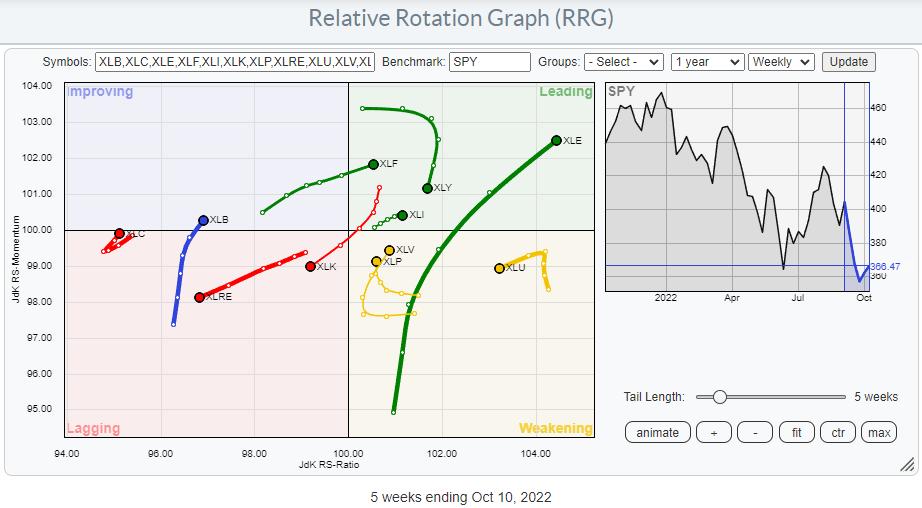
On the weekly Relative Rotation Graph, the tail for XLF has just crossed over into the leading quadrant while keeping up its rising relative momentum. This makes the financials sector one of the leading sectors in the market at the moment.
In the past week, XLF picked up 2.62%...
READ MORE
MEMBERS ONLY
Sector Spotlight: Stocks and Bonds Both Breaking Major Support Levels
by Julius de Kempenaer,
Senior Technical Analyst, StockCharts.com
In this week's edition of StockCharts TV's Sector Spotlight, for the first show of October, I address long-term trends using monthly charts. In line with the longer-term perspective of this show, I start both the asset class and the sector rotation segments with a side-by-side comparison...
READ MORE
MEMBERS ONLY
Sector Spotlight: Sector Rotation Back in Line
by Julius de Kempenaer,
Senior Technical Analyst, StockCharts.com
In this week's edition of StockCharts TV's Sector Spotlight, I review the current rotations for asset classes, where we find continuing strength for the US dollar and fixed-income-related asset classes, while stocks are rotating back to the lagging quadrant. As it is the last Tuesday of...
READ MORE
MEMBERS ONLY
Stocks Sinking Faster Than Dollar Can Rise -- Time to Broaden Your Horizon
by Julius de Kempenaer,
Senior Technical Analyst, StockCharts.com
When markets across the world and all asset classes are dropping, it's time to put things into (international) perspective and see if any alternatives to US stocks are available.
I always keep an eye on this Relative Rotation Graph, which holds a group of international stock market indexes...
READ MORE
MEMBERS ONLY
Sector Spotlight: This is Still a Bear Market, Right?
by Julius de Kempenaer,
Senior Technical Analyst, StockCharts.com
In this week's edition of StockCharts TV's Sector Spotlight, at asset class level, I highlight the strength of the USD, which also plays a role in the weakness of BTC. Stocks and bonds did not move much last week, while commodities seem to be turning. Sector...
READ MORE
MEMBERS ONLY
Two Things I Don't Expect to See in a Bear Market
by Julius de Kempenaer,
Senior Technical Analyst, StockCharts.com
I seriously hope that I was able to make clear in last Tuesday's Sector Spotlight that the market ($SPX) is still on shaky grounds and certainly not (back) in an uptrend. Sure, I mentioned the short-term improvement, which was undeniably there. But also that the upside was littered...
READ MORE
MEMBERS ONLY
Consumer Discretionary Picking Up Strength
by Julius de Kempenaer,
Senior Technical Analyst, StockCharts.com
On the weekly Relative Rotation Graph, the consumer discretionary sector continues to improve and is now pushing further into the leading quadrant. It is now the sector with the highest JdK RS-Momentum reading. The tail length is fairly long compared to the other tails in the universe. All in all,...
READ MORE
MEMBERS ONLY
Sector Spotlight: Money Moving Back to XLY and Bitcoin
by Julius de Kempenaer,
Senior Technical Analyst, StockCharts.com
In this week's edition of StockCharts TV's Sector Spotlight, I start with an overview of the current asset class rotation, using daily and weekly Relative Rotation Graphs. In this segment, I replace VNQ (real estate) with BTC, which better represents the asset class landscape, as Real...
READ MORE
MEMBERS ONLY
Sector Spotlight: 6/11 Sectors in Downtrend on Monthly Chart
by Julius de Kempenaer,
Senior Technical Analyst, StockCharts.com
In this week's edition of StockCharts TV's Sector Spotlight, for the first Tuesday of September, I dive into the monthly chart, which was completed last Thursday. We kick off with a view of sector rotation using the newly added monthly time frame on Relative Rotation Graphs;...
READ MORE
MEMBERS ONLY
Inside Tech, It's Really AAPL vs. MSFT
by Julius de Kempenaer,
Senior Technical Analyst, StockCharts.com
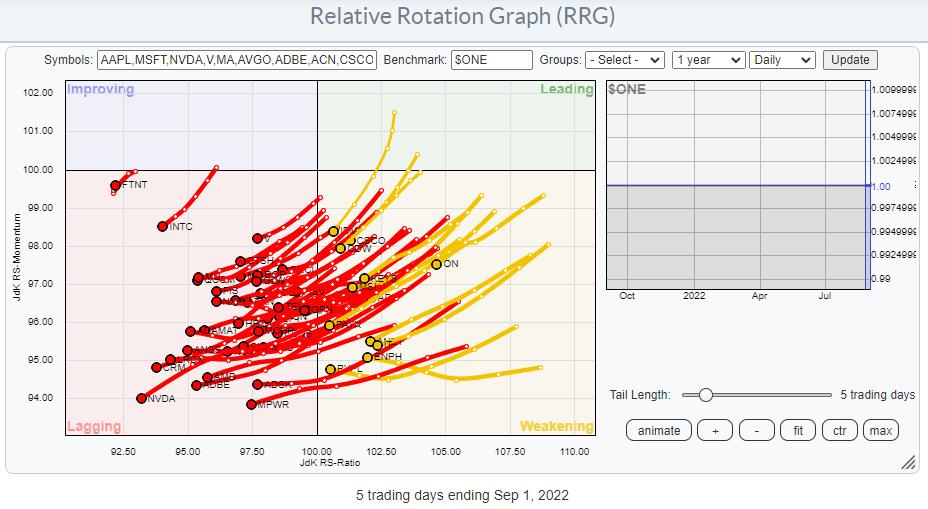
Plotting the components of the Information Technology Sector against $ONE provides us with a sobering picture. Pretty much every single stock in that index is in a downtrend, inside lagging, and/or inside weakening (and very close to entering lagging).
Plotting that same graph on a weekly timeframe shows almost...
READ MORE
MEMBERS ONLY
Sector Spotlight: Weak Sector Rotation Puts $SPX on Track for 3900
by Julius de Kempenaer,
Senior Technical Analyst, StockCharts.com
In this week's edition of StockCharts TV's Sector Spotlight, I look at seasonality and try to align the theoretical expectations for the relative performance of sectors against the S&P 500 going into September with the current reality as it is playing out on the...
READ MORE
MEMBERS ONLY
Don't Even Think About Buying... (This Sector)
by Julius de Kempenaer,
Senior Technical Analyst, StockCharts.com
Staying out of a sector can be as important as being in the right sector. This is particularly true for the Communication Services Sector, and has been for a long time already.
The Relative Rotation Graph above shows the rotation over the last 30 weeks, starting the week of 1/...
READ MORE