MEMBERS ONLY
Bearish Dollar Index Signal Has Major Implications For All Kinds Of Markets And Relationships
by Martin Pring,
President, Pring Research
* Changes in key relationships
* Implications for specific stock sectors of a declining dollar
* The US versus the world
At this week’s Market Roundup webinar, I suggested that we had reached an inflexion point for many markets as well as several Intermarket and inter-asset relationships. That inflexion point centered...
READ MORE
MEMBERS ONLY
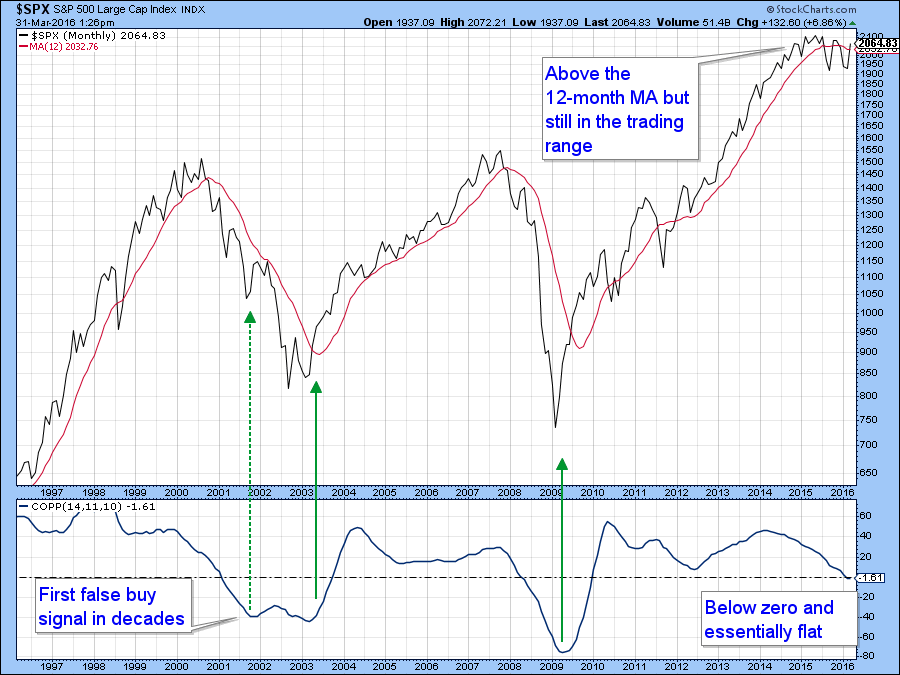
Indicators Still Mixed As The Market Reaches All-Time Highs
by Martin Pring,
President, Pring Research
* Coppock Curve on a buy and sell?
* Record high indicator signals a bull market
* 6/180 PPO right on the cusp of a bull market signal
* Short-term overbought condition argues for a pause
* Commodities breaking to the upside
* Interest rates waffling
During the last couple of months I have...
READ MORE
MEMBERS ONLY
Which Sectors To Hold And Which Sectors To Fold Part II
by Martin Pring,
President, Pring Research
Earlier in the week I reviewed several US market sectors from the point of view of their potential strength or weakness. In this article I’ll cover the rest and then some. If you know what I mean by the term “Nirvana Template” you can skip the next paragraph and...
READ MORE
MEMBERS ONLY
Which Sectors To Hold And Which Ones To Fold?
by Martin Pring,
President, Pring Research
In my Tuesday webinar, I opined that the US equity market is pretty close to a make or break point. While several indicators were still bearish it would not take much in the way of upside action to turn them positive. Of course, they never make it easy, and right...
READ MORE
MEMBERS ONLY
Equities Are Rolling Over Into Corrective Mode
by Martin Pring,
President, Pring Research
* The Coppock Curve tells us the market is at a significant juncture point
* Those pesky credit spreads are deteriorating again
* The US credit markets are close to some important signals
The Coppock Curve tells us the market is at a significant juncture point
Chart 1 features a long-term smoothed...
READ MORE
MEMBERS ONLY
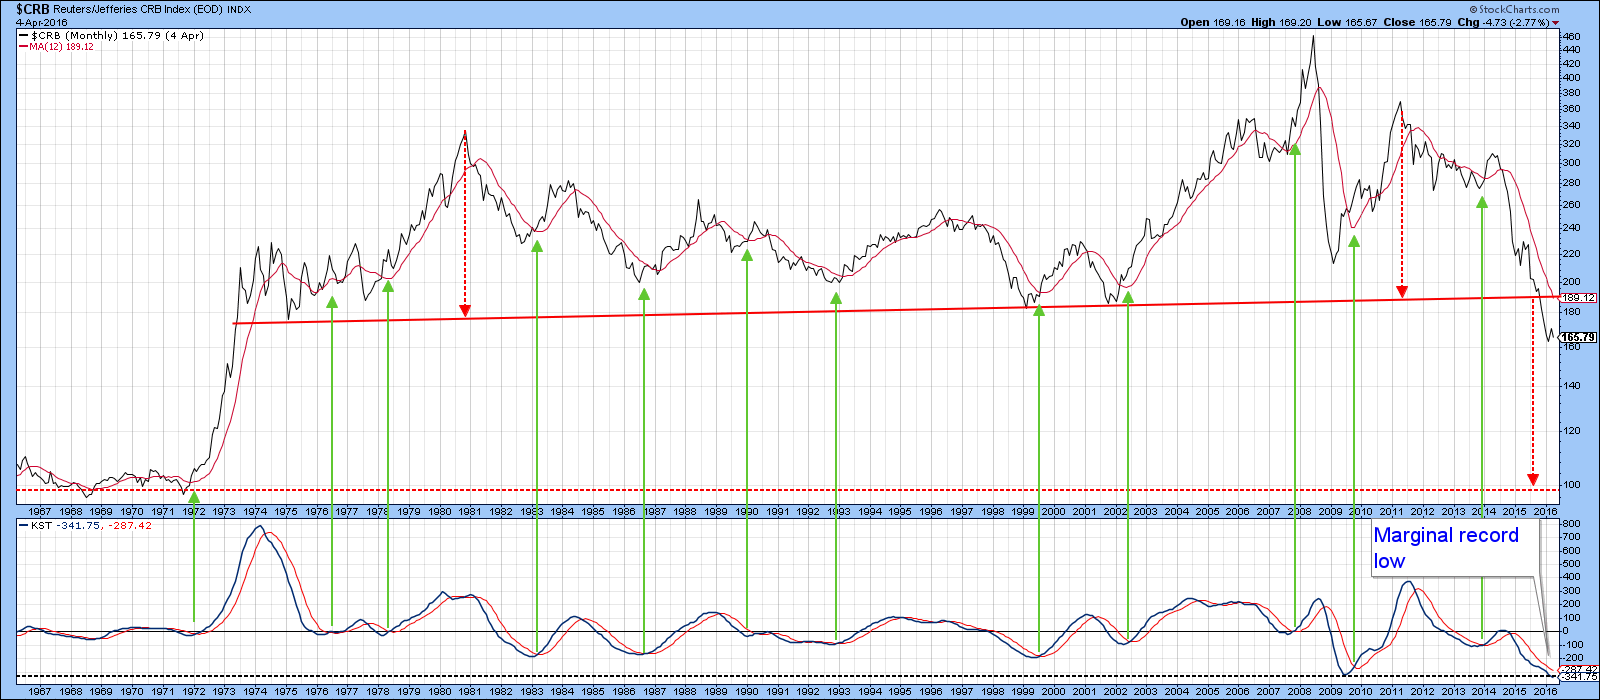
Could Commodities Be In The Process Of Forming A Major Bottom?
by Martin Pring,
President, Pring Research
* A test of the bear market low for commodities is underway
* Relative commodity action favors metals and agriculture
* Stocks to continue to outperform commodities
This week I am focusing on commodity prices, or more specifically on the Commodity Research Bureau Composite ($CRB) to see what might need to take place...
READ MORE
MEMBERS ONLY
US Equities Remain At A Bull/Bear Crossroad
by Martin Pring,
President, Pring Research
* Consistently reliable primary trend indicator on the fence
* Strong breadth
* Equities overbought and lacking in volume
* Rates headed lower?
Consistently reliable primary trend indicator right on the fence
The US equity market continues to bump up against resistance at a time when most short-term oscillators are overstretched. Since volume...
READ MORE
MEMBERS ONLY
Is This The Top Of The Rally Or A New Bull Market?
by Martin Pring,
President, Pring Research
* World indexes not yet above their 200-day MA’s
* USA indexes very overstretched short-term
* Two reliable primary trend indexes at make or break points
Three world equity indexes
StockCharts carries three stock market indexes measuring “The World”. All of them are overbought on a short-term basis, two...
READ MORE
MEMBERS ONLY
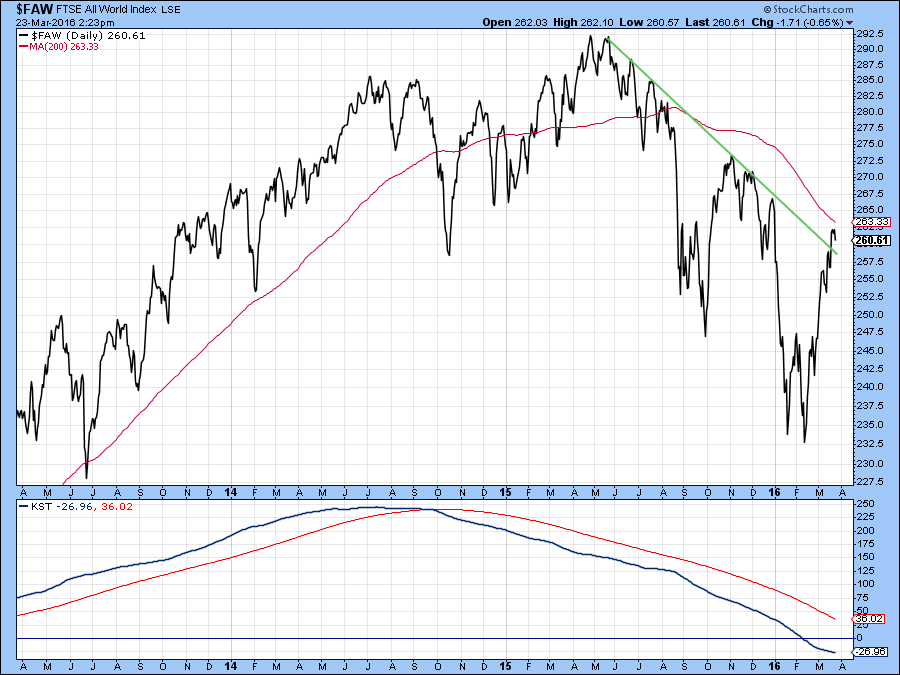
World Stock ETF Rallies Back To Its Bear Market Trendline And 200-day MA. Is The Bear Market Over?
by Martin Pring,
President, Pring Research
* World markets are just below key resistance
* Junk bonds break through their 200-day MA. Will the break hold?
* World Bond Index breaks to the upside
Last week I called for some corrective action in the US equity market based on what, at the time, appeared to be a couple...
READ MORE
MEMBERS ONLY
Contrarian Thinking Says The Equity, Oil And Junk Bonds Rally Is Over
by Martin Pring,
President, Pring Research
* Inflection point for junk bonds?
* Fake out rally a la 2008?
* Short-term oil rally over?
Inflection point for junk bonds?
It has been a feature of this bear market that stocks sell off in concert with junk bonds and oil prices as investors fret over potential energy company defaults....
READ MORE
MEMBERS ONLY
Three Indicators You Should Watch To Signal A New Bull Market
by Martin Pring,
President, Pring Research
* Credit spreads about to turn?
* A PPO that calls primary trends
* Record High Indicator
The market is now starting to respond positively to several bullish intermediate indicators. I still believe the main trend is down, but it seems like a good idea to look at three currently bearish indicators and...
READ MORE
MEMBERS ONLY
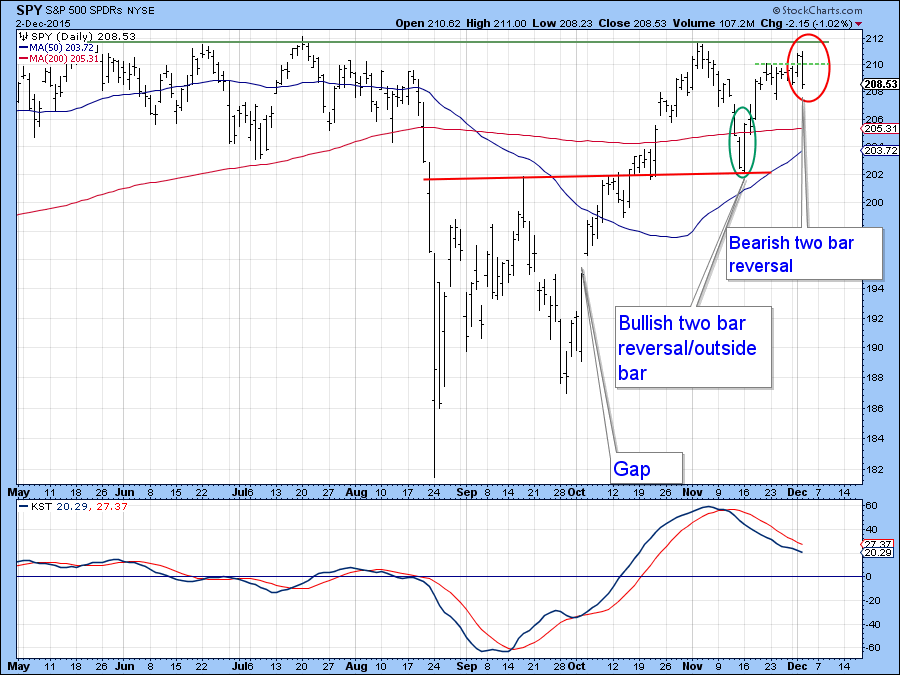
Bearish Two Bar Reversal Says Further Probing of Recent Lows Is Likely
by Martin Pring,
President, Pring Research
* Intermediate rally/consolidation for US equities still on the menu
* Test of the lows is likely first
* Emerging markets continue to look vulnerable
* Gold showing strong technical signs
The Intermediate Rally/trading range
The intermediate rally possibilities, which I have been discussing for several weeks, is still a probability. That’...
READ MORE
MEMBERS ONLY
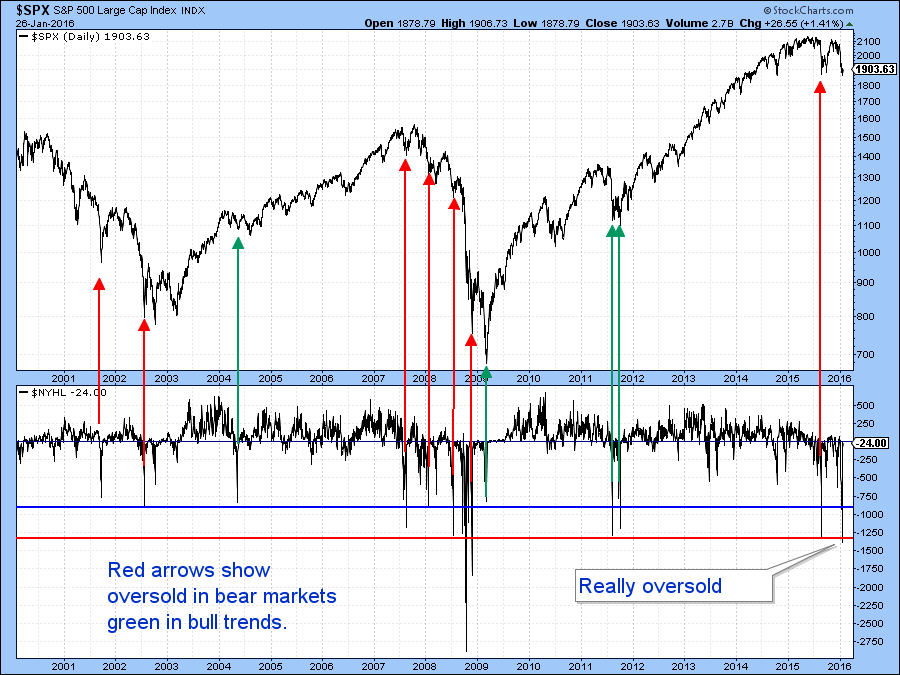
Forget The Hindenburg Omen - Here's Another Possibility To Consider
by Martin Pring,
President, Pring Research
* Five days of Armageddon
* Does the British market still lead the US market
Five Days of Armageddon
For some time, I have been drawing your attention to the fact that many intermediate indicators have been flashing buy signals that even in primary bear markets have triggered some kind of a...
READ MORE
MEMBERS ONLY
More Evidence Of An Intermediate Bear Market Rally Falls Into Place
by Martin Pring,
President, Pring Research
* World breadth series signal that global equities are ready to advance
* Dollar faces an important technical test
Sometimes when the market declines, things actually improve, and that’s what may have been happening this week. In my most recent article, Intermediate Indicators Signal a Rally but Remember It’s a...
READ MORE
MEMBERS ONLY
Intermediate Indicators Still Signal A Rally But Remember, It's A Bear Market
by Martin Pring,
President, Pring Research
* Monday may have been a successful test of the January low
* Five inter-market relationships break out
* The 5-year yield breaks down
For the last two weeks I have been pointing out that several intermediate type indicators that have traditionally signaled rallies were in a bullish mode. The problem...
READ MORE
MEMBERS ONLY
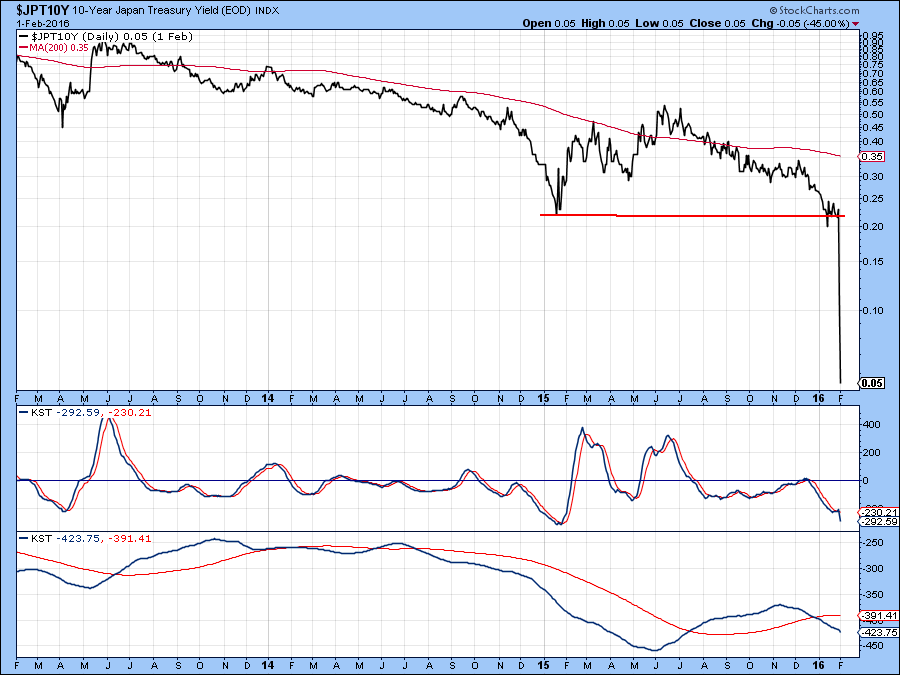
The BOJ Did Not Start The Trend - They Are Following It
by Martin Pring,
President, Pring Research
* Global rates are in freefall
* Interest-sensitive sectors will continue to improve their relative action
* Two sectors that are likely to underperform
The recent move by the Bank of Japan (BOJ) confirmed what rates around the world have already been doing, i.e. moving lower. In Japan’s case, some...
READ MORE
MEMBERS ONLY
A Bear Market Rally Looks As If It Is Underway
by Martin Pring,
President, Pring Research
Several key short/intermediate indicators reverse from oversold conditions
Gold ETF very close to violating its bear market trendline
The intermediate Indicators are bottoming
Internal market action in the last week is starting to confirm the possibility of an intermediate low that I laid out last week. That’s because...
READ MORE
MEMBERS ONLY
Trolling For Bottom Fishing Indicators
by Martin Pring,
President, Pring Research
* Dow Jones Utility Average just above its secular up trendline
* 2-year yield probably gave a false upside breakout signal
* Three indicators to watch for an intermediate equity bottom
Yesterday at the webinar Greg asked me a question that was posed by one of the attendees relating to a potential...
READ MORE
MEMBERS ONLY
What Happens If The Fed Is Wrong
by Martin Pring,
President, Pring Research
* Erie comparisons to 1929
* Credit spreads worsen
* 30-year bond yields break down prices break out
When the fed raises interest rates after a long series of declines it usually signals a change in policy and the start of a new trend to higher rates. What happens, though, when the...
READ MORE
MEMBERS ONLY
Please Show Me A Bullish Long-Term Equity Chart
by Martin Pring,
President, Pring Research
* Europe, Asia and Latin America all look bearish
I am not kidding. Today I went through pretty well all of the country ETF charts looking back a few years with the long-term KST. I could find only one bullish chart as displayed here as Chart 1. As you can...
READ MORE
MEMBERS ONLY
Long-Term Top Looking More And More Likely
by Martin Pring,
President, Pring Research
* Several historically reliable indicators are saying “bear”
* World stocks looking extremely toppy
* Shanghai may be forming a head and shoulders top
At my first webinar of the year on Tuesday, it seemed a good idea to load the presentation with some longer-term charts, as they are all pointing to...
READ MORE
MEMBERS ONLY
Did The Market Go Up or Down In 2015?
by Martin Pring,
President, Pring Research
* This week’s bearish two-bar reversal threatens a bullish seasonal for equities
* Airlines may be set to join railroads and truckers on the downside
* Dollar Index keeps us guessing, which means the next move is likely to be worthwhile
* Pound completes a bearish long-term head and shoulders
The...
READ MORE
MEMBERS ONLY
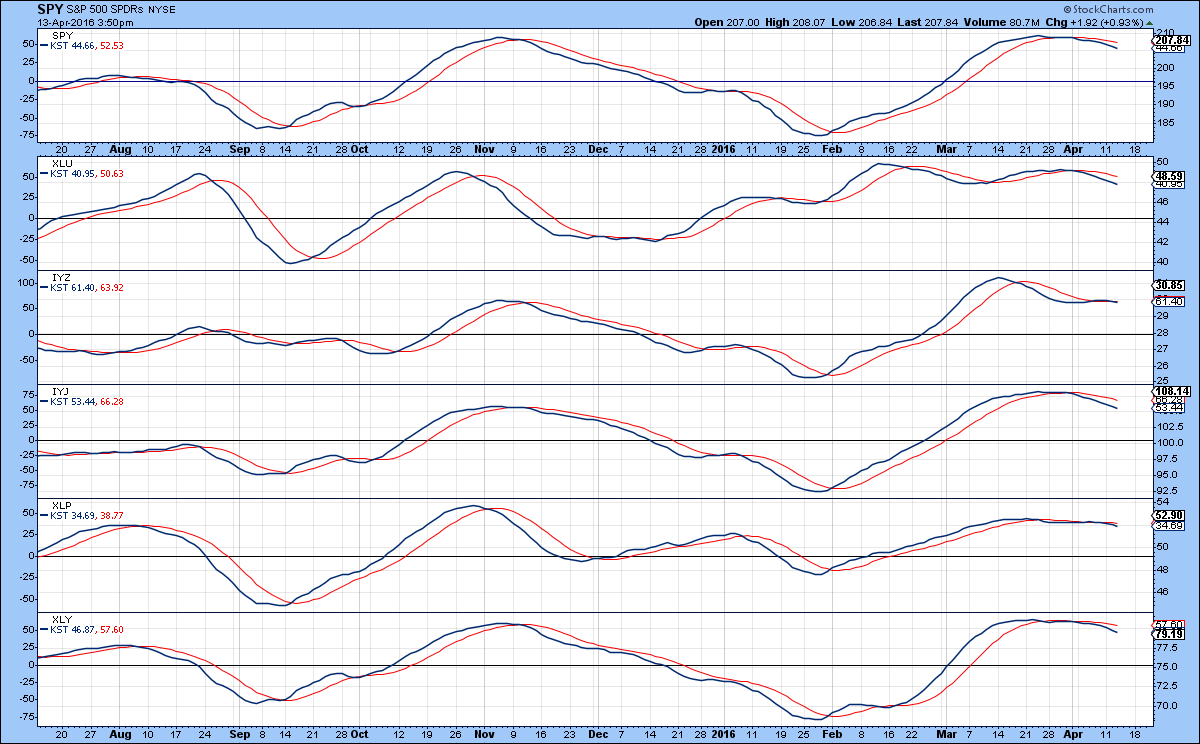
Market Sectors: The Good The Bad And The Ugly
by Martin Pring,
President, Pring Research
* Home builders, KBW banks, consumer cyclicals and resources look vulnerable
* REIT's, utilities, and healthcare look promising
This week I am going to back off from the usual market commentary in order to focus on some industry groups and sectors that have the potential to lead the market higher...
READ MORE
MEMBERS ONLY
Bearish Two Bar Reversal Threatens The Pre-Christmas Rally
by Martin Pring,
President, Pring Research
* Two bar reversal brings the effect of the rate hike back to reality
* Broadly based dollar ETF breaks to new highs
* Gold closes at a new low on expanding volume
Earlier in the week I pointed out that many of the market averages had formed exhaustion days on Monday and...
READ MORE
MEMBERS ONLY
Small Caps Complete 12-year Top Relative To Large Caps
by Martin Pring,
President, Pring Research
* Bullish exhaustion on Monday suggests that last week’s lows will hold during 2015
* Longer-term indicators continue to point to an overall topping out process
* Small caps break down against large caps
* 30-year yield at a critical juncture
* Euro and yen-denominated gold complete large bearish (deflationary) formations...
READ MORE
MEMBERS ONLY
More Of The Santa Sell-Off To Come?
by Martin Pring,
President, Pring Research
* Volume starting to expand on the downside
* Half a Dow Theory sell signal on the weekly charts
* 30-year yield locked in a tight trading range
* Dollar Index facing important test
Expanding volume on the downside
This market continues to be plagued with volume problems. Initially, it was a lack...
READ MORE
MEMBERS ONLY
Did Friday's 370-Point Rally Change Anything For The Equity Market?
by Martin Pring,
President, Pring Research
* Friday’s rally fails to reel in new highs
* Guggenheim asset flows just above critical support
* 30-year yield caught between two converging trendlines
* Energy SPDR XLE completes a bearish head and shoulders
A couple of days ago I wrote that a bearish two-bar reversal that had developed in...
READ MORE
MEMBERS ONLY
Volume Is About To Expand, But Which Way Will It Send Prices?
by Martin Pring,
President, Pring Research
* Two bar reversal for the S&P says the rally is over
* Volume is oversold. That means volume is likely to expand on the downside.
* Credit spreads challenging their bear market lows
* Commodities breaking down in a very big way
* This week's two-bar reversal says the...
READ MORE
MEMBERS ONLY
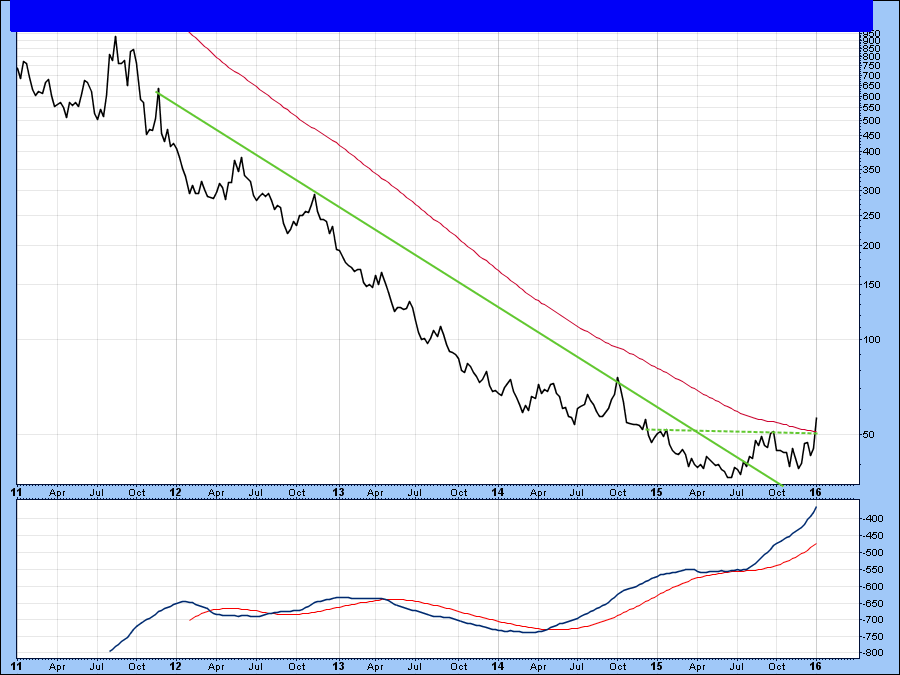
Time To Watch Those Commodities Like A Hawk
by Martin Pring,
President, Pring Research
* CRB Composite touches a 40-year low but is deeply oversold
* Oil is also at critical support
* Short-term commodity picture finely balanced but narrowly favors the bears
* Dollar Index is back at its March 2015 high
* Some short-term dollar indicators starting to roll over
Long-term commodity picture...
READ MORE
MEMBERS ONLY
Market Explodes On Bad News. Has The Year-End Rally Begun?
by Martin Pring,
President, Pring Research
* Two bar reversal says the market is going higher near-term
* Credit spreads at key juncture point
* Oil showing tentative sign of a short-term reversal but confirmation is required
They say that a market that does not decline on bad news is usually ready to reverse to the upside....
READ MORE
MEMBERS ONLY
Onward And Downward, The Correction Is Likely To Continue
by Martin Pring,
President, Pring Research
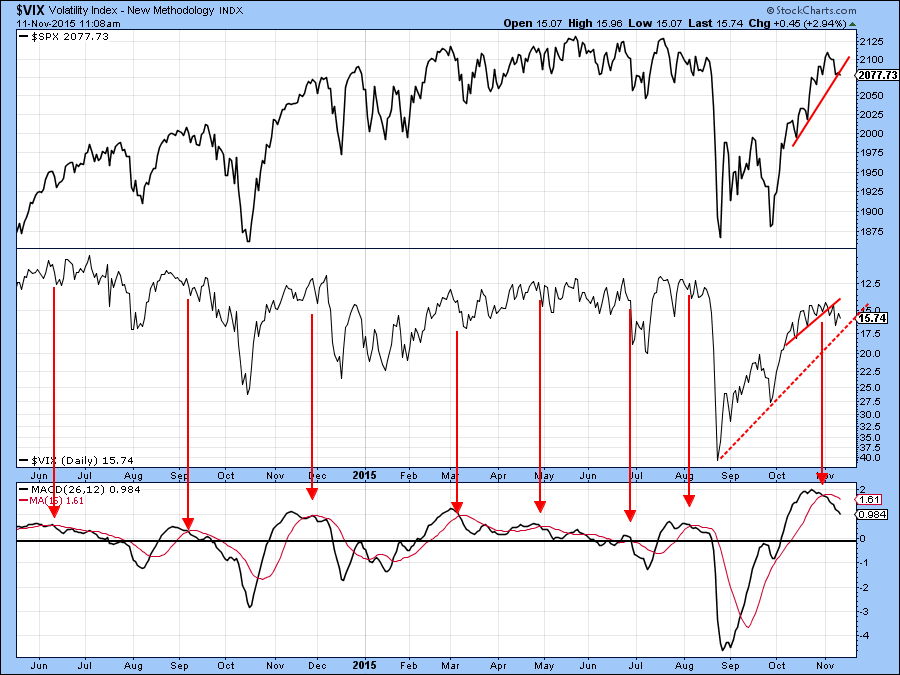
* KST for the VIX triggers a sell signal for equities in general
* Junk Bonds have reversed to the downside
* Dollar breaks to the upside on a broad basis
* Some commodities break to new lows
The corrective process we talked about last week is still underway. Sometimes the technical position improves...
READ MORE
MEMBERS ONLY
November Should Tell Us Whether US Equities Are In A Bull Or Bear Market
by Martin Pring,
President, Pring Research
Market pullback likely in November
* Rates rising across the yield maturity spectrum
* Dollar Index close to an upside breakout
* Commodities look weaker
The short-term condition of the market is very overstretched, to say the least. Even if we are still in a bull market some form of November correction...
READ MORE
MEMBERS ONLY
Upside Breakout In The Dollar Index May Be Close At Hand
by Martin Pring,
President, Pring Research
* Market breadth on the rally not so hot
* Credit spreads are a likely bell weather for equities
* Dollar Index reaches critical resistance
The power of the recent rally has been a surprise to most observers including myself. The big question is whether it is part of a topping out process,...
READ MORE
MEMBERS ONLY
Lots Of Markets Are At Crucial Juncture Points
by Martin Pring,
President, Pring Research
* US Equities remain short-term overbought
* Yield curves starting to steepen (decline)
* All bond maturities are at critical trendlines
* Dollar about to break down?
* Gold about to break out?
US Equities
Earlier in the week I indicated that several short-term indicators such as the Price Percentage Oscillator(PPO) using...
READ MORE
MEMBERS ONLY
Is it Time for a Digestion of Recent Equity Gains?
by Martin Pring,
President, Pring Research
* The 8/16 PPO for the SPX is overbought
* Nasdaq is running into major resistance
* The HYG experiences a false upside breakout and a bearish shooting star
The week before last, I drew your attention to the fact that since the August sell-off recent market gyrations had been truncated...
READ MORE
MEMBERS ONLY
Is The Dollar Likely To Make A Big Move Soon?
by Martin Pring,
President, Pring Research
* The primary trend in the dollar is still bullish but..
* Broad momentum measures of the dollar are negative
* Euro is caught between two possible scenarios
The US Dollar Index ($USD) has been in a trading range for several months and may be about to break out, but which way? The...
READ MORE
MEMBERS ONLY
US Stock Market Successfully Tests its August 24 Low
by Martin Pring,
President, Pring Research
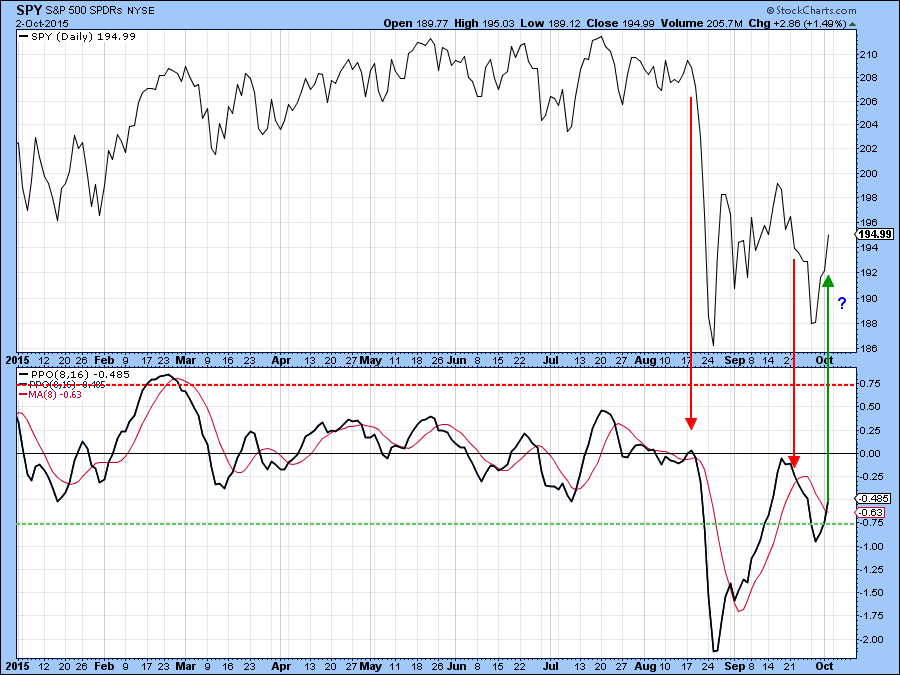
* 8/16 PPO triggers a buy signal for the S&P Composite
* Resource-based stocks showing signs of improving relative action
* Bonds experience an exhaustion day
Earlier in the week I noted that the market was getting pretty close to the August lows but that the indicator that I...
READ MORE
MEMBERS ONLY
Bond Market Quality Spreads Are Signaling More Trouble Ahead
by Martin Pring,
President, Pring Research
* Test of the August 24 intraday lows is at hand
* Junk bonds complete 3-year top
* Credit spread may be leading the Dollar Index higher
* The yields on short-term treasury maturities may be peaking
Testing the lows
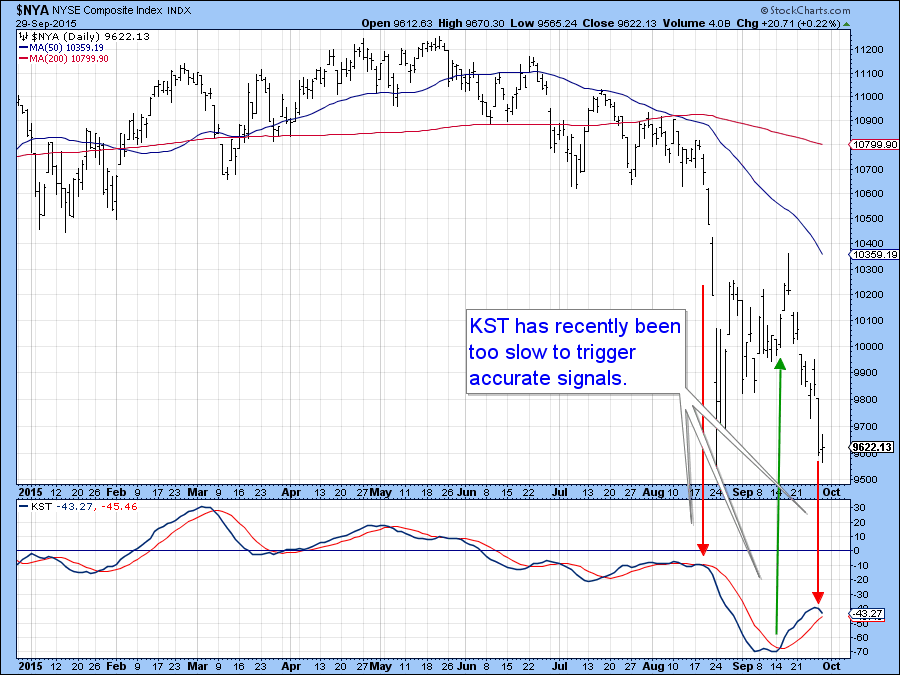
Normally I like to use the KST to determine when momentum has...
READ MORE
MEMBERS ONLY
Which Sectors, If Any, Are Poised To Lead The Market Higher?
by Martin Pring,
President, Pring Research
It’s no secret that I have been bearish on the equity market for some time. Nevertheless, it's always a good idea to remain flexible and look at all angles, so at Tuesday's webinar Greg asked me a great question. What would need to happen to...
READ MORE
MEMBERS ONLY
Market Loses Confidence in the Fed
by Martin Pring,
President, Pring Research
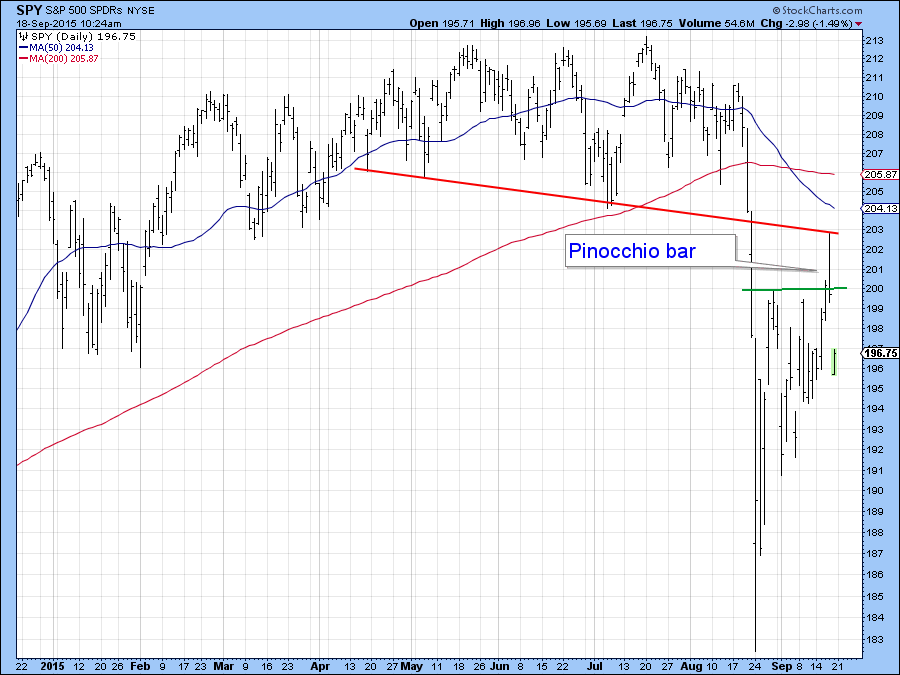
* Thursday’s action represents a bearish Pinocchio bar.
* Long-term indicators remain bearish.
* Will Friday’s trading have a silver lining?
Thursday’s Pinocchio bar
In last week’s article I pointed out that several market averages had experienced bearish engulfing patterns and that a test of the lows was...
READ MORE