MEMBERS ONLY
Four Charts that are Acting in an Unintuitive Way
by Martin Pring,
President, Pring Research
Prices often move in the opposite direction to the expectations of most investors and traders. In many cases, that happens because the latest news has already been factored into prices and market participants have already begun to anticipate the next development. For example, a group of institutions might like the...
READ MORE
MEMBERS ONLY
This Sector Bucked Last Friday's Decline and Could Be Ready to Take Off
by Martin Pring,
President, Pring Research
A couple of weeks ago, I wrote about the fact that the technical position of gold was extremely finely balanced, and that it was "Either in a Hard Place or a Sweet Spot". My conclusion was that its short-term position was improving and that the sweet spot scenario...
READ MORE
MEMBERS ONLY
What Happens When Bonds Start to Outperform Stocks?
by Martin Pring,
President, Pring Research
It is possible for prices of individual asset classes to move in a linear up or down trend for an extended period. However, this rarely happens with inter-asset relationships, which rotate around the business cycle. As a result, it is helpful to monitor inter-asset relationships and their momentum to see...
READ MORE
MEMBERS ONLY
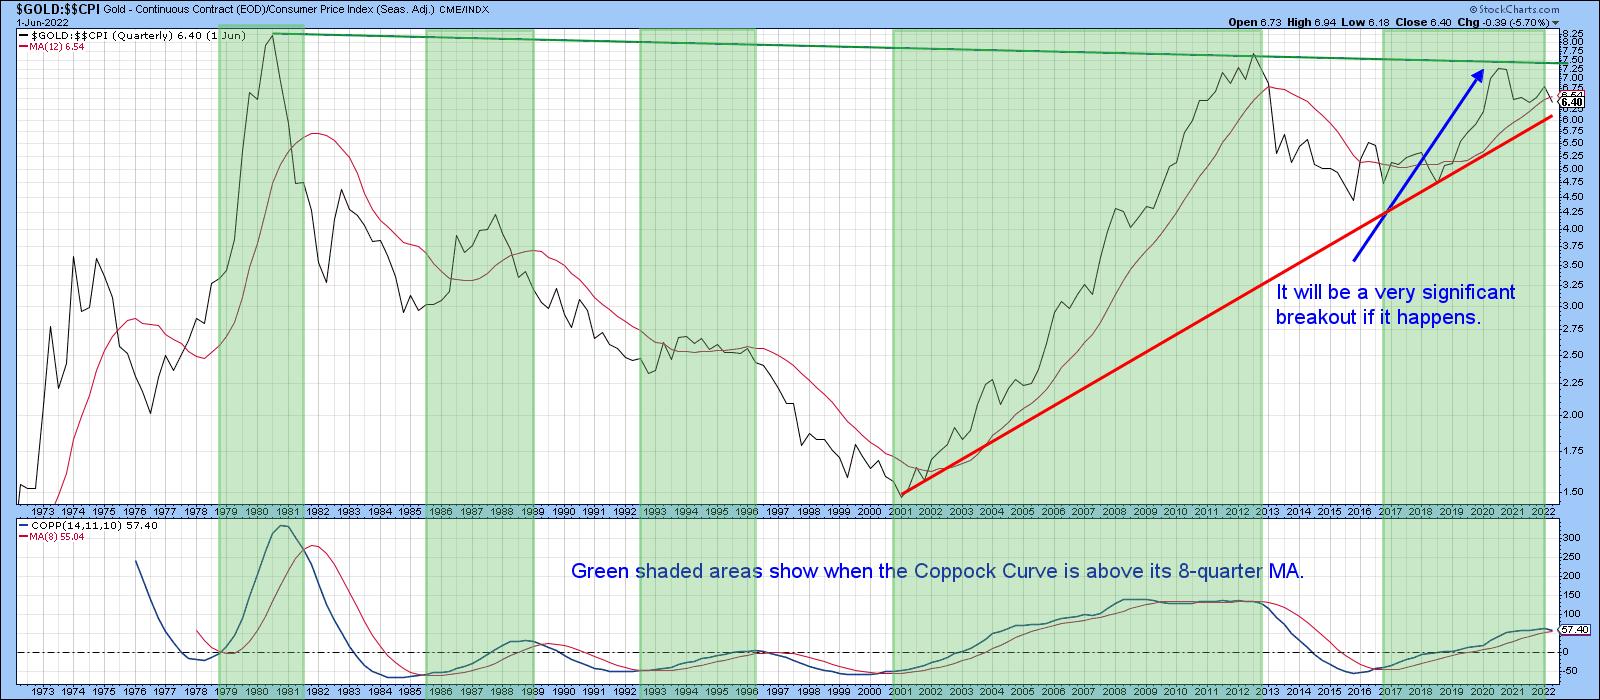
Gold: Either in a Hard Place or a Sweet Spot
by Martin Pring,
President, Pring Research
The long-term technical position of gold is extremely finely balanced and could easily tip into a full-fledged bear market, or start a new secular up leg to the bull trend that began in the opening years of this century.
Chart 1 really says it all. First, it expresses gold adjusted...
READ MORE
MEMBERS ONLY
It's Time for a Rally, But that Comes with a Catch
by Martin Pring,
President, Pring Research
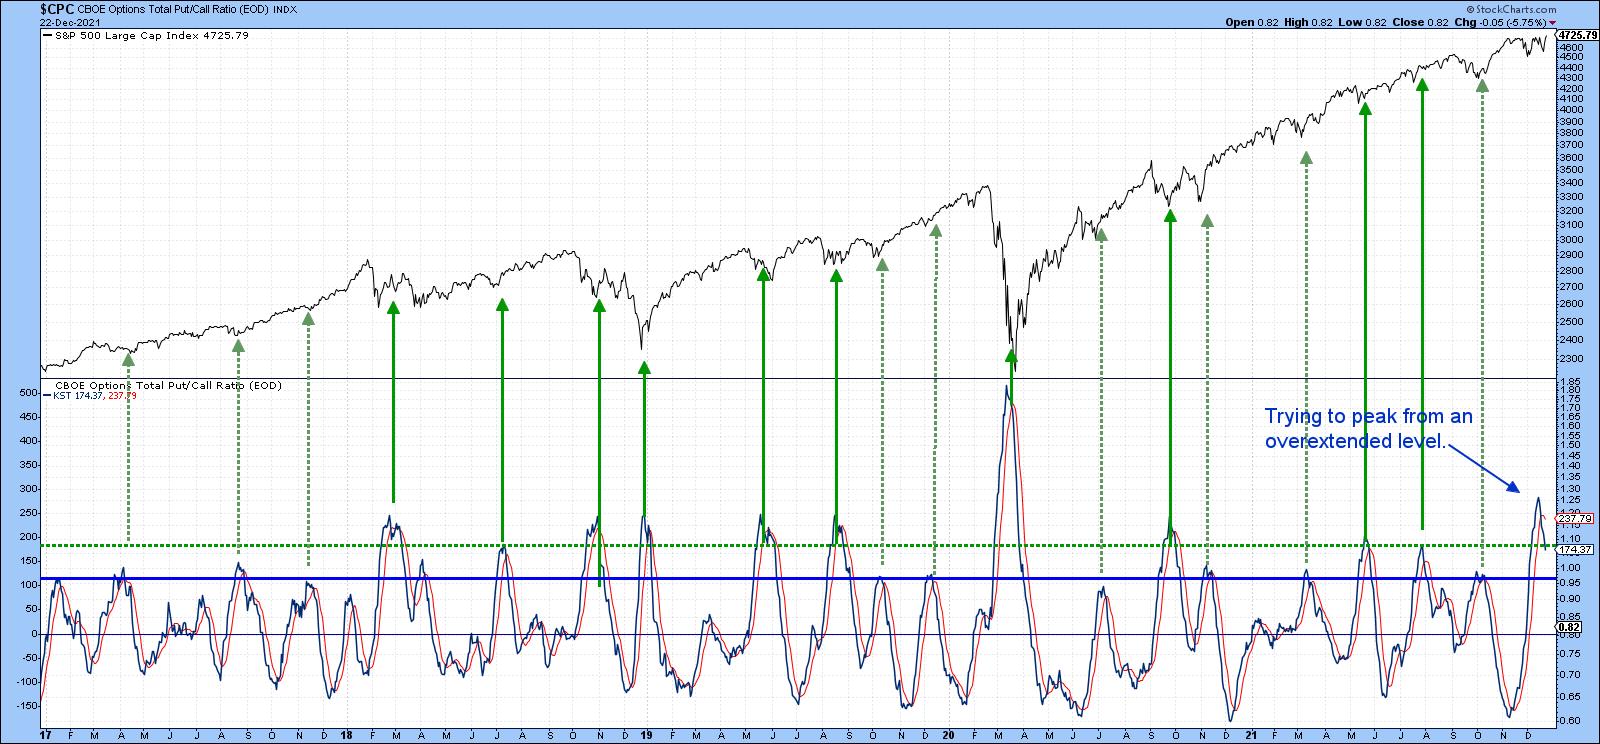
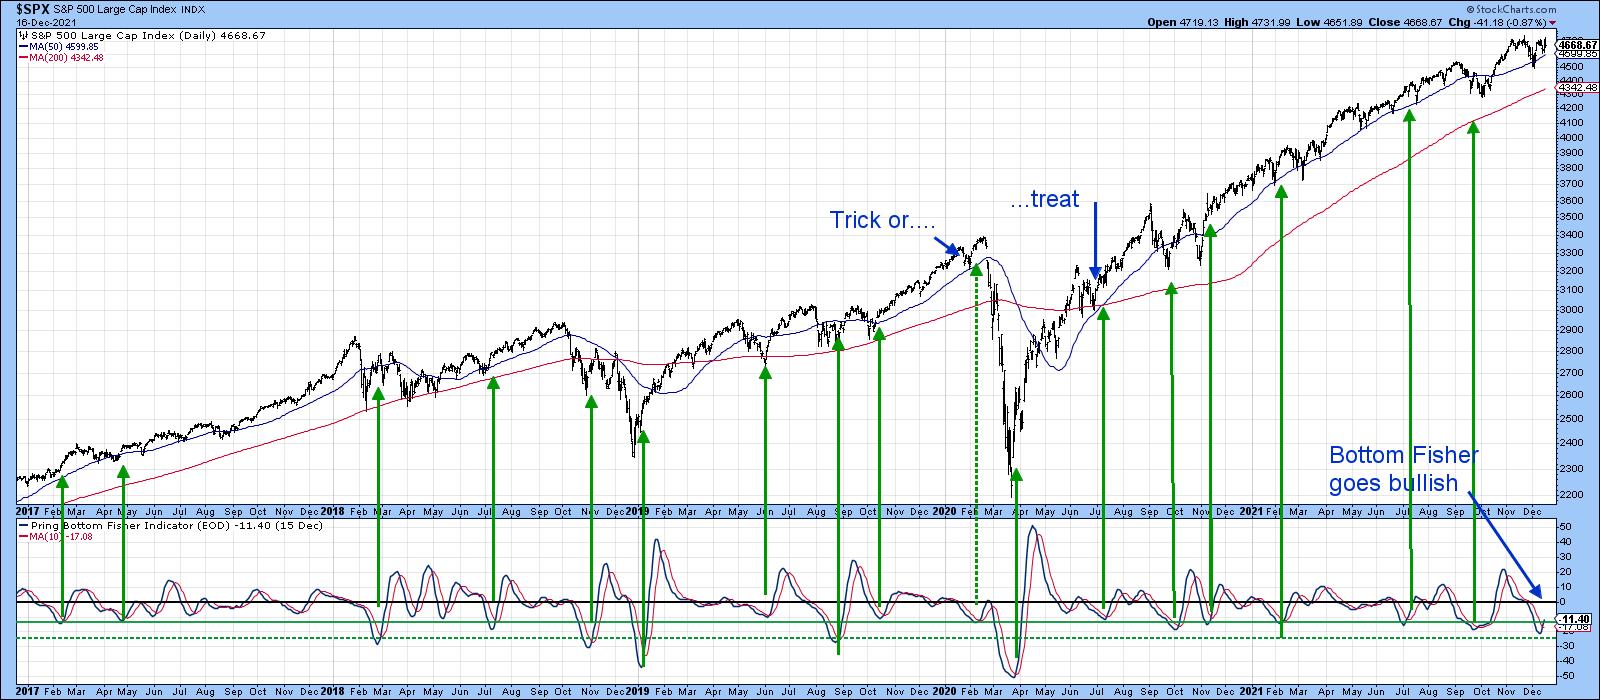
The stock market's recent sell-off has made the front pages and top headlines in TV broadcasts, and CNN's famous Fear and Greed Index has fallen to an extreme level of fear. My contrarian bones say it's time for a rally. Is that right? Yes...
READ MORE
MEMBERS ONLY
Commodities on the Verge of an Upside Breakout, But Participation Will Likely Narrow
by Martin Pring,
President, Pring Research
Chart 1 shows that the Invesco DB Commodity Tracking Fund could be on the verge of breaking out from a 3-month consolidation pattern. It also points out that the number of commodities participating in the rally has been narrowing of late. That's because the indicator monitoring a universe...
READ MORE
MEMBERS ONLY
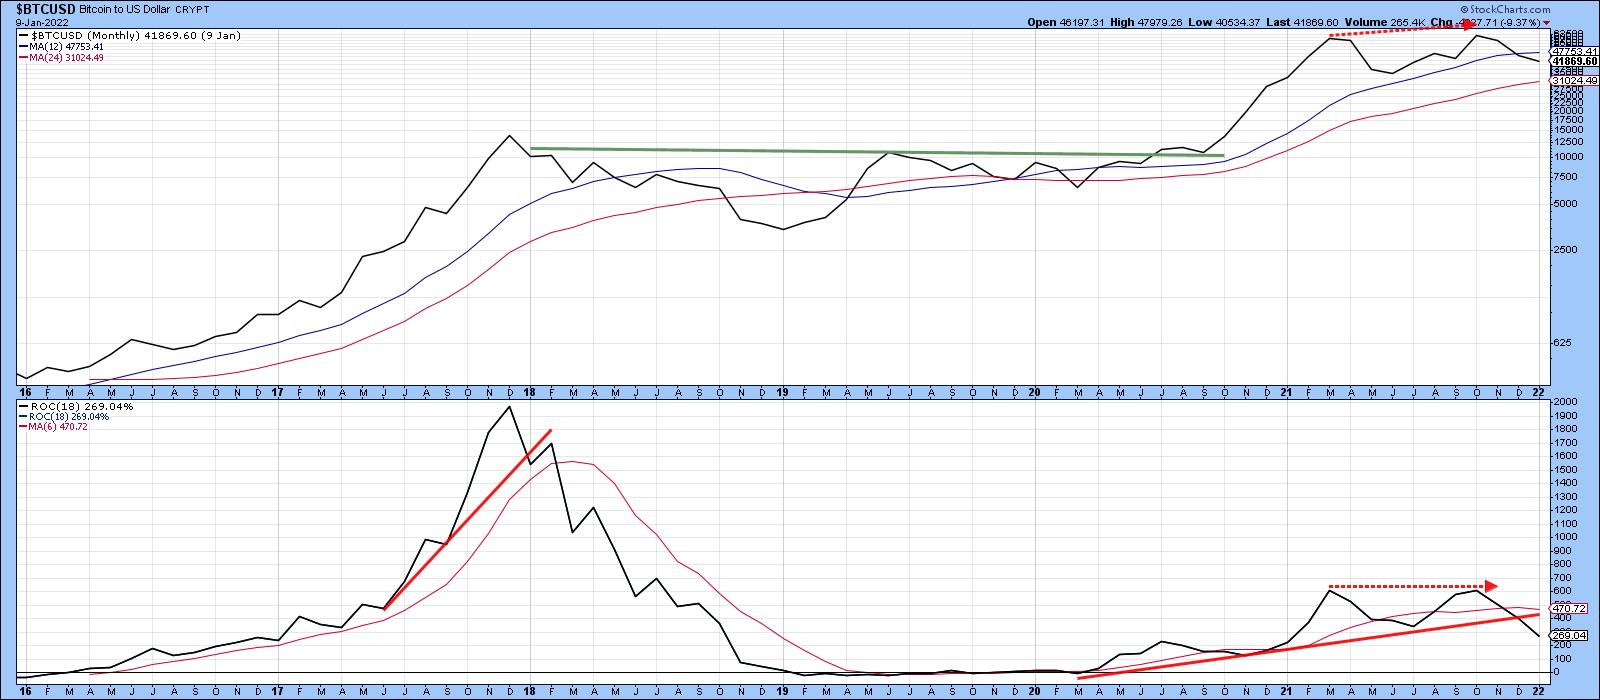
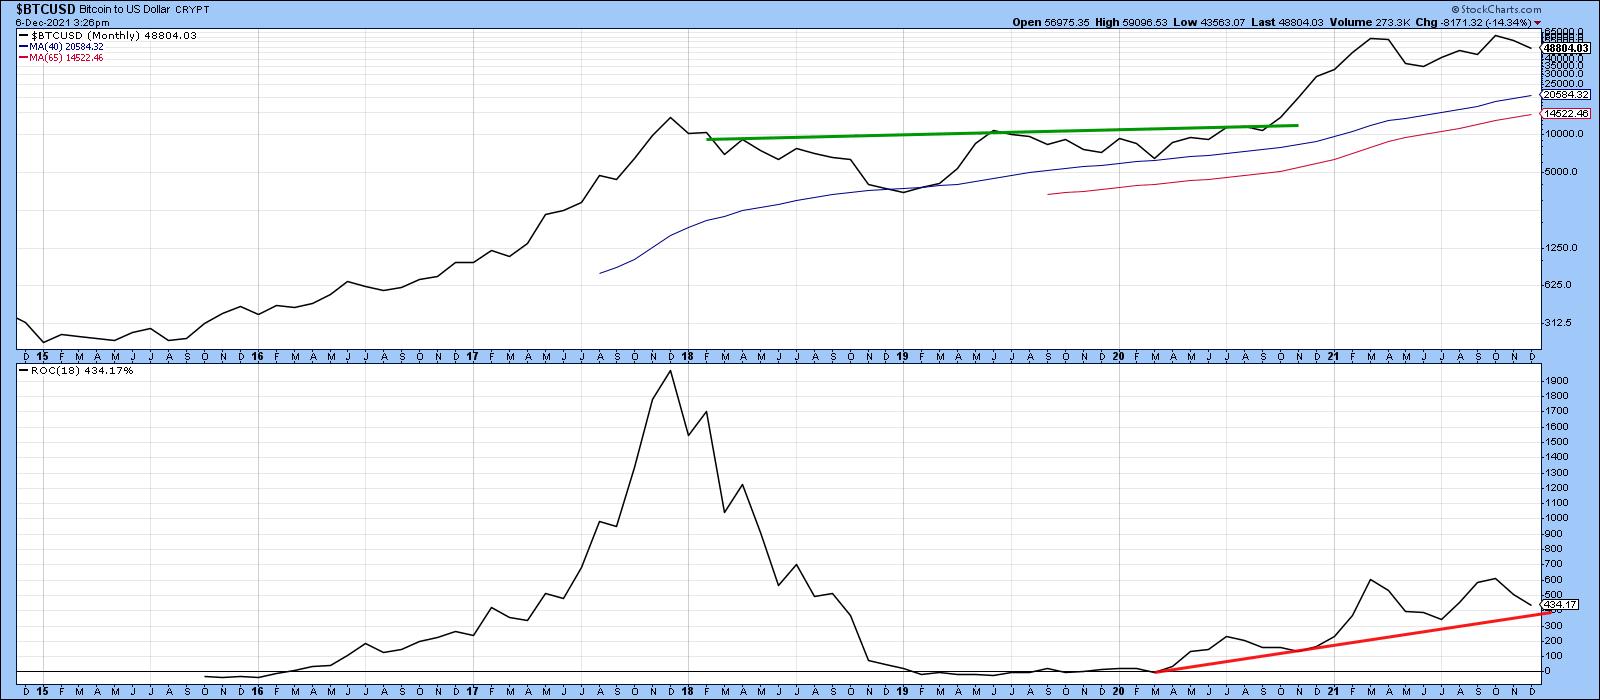
Bitcoin Bubble Finally Bursts
by Martin Pring,
President, Pring Research
I have written two articles about Bitcoin in recent months. The first,last December, concluded that "there are definitely some cracks appearing (in the technical structure), but a shrinking consensus of evidence continues to point to an uptrend." Thesecond, entitled "Has the Bitcoin Bubble Burst", noted...
READ MORE
MEMBERS ONLY
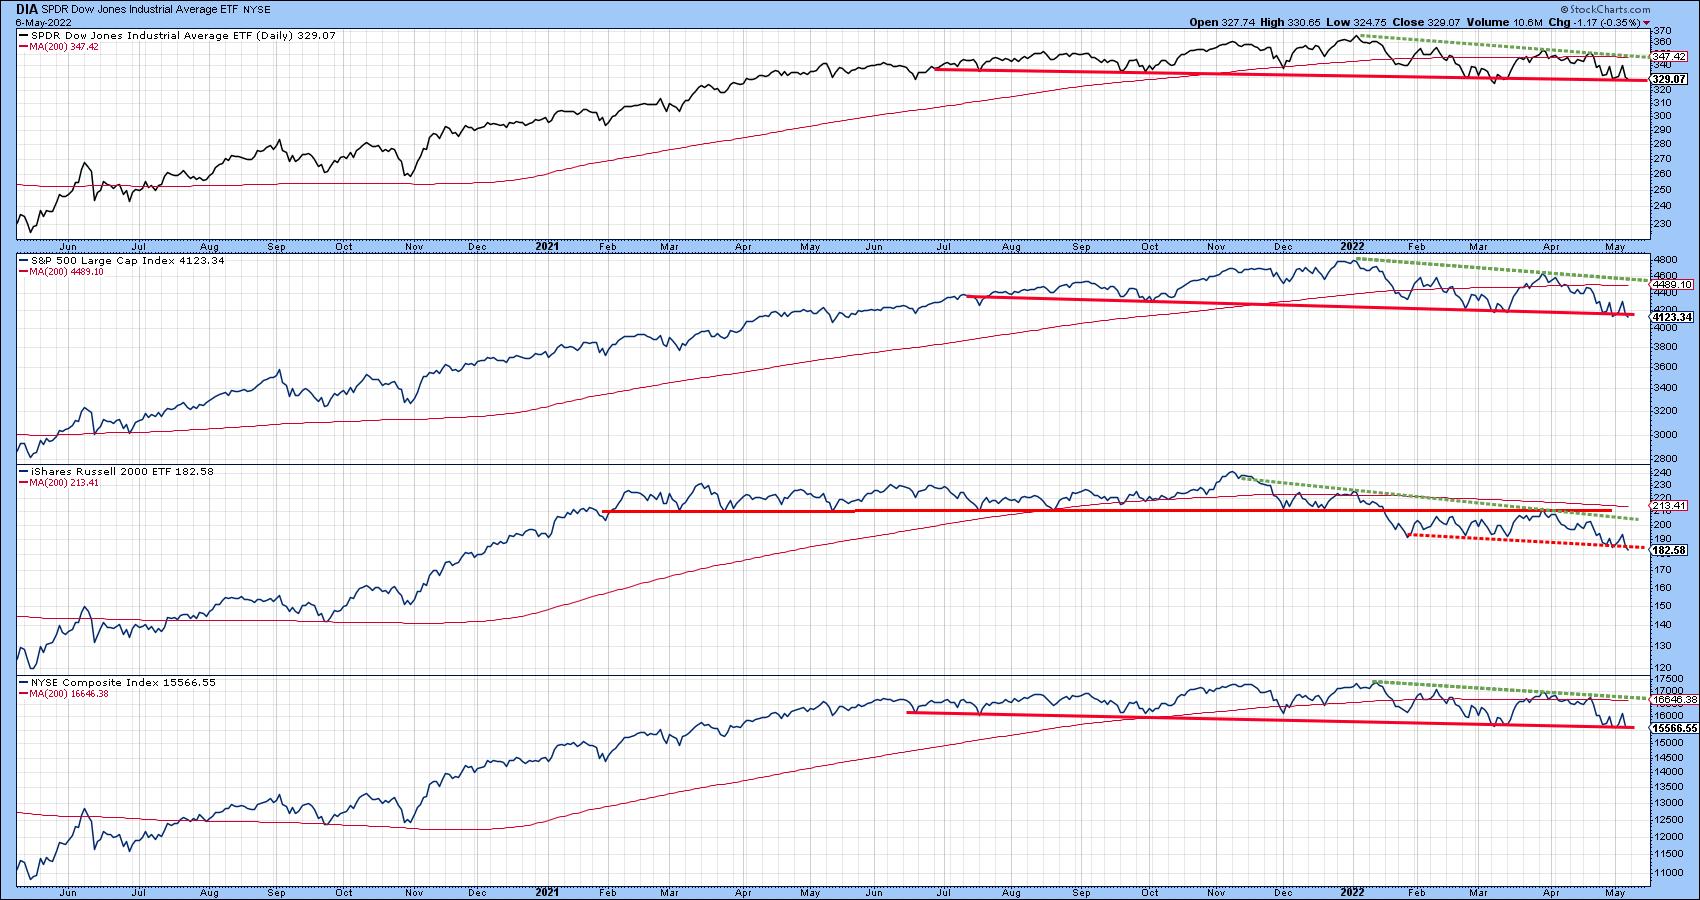
The Stock Market May be on the Edge of a Cliff, But This Chart Says It May Not Fall Off
by Martin Pring,
President, Pring Research
Chart 1 reflects the fact that some market averages are on the edge of a cliff, in the form of major support trendlines marking the lower edges of potential top formations. Another, such as the Russell 2000, has already completed a top and is edging below a subsequent trading range....
READ MORE
MEMBERS ONLY
It's Not What the Fed Does, But How the Market Reacts to its Decision, That Counts
by Martin Pring,
President, Pring Research
I'll get to the Fed element later, but, first, a few words on the Dow Jones Global Stock Index. Chart 1 shows that it has been experiencing a series of declining peaks and troughs since last November. That's not a bullish sign. Neither is the fact...
READ MORE
MEMBERS ONLY
Yields May Be Peaking for a While
by Martin Pring,
President, Pring Research
A few weeks ago, I wrote a piece entitled "The Fed Raises Rates; What if it's Already Priced into the Market?". The idea was to point out that the Fed is a lagging indicator and that multiple bond yields had already reached mega resistance in the...
READ MORE
MEMBERS ONLY
Does Recent Stock Market Action Indicate a Recession?
by Martin Pring,
President, Pring Research
I've been reading and hearing a lot about an impending recession, which reminds me of the saying that, when everyone thinks alike, everyone is usually wrong. That's not to say everyone is expecting a recession, but we may have reached a point where there is sufficient...
READ MORE
MEMBERS ONLY
Has the Bitcoin Bubble Burst?
by Martin Pring,
President, Pring Research
In early December of last year, I wrote an articleon whether Bitcoin had reached the tipping point in terms of signaling a peak in the crypto bubble. Some may disagree about the "bubble" label; however, it seems to me that a financial category coming out of nowhere 10-years...
READ MORE
MEMBERS ONLY
Has the Bitcoin Bubble Burst?
by Martin Pring,
President, Pring Research
In early December of last year, I wrote an article on whether Bitcoin had reached the tipping point in terms of signaling a peak in the crypto bubble. Some may disagree about the "bubble" label; however, it seems to me that a financial category coming out of nowhere...
READ MORE
MEMBERS ONLY
Watch this Market for a Huge Potential Upside Breakout
by Martin Pring,
President, Pring Research
At the turn of the century, this ETF achieved a ten-timer, rallying from $4 in 2002 to $40 in 2008. It's been consolidating for the last 12 years and looks set to embark on a move to new all-time highs. It's not a tech stock, nor...
READ MORE
MEMBERS ONLY
The Fed Raises Rates; What If it's Already Priced into the Market?
by Martin Pring,
President, Pring Research
Markets discount the future, so if the Fed tells the market it's going to raise rates, it goes ahead and raises them anyway. Why wait on the railroad tracks when you know a train is coming? Ironically, the widely-telegraphed rate rise has arrived at a time when bond...
READ MORE
MEMBERS ONLY
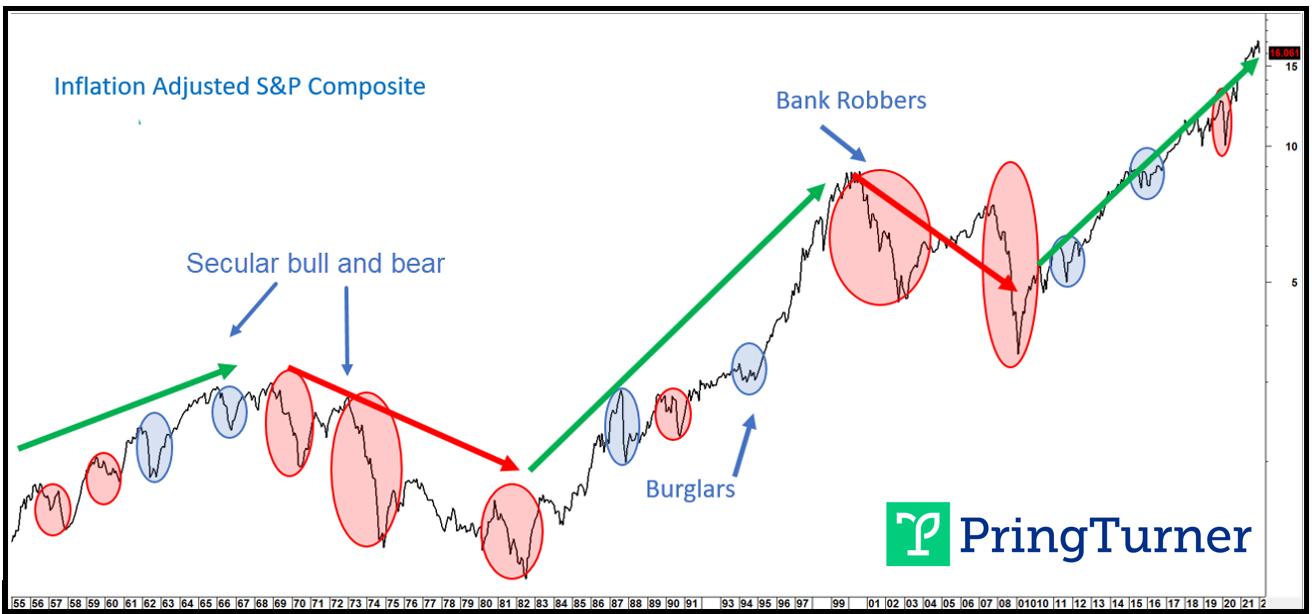
Burglar or Bank Robber? Time to Watch Your Wallet and Stock Portfolio!
by Martin Pring,
President, Pring Research
In October 2021, we made the case for a new secular commodity bull marketand concluded that this environment would likely spill back into the economy and stock market. That process is already underway, as the NASDAQ Composite was recently down 20% from its high, compared to a drop of 12%...
READ MORE
MEMBERS ONLY
Three Intermarket Relationships that are Forecasting Higher Stocks and Yields
by Martin Pring,
President, Pring Research
Changing relationships between differing asset classes and markets do not speak that often. When they do, strong evidence that important changes may be afoot is often provided. One of the characteristics that has caught my attention since the beginning of the year is that, on one side, stocks been reacting...
READ MORE
MEMBERS ONLY
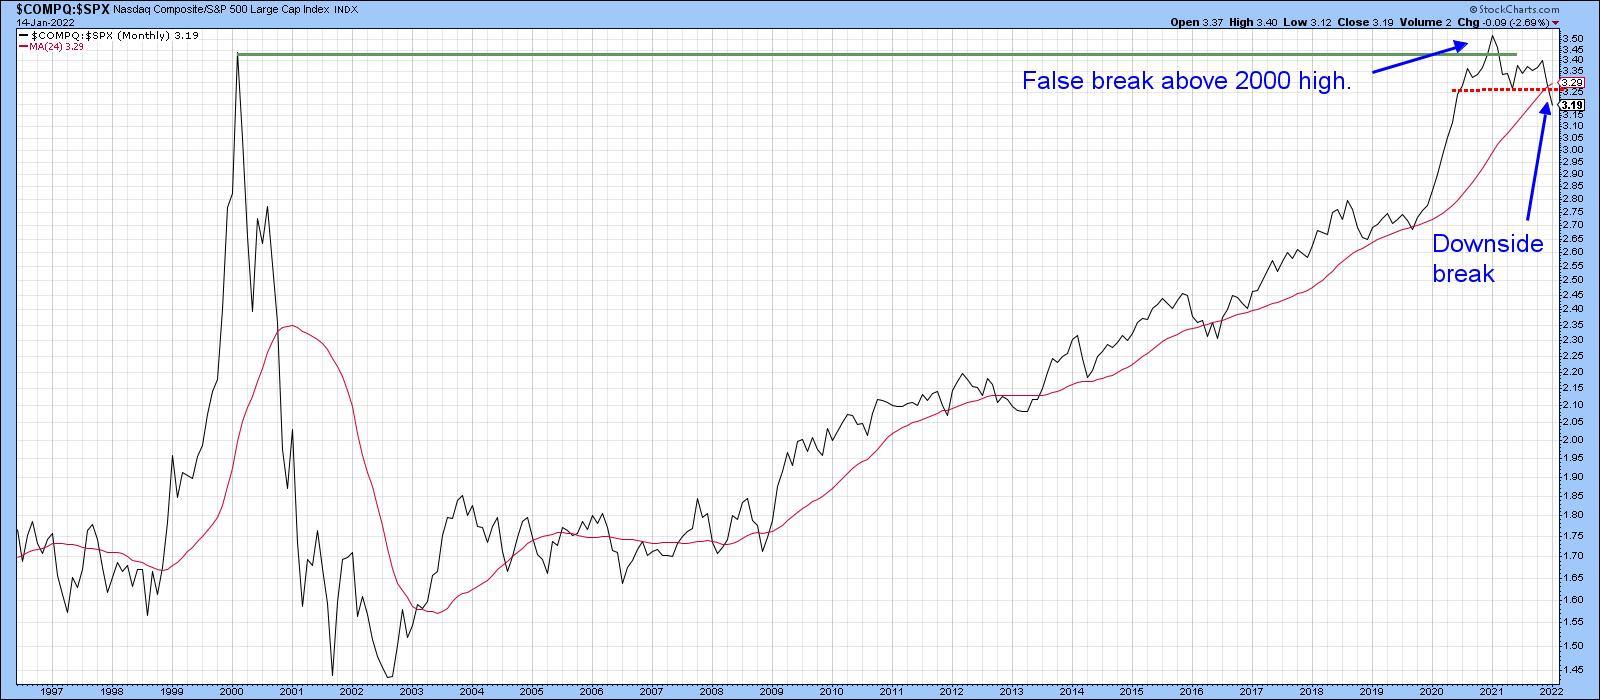
Don't Be Surprised if the NASDAQ Jumps from Here
by Martin Pring,
President, Pring Research
I've been bearish on the NASDAQ -- or, more specifically, on its relative action against the S&P Composite -- for about a year. Now that the financial press has announced that the Index, by virtue of passing the somehow magic -20% level, has "entered bear...
READ MORE
MEMBERS ONLY
A Tale of Two Sectors
by Martin Pring,
President, Pring Research
The Business Cycle and Sector Rotation
The business cycle undergoes a set series of chronological events which are also related to primary trend peaks in bonds stocks and commodities, as laid out in Figure 1. You can read about this concept in greater detail here. Based on the position of...
READ MORE
MEMBERS ONLY
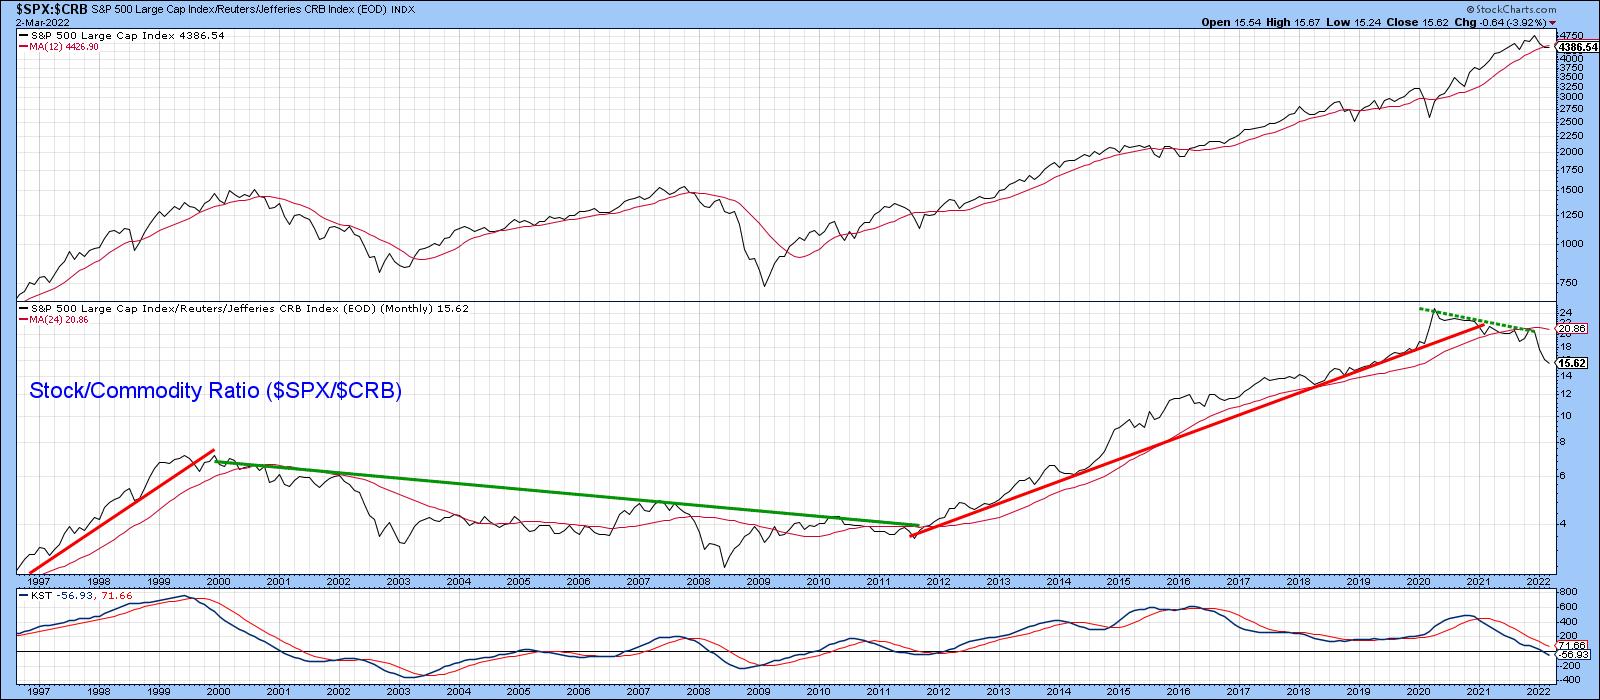
Three Implications if Commodities Outperform Stocks
by Martin Pring,
President, Pring Research
Chart 1 shows that, starting in early 2020, stocks began to slowly but quietly underperform commodities. Since the start of this year, though, this trend has begun to really accelerate on the downside, i.e. moving in favor of commodities. The center window also shows that, when a lengthy trendline...
READ MORE
MEMBERS ONLY
Three Implications if Commodities Outperform Stocks
by Martin Pring,
President, Pring Research
Chart 1 shows that, starting in early 2020, stocks began to slowly but quietly underperform commodities. Since the start of this year, though, this trend has begun to really accelerate on the downside, i.e. moving in favor of commodities. The center window also shows when a lengthy trendline of...
READ MORE
MEMBERS ONLY
Major Top or Double Bottom?
by Martin Pring,
President, Pring Research
In a recent late January article,I pointed out that many market averages had fallen to key support levels at a time when a lot of them were experiencing selling climaxes. This kind of condition is usually followed by a rally or basing period, but I also noted that other...
READ MORE
MEMBERS ONLY
Gold Breaks Out for the Fourth Time in the Past Year -- But is it for Real this Time?
by Martin Pring,
President, Pring Research
Since its August 2020 high, gold has been a very tricky market to call. Let me put it another way; it has been easy to call, but exasperatingly difficult to call correctly because of the numerous false breakouts that have taken place in the last 18 months-or-so. Monday's...
READ MORE
MEMBERS ONLY
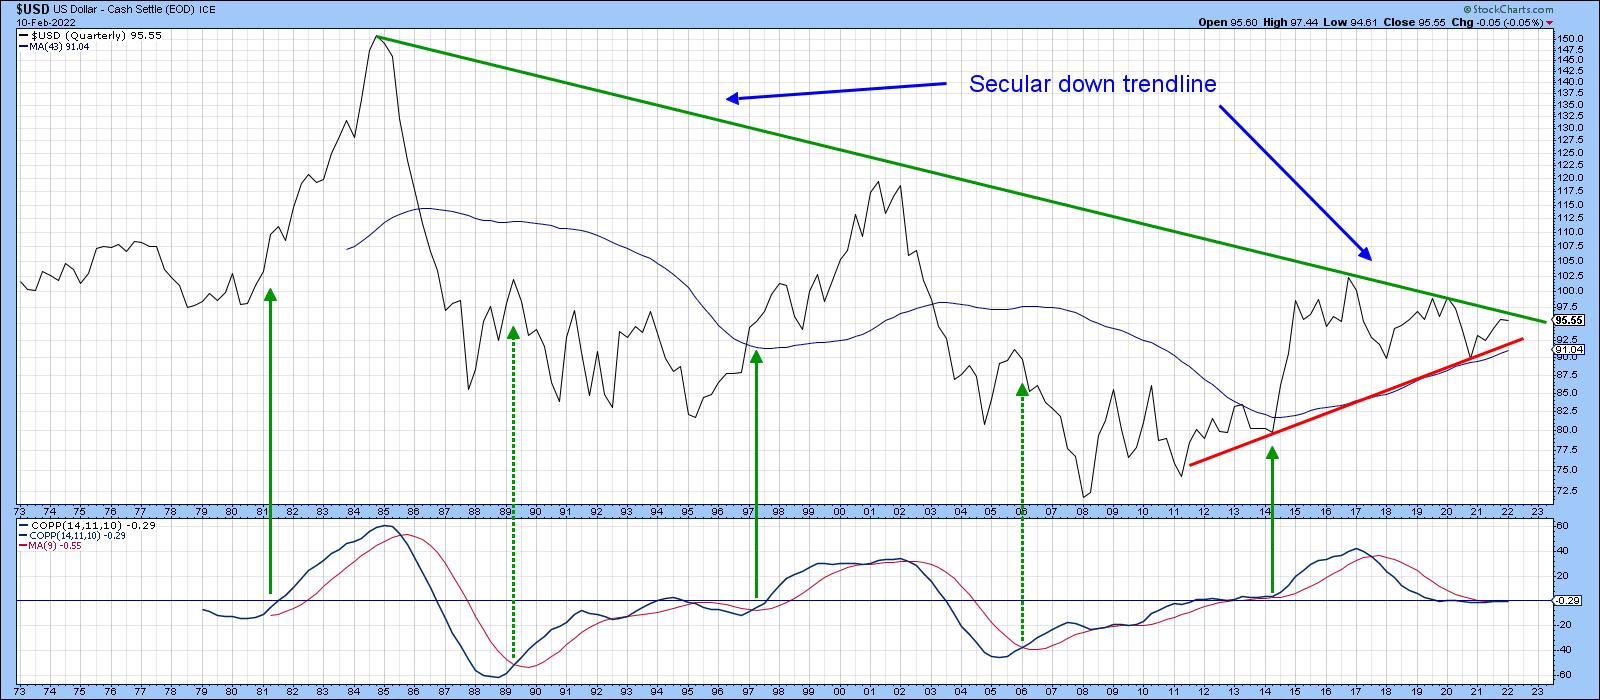
The Effect of this Bearish Weekly Two-Bar Reversal is About to Test the Bull Market Case for the Dollar Index
by Martin Pring,
President, Pring Research
Before we look at the two-bar reversal, let's first review the long-term technical position for the Dollar Index. It's laid out on a quarterly basis in Chart 1, along with a Coppock momentum indicator. The first thing to note is that the Index is positioned below...
READ MORE
MEMBERS ONLY
Examining the Monthly Bar Charts for a Possible Reversal
by Martin Pring,
President, Pring Research
Usually, when we are identifying one or two bar price patterns or candlesticks, it's because they appear close to a turning point, thereby giving us a trading edge. From a practical point of view, it makes sense to observe daily or intraday price action. That's because...
READ MORE
MEMBERS ONLY
Some Indexes Break Down from Major Price Patterns: Selling Climaxes Offer Hope!
by Martin Pring,
President, Pring Research
I am a great believer in the principle of false breaks being followed by above-average moves in the opposite direction to the break. It happens because those who bought on it are caught on the wrong side of the market and are forced to re-position themselves, just as correctly positioned...
READ MORE
MEMBERS ONLY
Two Market Segments That Look Set for a Big Move
by Martin Pring,
President, Pring Research
Recently, I have been drawn to two specific-but-unrelated areas of market activity. Both are experiencing an extremely fine balance between buyers and sellers and, as a result, are likely to experience a big move in one direction or the other. These are the copper price and small cap stocks. Let&...
READ MORE
MEMBERS ONLY
What Do Staples, Energy and Financials Have in Common?
by Martin Pring,
President, Pring Research
Technology outperformed throughout the second decade of this century, but the times they are a-changin', as it is obvious that this sector has lost enough mojo in the last year to indicate that a basic transformation in market leadership is underway. Just to be clear, I am not saying...
READ MORE
MEMBERS ONLY
What Do Staples, Energy and Financials Have in Common?
by Martin Pring,
President, Pring Research
Technology outperformed throughout the second decade of this century, but the times they are a-changin', as it is clear that this sector has lost enough mojo in the last year to indicate that a basic transformation in market leadership is underway. Just to be clear, I am not saying...
READ MORE
MEMBERS ONLY
Yields Breaking or About to Break Out All Over
by Martin Pring,
President, Pring Research
I had thought that rates would moderate a little at the beginning of 2022, as the economic growth rate slowed due to COVID and other factors. Not so, as yields across the spectrum have resumed their bull market rally in anticipation of higher inflation and a less accommodative central bank....
READ MORE
MEMBERS ONLY
Two Intermarket Relationships Worth Monitoring for Early 2022
by Martin Pring,
President, Pring Research
Last week, I pointed out three charts that had triggered bullish signals and suggested that these characteristics were strong enough to power the market higher. Prices immediately sold off, but have subsequently rebounded. Since those charts are still positive, I am sticking to the higher market over the next 2-4...
READ MORE
MEMBERS ONLY
Three Charts That Suggests This Rally Has Legs.... For the Time Being
by Martin Pring,
President, Pring Research
A lot of indicators, such as the percentage of NYSE stocks above their 200-day MA and the NYSE bullish percentage, remain in confirmed downtrends that will take time to reverse. However, some of the shorter-term charts that have proved reliable in the past have just begun to offer some bullish...
READ MORE
MEMBERS ONLY
Is Dr. Copper About to Make a Diagnosis?
by Martin Pring,
President, Pring Research
The copper price is reputed to have a "Ph.D. in economics" because of its ability to predict turning points in the global economy. That role is justified due to copper's widespread use in most sectors of the economy, from homes and factories to electronics, power...
READ MORE
MEMBERS ONLY
Does Last Week's Bitcoin Sell-Off Signal a Bear Market?
by Martin Pring,
President, Pring Research
According to CoinGecko, total crypto market capitalization, which came from almost nothing 10 years ago, stood at $3 trillion in early November. To put that in perspective, total US GDP currently stands at $23 trillion, so, at its recent high, global crypto was worth 13% of US GDP and more...
READ MORE
MEMBERS ONLY
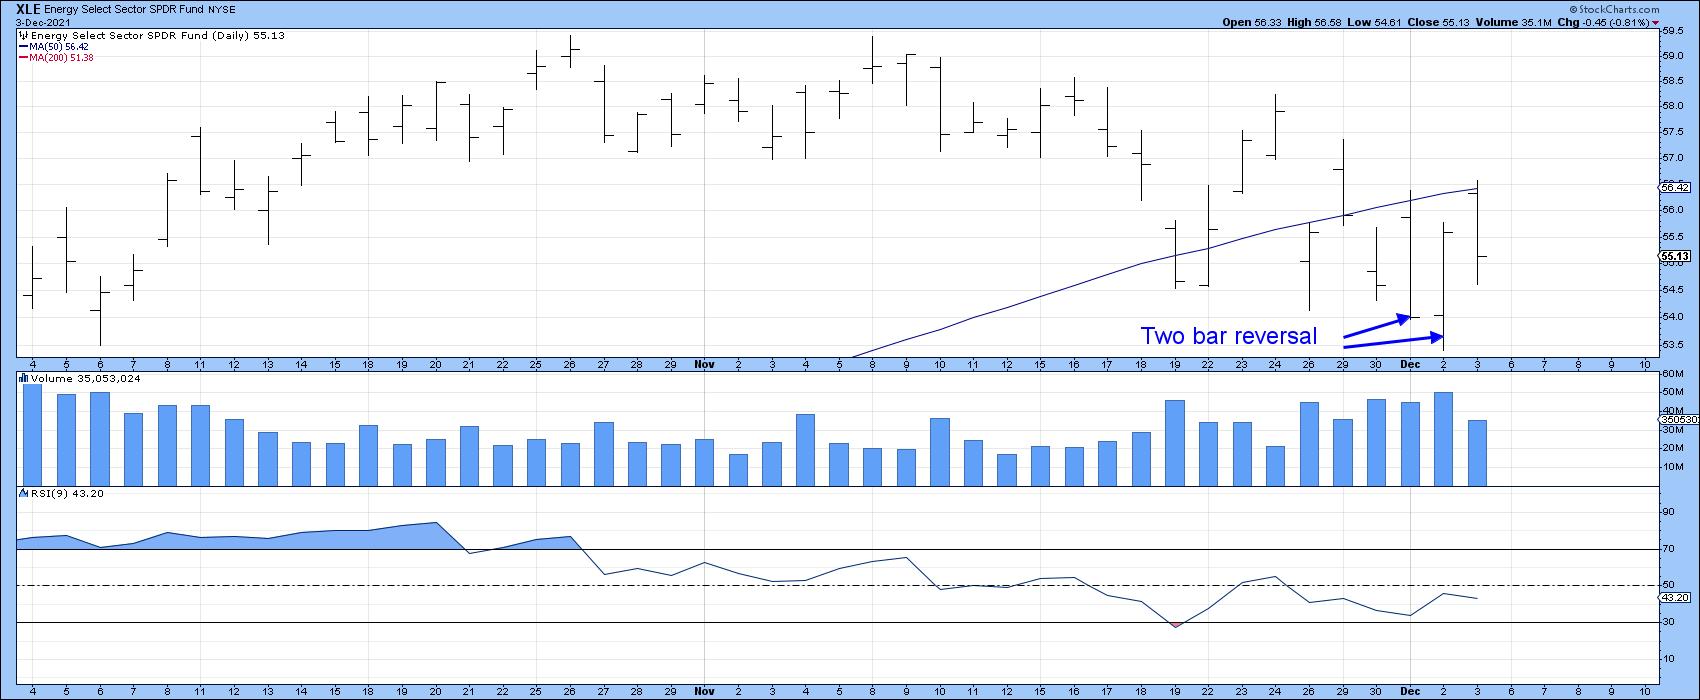
Bullish Two-Bar Reversal Patterns Suggest a Temporary Bottom for Some Sectors -- and Maybe the Market Itself
by Martin Pring,
President, Pring Research
Thursday's action was quite positive for several sectors, as they experienced positive two-day price formations. These patterns are only of a short-term nature and usually have an effect for between 5 and 10 days, so they do not represent major signals. However, since this action is coming off...
READ MORE
MEMBERS ONLY
Bullish Two-Bar Reversal Patterns Suggest a Temporary Bottom for Some Sectors -- and Maybe the Market Itself
by Martin Pring,
President, Pring Research
Thursday's action was quite positive for several sectors, as they experienced positive two-day price formations. These patterns are only of a short-term nature and usually have an effect for between 5- and 10-days, so they do not represent major signals. However, since this action is coming off an...
READ MORE
MEMBERS ONLY
Key Index Experiences a Bearish Outside Day: Could There Be More Downside to Come?
by Martin Pring,
President, Pring Research
One piece of Monday's market action that really stood out to me was a bearish outside day in the NASDAQ, as shown in Chart 1. A classic outside day develops after a persistent short-term rally and signals a short-term reversal in sentiment. The outside part refers to the...
READ MORE
MEMBERS ONLY
After Seven Months of Consolidation Food Prices are Starting to Resume their Advance
by Martin Pring,
President, Pring Research
The Invesco DB Agricultural Fund (DBA) consists of grains (37%), softs (sugar, coffee and cocoa; 35%) and livestock (24%). A small allocation is also given to cotton. Chart 1 shows that this ETF began a bull market back in the spring of last year. Late 2020 also saw it break...
READ MORE