MEMBERS ONLY
Watch the Metal; It May Soon Be Time to Pedal
by Martin Pring,
President, Pring Research
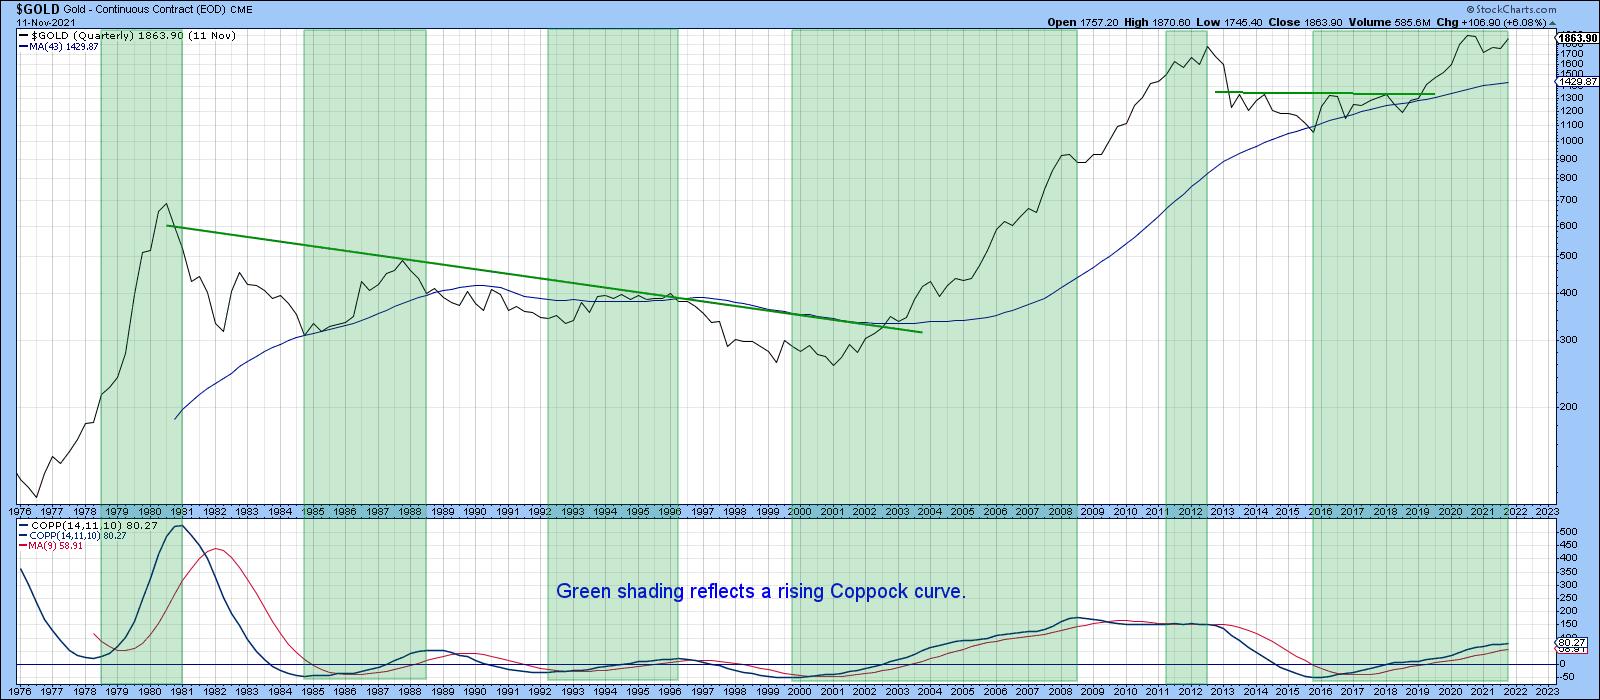
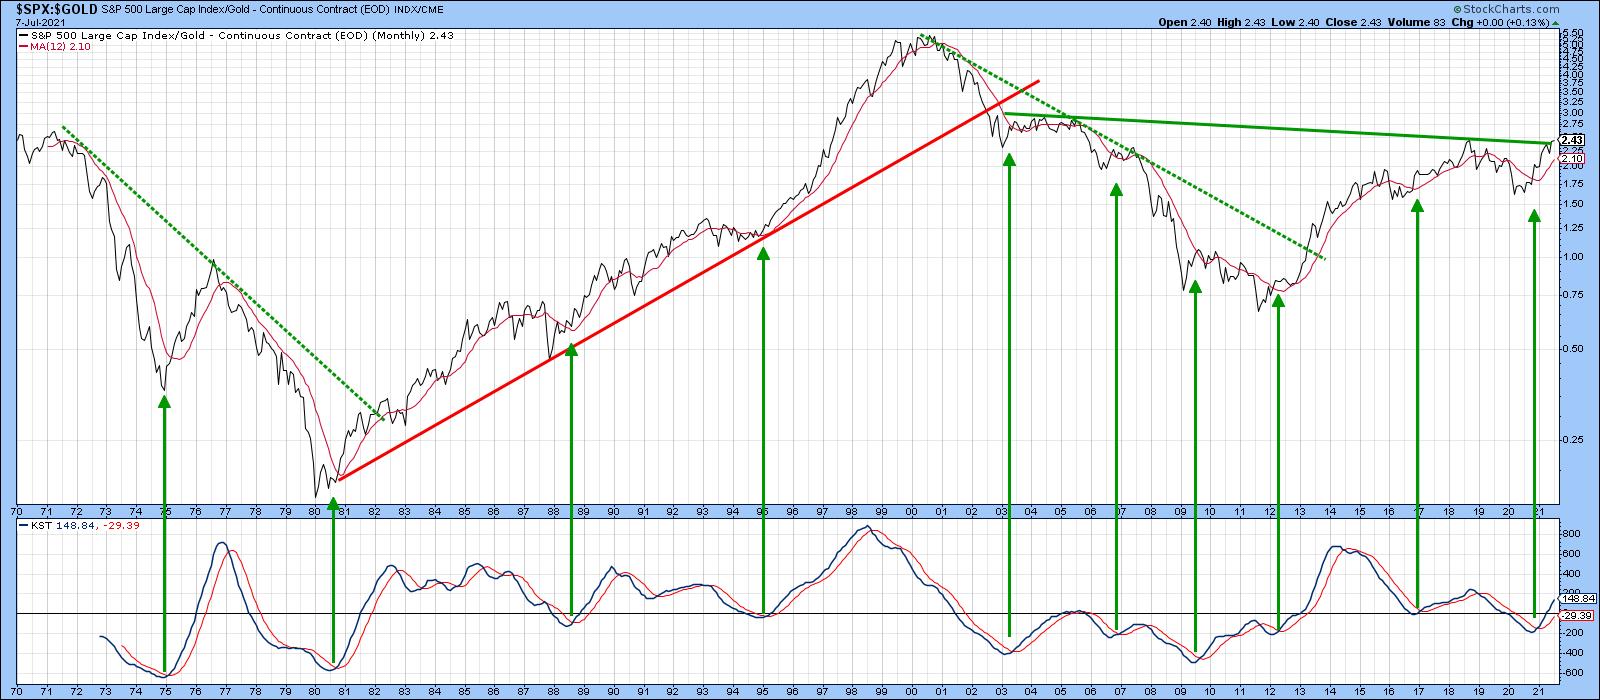
The gold price zig-zagged its way down between August of last year and April of this one. Since then, it's really been in a trading range and now looks as if it is breaking out.
I'll start off by taking a look at the longer-term picture....
READ MORE
MEMBERS ONLY
Watch the Metal; It May Soon be Time to Pedal
by Martin Pring,
President, Pring Research
The gold price zig-zagged its way down between August of last year and April of this one. Since then, it's really been in a trading range and now looks poised to break out. Whether it will or not is another question that only the market can decide.
I&...
READ MORE
MEMBERS ONLY
The S&P is at New Highs: Now What, Especially for Small Caps?
by Martin Pring,
President, Pring Research
The major averages have recently been scoring new highs for the year, strongly hinting that the post-May correction has run its course. So where do we go from here? Is the market overbought and likely to digest recent gains, or is a rally into the bullish year-end period a better...
READ MORE
MEMBERS ONLY
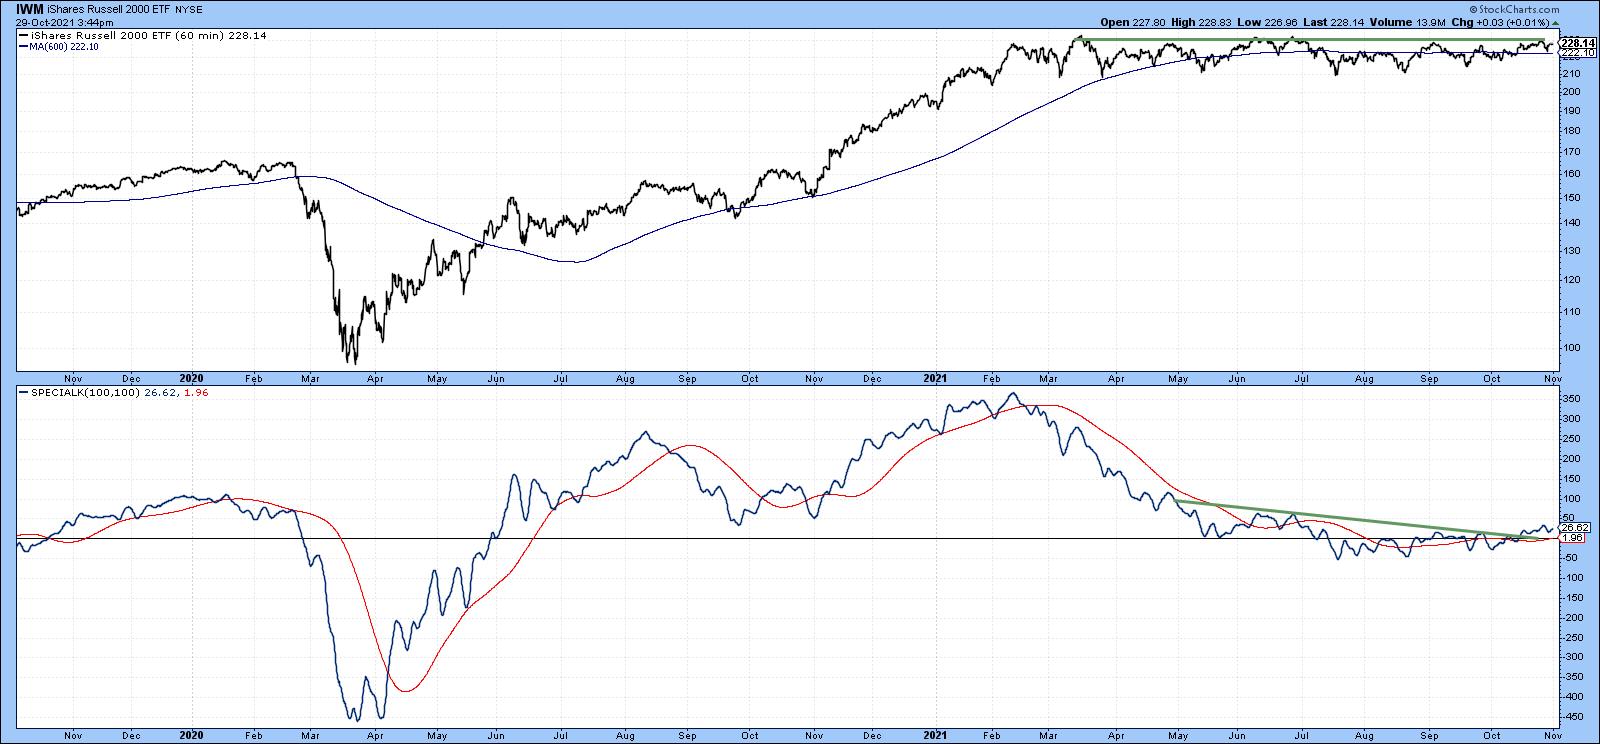
Identifying Intermediate Buying Opportunities with the Hourly Special
by Martin Pring,
President, Pring Research
Sometimes, when I mess around with the charts, I discover an entirely new approach that I had not thought of before. Last week saw one of those breakthrough moments when, for the first time ever, I applied the Special K to hourly charts and came up with some interesting results....
READ MORE
MEMBERS ONLY
Which Asset Class is Likely to Outperform Going Forwards?
by Martin Pring,
President, Pring Research
The business cycle undergoes a set series of chronological sequences, just like the calendar year goes through seasons. Over the course of many decades, economists have recognized this phenomenon and devised composite indicators to follow this progression. By way of an example, the Conference Board publishes leading, coincident and lagging...
READ MORE
MEMBERS ONLY
Impending Super Cycle Commodity Signal Argues Against Transitory Inflation
by Martin Pring,
President, Pring Research
Aging demographics, technological innovation and an ever-expanding debt overhang are three reasons why inflation has been largely kept under wraps in the last three decades. They are still relevant, so why not extrapolate a benign inflation trend into the future?
One reason might lie in the Fed's extraordinary...
READ MORE
MEMBERS ONLY
There is a Pretty Good Chance the Correction is Over
by Martin Pring,
President, Pring Research
The S&P peaked in early September, but most other major averages and many internal indicators of breadth have been rangebound since March. Price action this week, though, suggests that there is a good chance this corrective process has run its course and we will see significant new highs...
READ MORE
MEMBERS ONLY
Using the Special K to Analyze the Dollar
by Martin Pring,
President, Pring Research
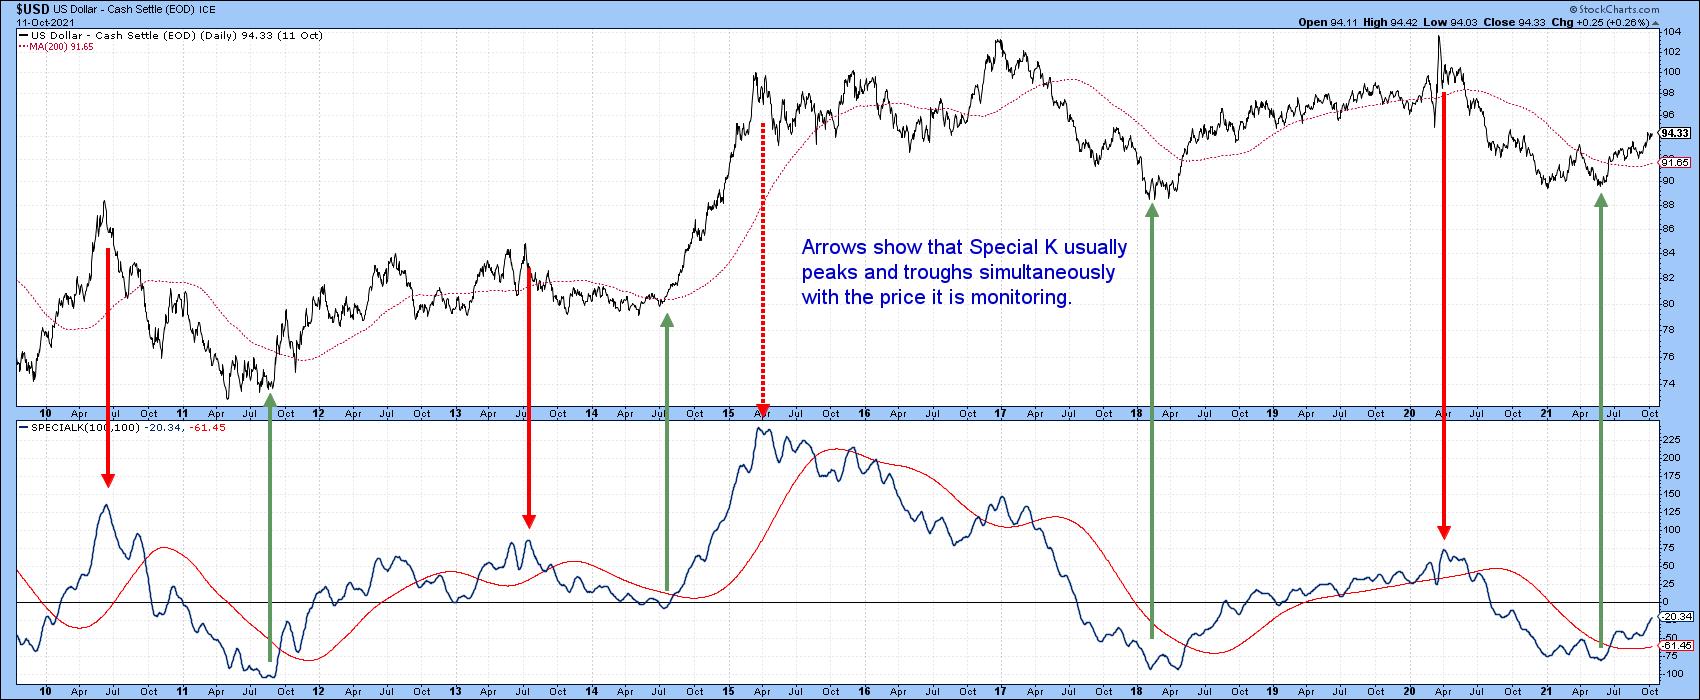
One of my favorite indicators is the Special K. It does not speak to us very often, but when it does, it's usually pretty reliable. I'll outline a few principles below, but for further reading, look hereandhere.
The Special K, or SPK, recognizes the fact that...
READ MORE
MEMBERS ONLY
This Sector is Likely to Outperform the NASDAQ in a Major Way
by Martin Pring,
President, Pring Research
Back in AprilandMay, I wrote about the possibility that the tech-dominated NASDAQ had begun to lose its mojo. The argument was based more on relative action than the absolute price, as I was, and still am, bullish on the primary trend.
Recent NASDAQ Underperformance is Likely to Extend
Chart 1...
READ MORE
MEMBERS ONLY
Step Aside Chairman Powell, Mr. Market is Tightening for You
by Martin Pring,
President, Pring Research
Last week, the Fed announced that tapering is likely to begin later in the year, to be later followed by a leisurely hike in rates. As usual, those pesky impatient markets have decided to raise rates now rather than wait for the clobbering they know they will get later. It...
READ MORE
MEMBERS ONLY
Commodities Experience a False Upside Breakout -- Or Did They?
by Martin Pring,
President, Pring Research
Earlier in the month, I pointed out that the long-term indicators for commodities were still bullish, but getting overbought. At the same time, several intermarket relationships were signaling danger, which suggested some degree of vulnerability. Prices have not moved very much since then, but, bearing in mind that overstretched technical...
READ MORE
MEMBERS ONLY
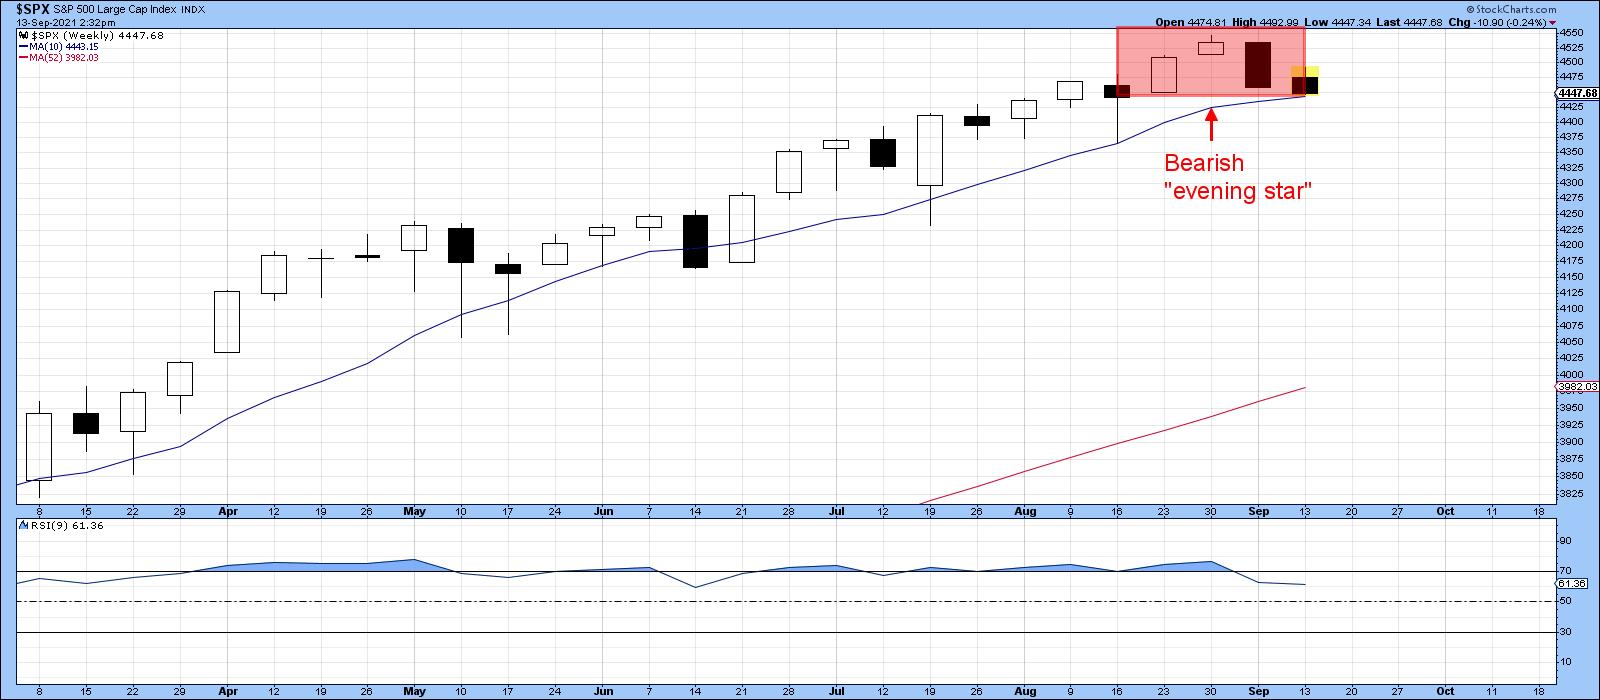
Several Indicators are Shaping Up for a Counter-Cyclical Correction
by Martin Pring,
President, Pring Research
Most of the time, the charts I plot are constructed from daily data. As a result, the necessary perspective provided by weekly ones often gets overlooked. By way of a remedy, I decided, some time ago, to create chartlists for key markets featuring weekly high low close and candlestick arrangements....
READ MORE
MEMBERS ONLY
Nine Country ETFs That are Starting to Emerge
by Martin Pring,
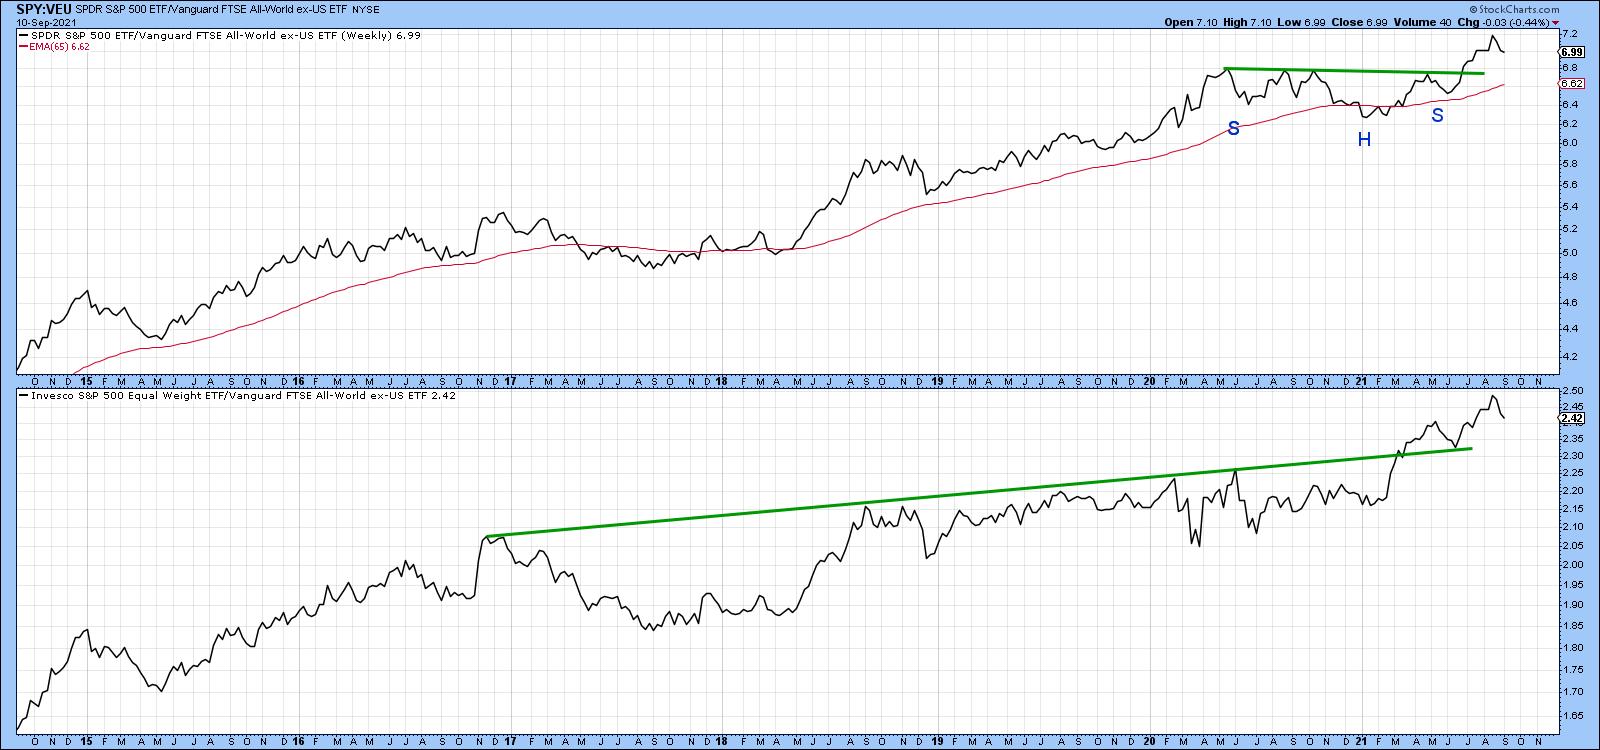
President, Pring Research
Chart 1 shows that the US stock market is in a long-term uptrend relative to the rest of the world. The upper window compares the S&P to the Vanguard All-World ex-US ETF and indicates a recent breakout from a consolidation reverse head-and-shoulders. The lower panel substitutes the S&...
READ MORE
MEMBERS ONLY
Nine Country ETFs That are Starting to Emerge
by Martin Pring,
President, Pring Research
Chart 1 shows that the US stock market is in a long-term uptrend relative to the rest of the world. The upper window compares the S&P to the Vanguard All-World ex-US ETF and indicates a recent breakout from a consolidation reverse head-and-shoulders. The lower panel substitutes the S&...
READ MORE
MEMBERS ONLY
Several Intermarket Relationships are Signaling Danger for Commodities
by Martin Pring,
President, Pring Research
When considered in their own right, commodities, as represented by the CRB Composite, are in a primary bull market. Chart 1, for instance, shows that the Index is above its 12- and 24-month moving averages and the long-term KST is also in a bullish trend. That said, this momentum indicator...
READ MORE
MEMBERS ONLY
Dollar Index Breakout Trick or Treat?
by Martin Pring,
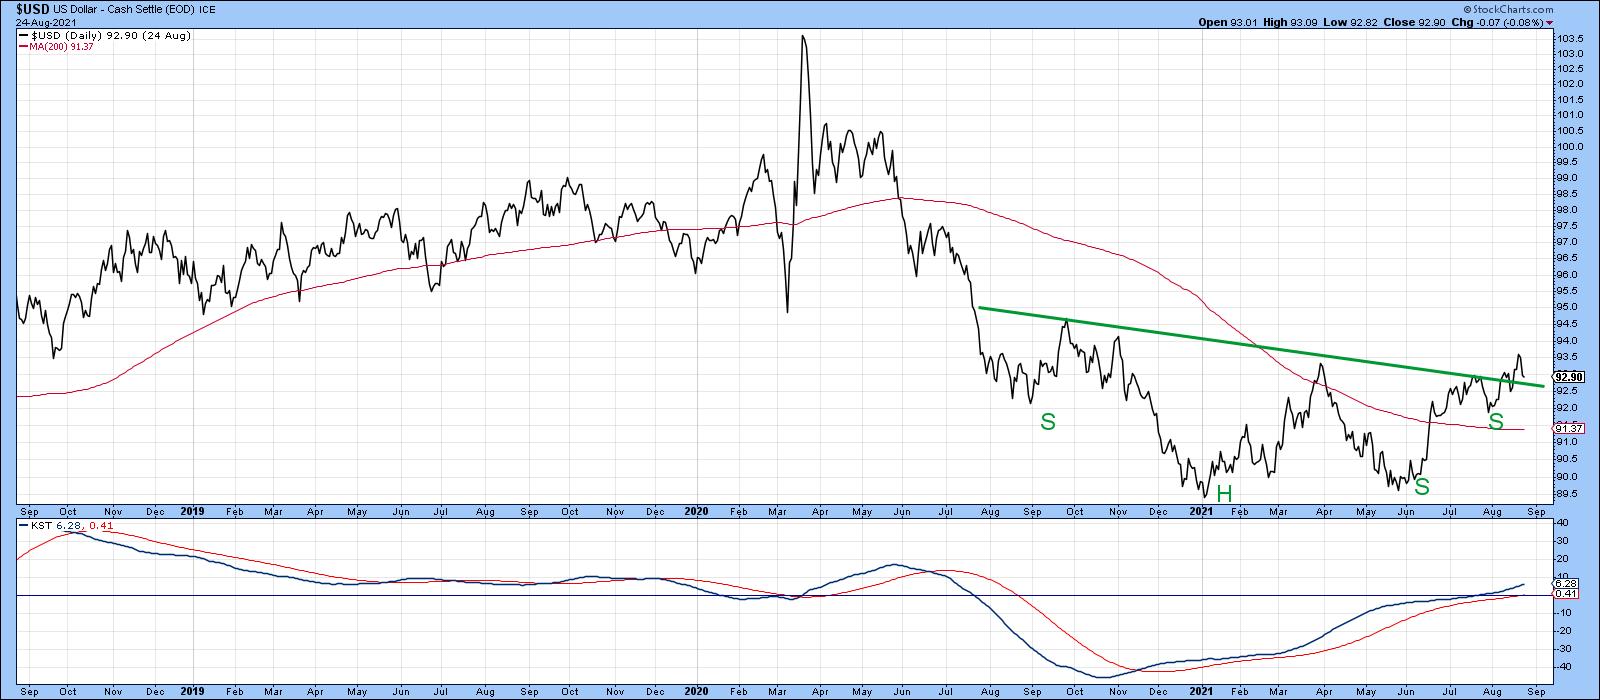
President, Pring Research
Back in June, I wroteabout the possibility that a major reversal in the dollar could be underway, but that certain things had to happen before we could come to a firm conclusion. One of those conditions was a Dollar Index daily close above 93.5, as that would complete what...
READ MORE
MEMBERS ONLY
Michigan Consumer Sentiment Drops 13.5% in July; What Does that Mean for US Equities?
by Martin Pring,
President, Pring Research
Last Friday (August 13), the University of Michigan released the initial August response to their consumer sentiment survey. A sharp 13.5% retreat was recorded. The Expectations Index fared even worse, with a 17.5% drop. According to the summary report, only six of these monthly surveys since the late...
READ MORE
MEMBERS ONLY
Michigan Consumer Sentiment Drops 13.5% in July; What Does that Mean for US Equities?
by Martin Pring,
President, Pring Research
Last Friday, the University of Michigan released the initial August response to their consumer sentiment survey. A sharp 13.5% retreat was recorded. The Expectations Index fared even worse with a 17.5% drop. According to the summary report, only six of these monthly surveys since the late 1970s have...
READ MORE
MEMBERS ONLY
Which of These Three Leading Commodity Indicators are Forecasting Higher Prices?
by Martin Pring,
President, Pring Research
We hear a lot about inflation these days and have certainly experienced rising grocery bills, as well as runaway used car and housing prices. Commodity prices are often, but certainly not always, a leading indicator for the CPI, but there are three markets that have a useful, though imperfect, record...
READ MORE
MEMBERS ONLY
The Indicators are Mixed. What Does this Contradiction Mean for the Market?
by Martin Pring,
President, Pring Research
This morning, an interesting chart of the S&P Composite authored by Ed Clissold of NDR Research crossed my desk. It can be seen at @NDR_Research. It is a composite of 3 historic cycles: 1-year, 4-year (post-election) and 10-year decennial cycle with an average of years ending in...
READ MORE
MEMBERS ONLY
Bitcoin and Chinese Equities Go their Separate Ways
by Martin Pring,
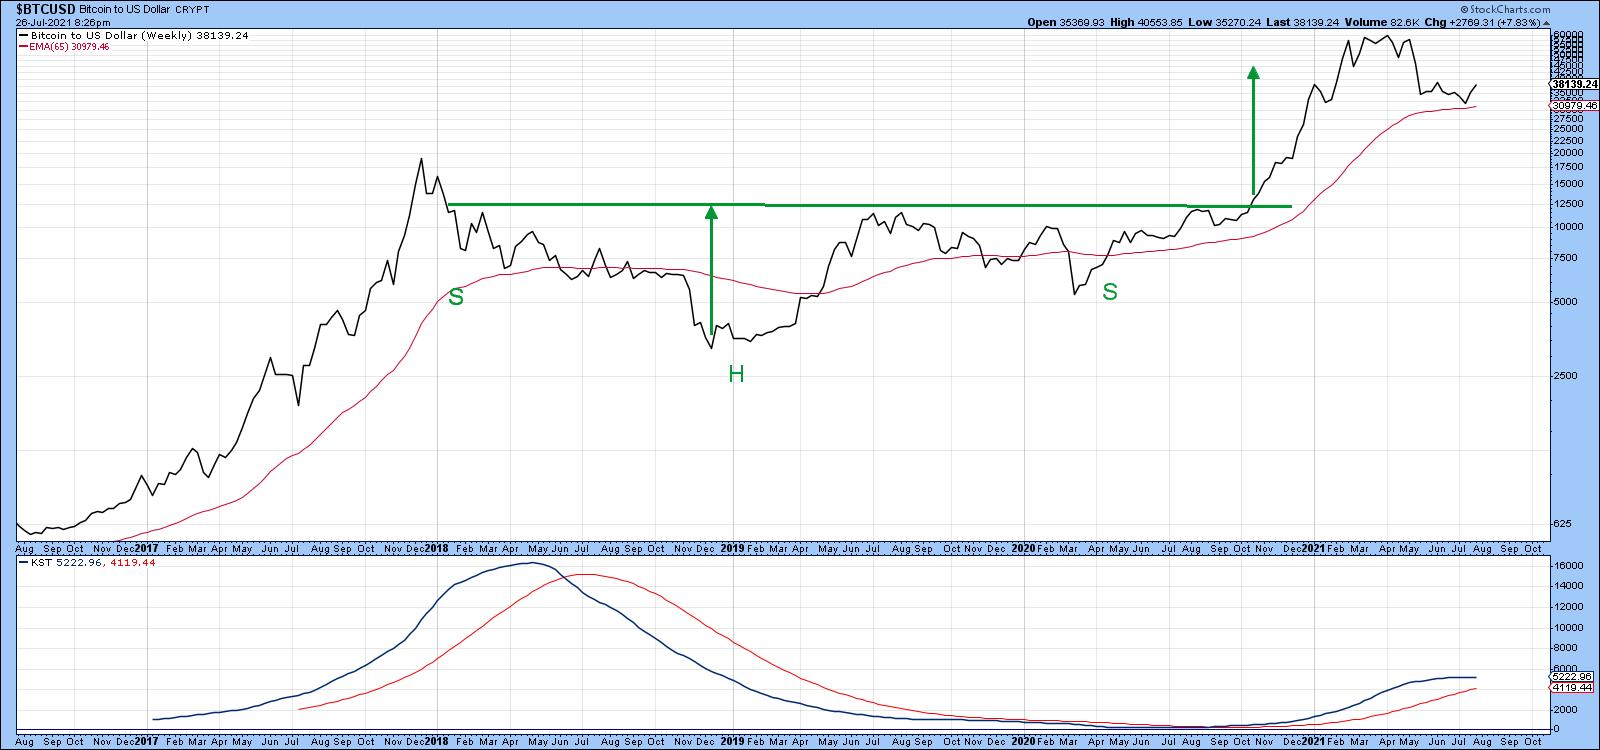
President, Pring Research
After months of quiet frustrating trading, Bitcoin finally broke out to the upside this week. It's too early to say whether this is the beginning of a move to new all-time highs, as lots more backing and filling is probably necessary in order for it to form a...
READ MORE
MEMBERS ONLY
Bitcoin and Chinese Equities Go their Separate Ways
by Martin Pring,
President, Pring Research
After months of quiet frustrating trading, Bitcoin finally broke out to the upside this week. It's too early to say whether this is the beginning of a move to new all-time highs, as lots more backing and filling is probably necessary in order for it to form a...
READ MORE
MEMBERS ONLY
The Correction May Not Be as Bad as You Think
by Martin Pring,
President, Pring Research
The bad news is that a correction is underway and that many indicators and market averages have started to break through key support. The good news is that, internally, corrective activity has been underway for several months. Provided the bull market is still in existence (and there are few grounds...
READ MORE
MEMBERS ONLY
US Breaks Out Against the World as Bonds Fail at 200-day Moving Average
by Martin Pring,
President, Pring Research
The US Breakout
The S&P has been in a secular or very long-term uptrend against the Dow Jones World Stock Index since the financial crisis. That trend is still intact, as the ratio remains above its 2011-2021 up trendline. The primary trend picture is a bit mixed as...
READ MORE
MEMBERS ONLY
Three Intermarket Relationships That are at a Critical Point
by Martin Pring,
President, Pring Research
When reviewing my charts last weekend, several jumped out as being at a pretty critical juncture, and therefore worthy of monitoring going forward. A couple of them involved the stock market, so I'll start there.
Two Stock Market Relationships
I have always been fascinated by the relationship between...
READ MORE
MEMBERS ONLY
What Does a Flattening Yield Curve Mean for Bonds, the Economy and Stocks
by Martin Pring,
President, Pring Research
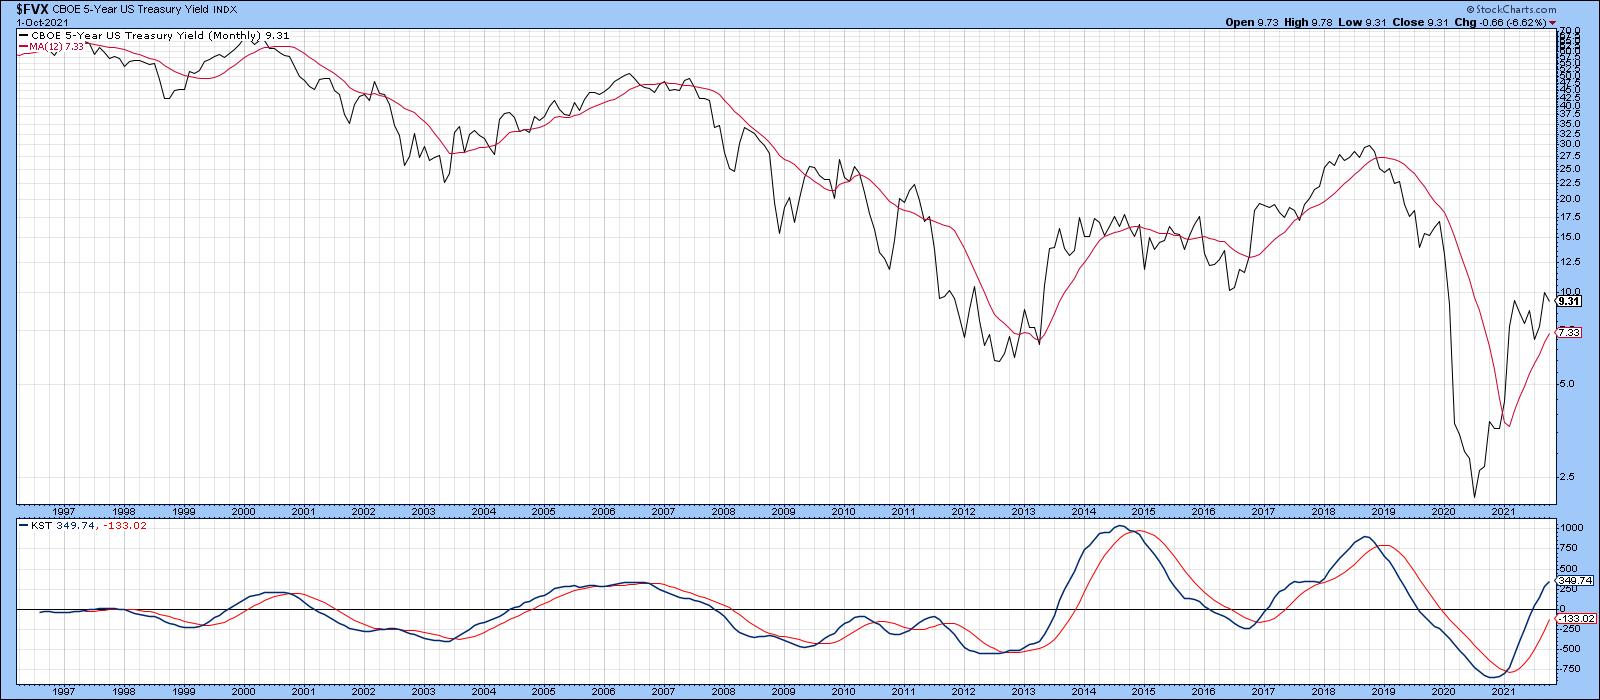
In the last couple of weeks or so, US treasury yield curves have begun to flatten. That may sound unduly technical and boring, but it has implications for bonds stocks and the economy. I'll get to the investment implications later, but for now I'll quickly through...
READ MORE
MEMBERS ONLY
NASDAQ and S&P at a New High, But It's Very Lonely Up There
by Martin Pring,
President, Pring Research
This week saw the NASDAQ and S&P Composites rally to a new high, but not the DJIA, NYSE Composite, Unweighted S&P and Russell 2000. That's not necessarily the kiss of death, as these discrepancies can always be cleared up over time. In any case,...
READ MORE
MEMBERS ONLY
Can Positive Short & Intermediate Indicators for the Dollar Tip Long-Term Balance to the Bullish Side?
by Martin Pring,
President, Pring Research
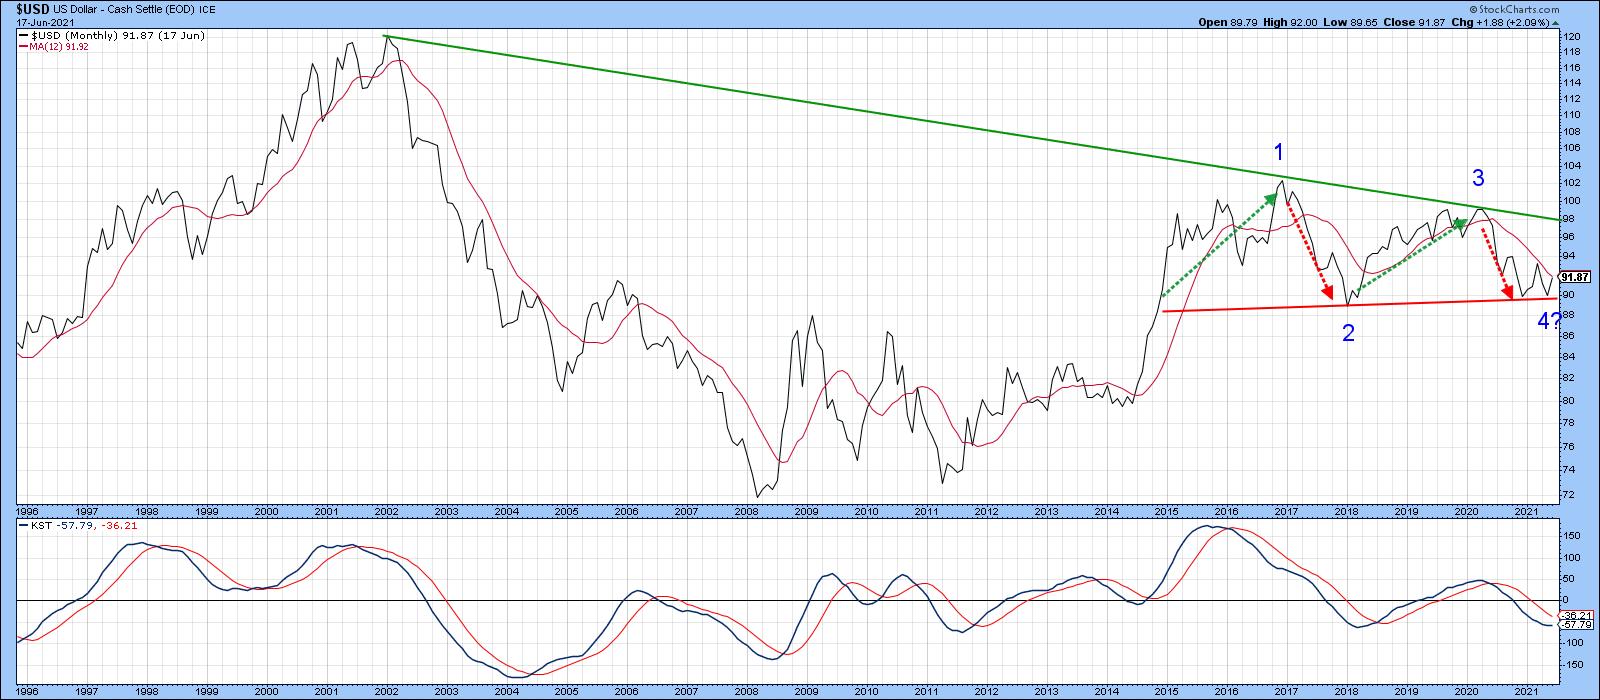
Chart 1 shows that, since 2015, the Dollar Index has been in a narrowing trading range bounded by two converging trendlines. That period has also embraced the end part of the 2011-2016 bull market, a mini-bear and bull market and the current bear. I use the term "bear"...
READ MORE
MEMBERS ONLY
Can Positive Short & Intermediate Indicators for the Dollar Tip Long-Term Balance to the Bullish Side?
by Martin Pring,
President, Pring Research
Chart 1 shows that, since 2015, the Dollar Index has been in a narrowing trading range bounded by two converging trendlines. That period has also embraced the end part of the 2011-2016 bull market, a mini bear and bull market and the current bear. I use the term "bear&...
READ MORE
MEMBERS ONLY
Oil May Be on the Verge of a Major Breakout
by Martin Pring,
President, Pring Research
Last week, I featured three energy-related ETFs as part of an article on the bond market, as they had just broken out on a short-term basis. Chart 1 shows that those breakouts have held so far. This week, though, I'd like to take a deeper dive into the...
READ MORE
MEMBERS ONLY
Bonds at the Crossroad as Energy Breaks to the Upside
by Martin Pring,
President, Pring Research
The Dilemma Between the Long and Short-Ends
Last March, I wrote an articleopining that, while the primary trend was positive, the idea of rising bond yields may have been become too popular for the time being. In the intervening 2 ½-months, yields at the long end have backed off a...
READ MORE
MEMBERS ONLY
I Don't Know If the Correction Will Extend, But Here are Five Charts I'm Watching
by Martin Pring,
President, Pring Research
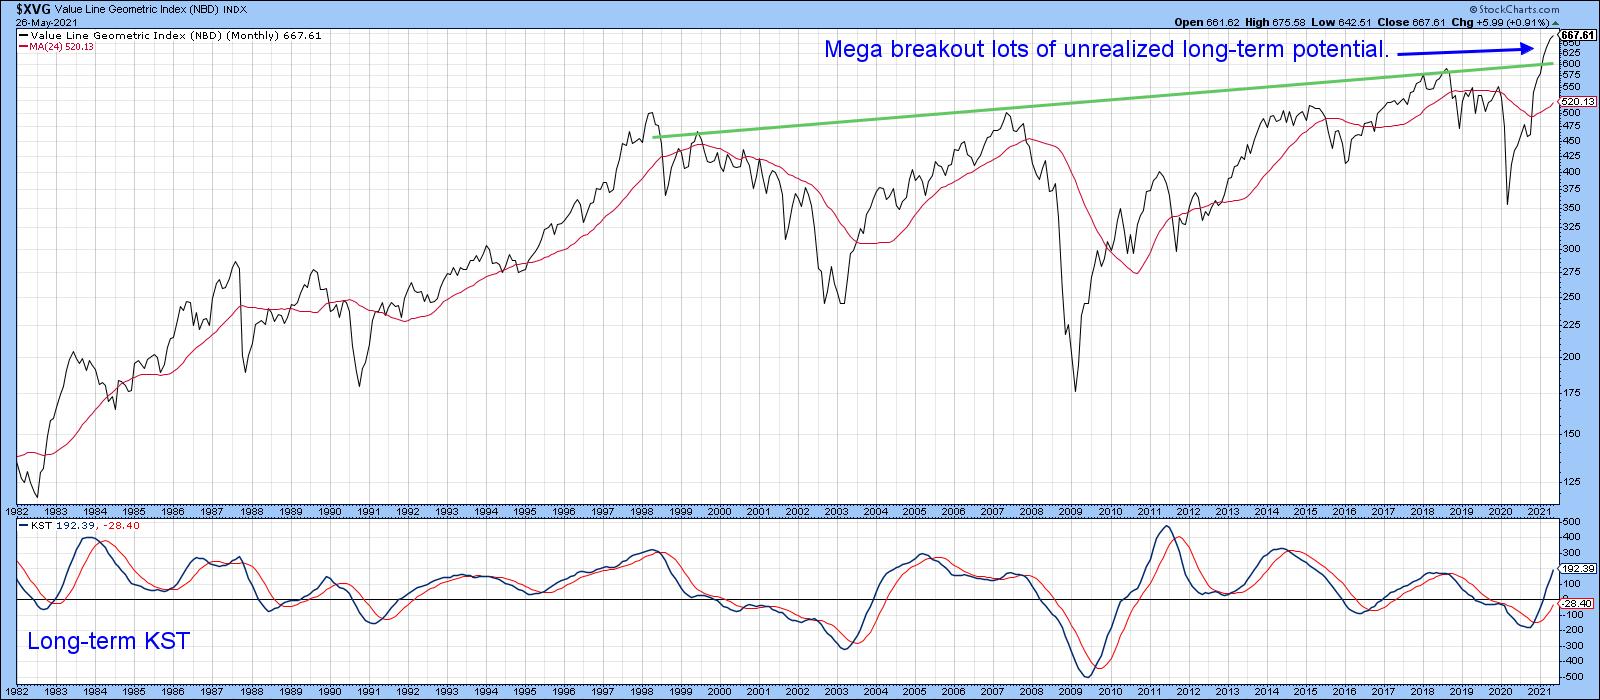
The Big Picture
Before we get into the subject of corrections, it's important to make sure that we do not lose focus on the big picture. For instance, take Chart 1, which features the Value Line Geometric Average. It reflects the performance of the average stock, as opposed...
READ MORE
MEMBERS ONLY
I Don't Know If the Correction Will Extend, But Here are Five Charts I'm Watching
by Martin Pring,
President, Pring Research
The Big Picture
Before we get into the subject of corrections, it's important to make sure that we do not lose focus on the big picture. For instance, take Chart 1, which features the Value Line Geometric Average. It reflects the performance of the average stock, as opposed...
READ MORE
MEMBERS ONLY
Gold Starting to Look Interesting Again
by Martin Pring,
President, Pring Research
Gold has rallied nicely in the last few weeks, so the question naturally arises as to whether it's ready to resume its secular bull market. I'll get to that later, but first, a little perspective.
Longer-Term Perspective
Chart 1 plots the real price as adjusted by...
READ MORE
MEMBERS ONLY
Monday's Falling Dominos May Be Enough to Tip the Short-term Trend to the Downside
by Martin Pring,
President, Pring Research
Many internal short-term indicators are overextended and starting to look vulnerable, but need some kind of a push to tip the near-term technical balance to the bearish side. That push may have been delivered with Monday's action, as several indexes gave the appearance of some selected short-term buyer...
READ MORE
MEMBERS ONLY
Putting Forward a Candidate to Take Over Tech Leadership
by Martin Pring,
President, Pring Research
A couple of weeks ago, I posted an articlequestioning whether the tech-dominated NASDAQ still had the mojo to lead the market higher. At the time, many sub-surface indicators, such as breadth, volume and relative action, looked weak. Several charts indicated that many of them had experienced multiple negative divergences, but...
READ MORE
MEMBERS ONLY
Putting Forward a Candidate to Take Over from Tech Leadership
by Martin Pring,
President, Pring Research
A couple of weeks ago, I posted an article questioning whether the tech-dominated NASDAQ still had the mojo to lead the market higher. At the time, many sub-surface indicators, such as breadth, volume and relative action, looked weak. Several charts indicated that many of them had experienced multiple negative divergences,...
READ MORE