MEMBERS ONLY

An Award Announcement With a Dash of Market Commentary
KEY TAKEAWAYS
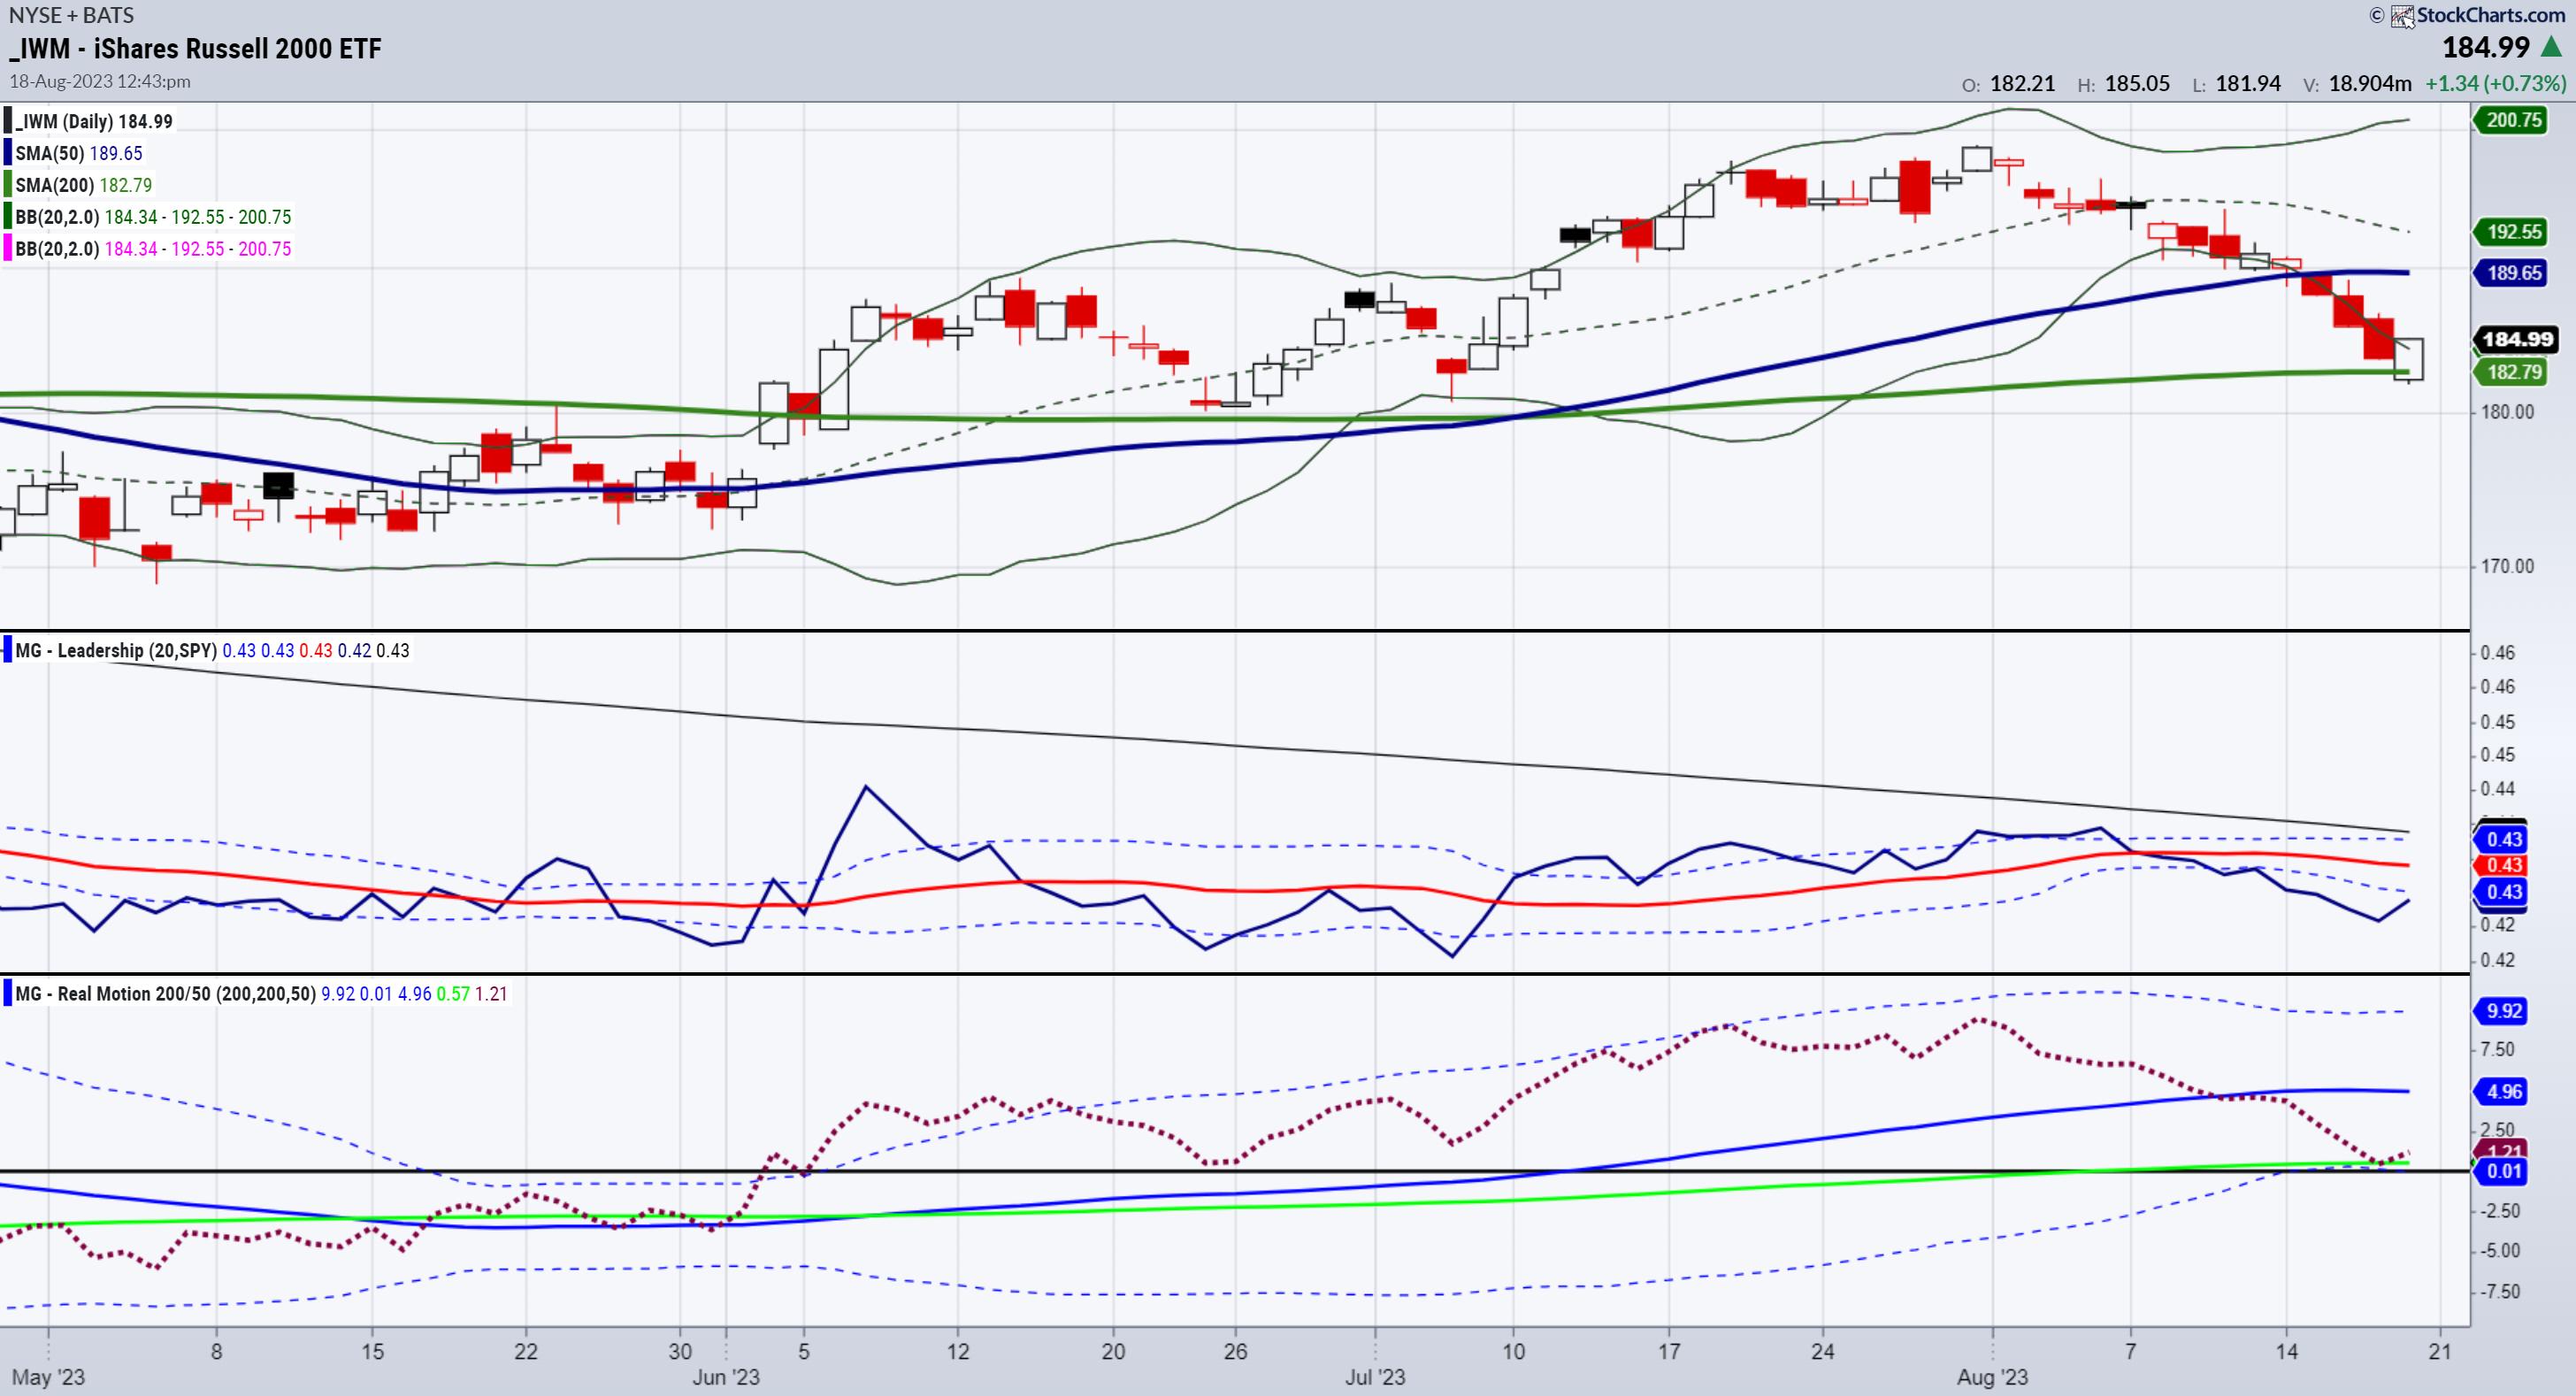
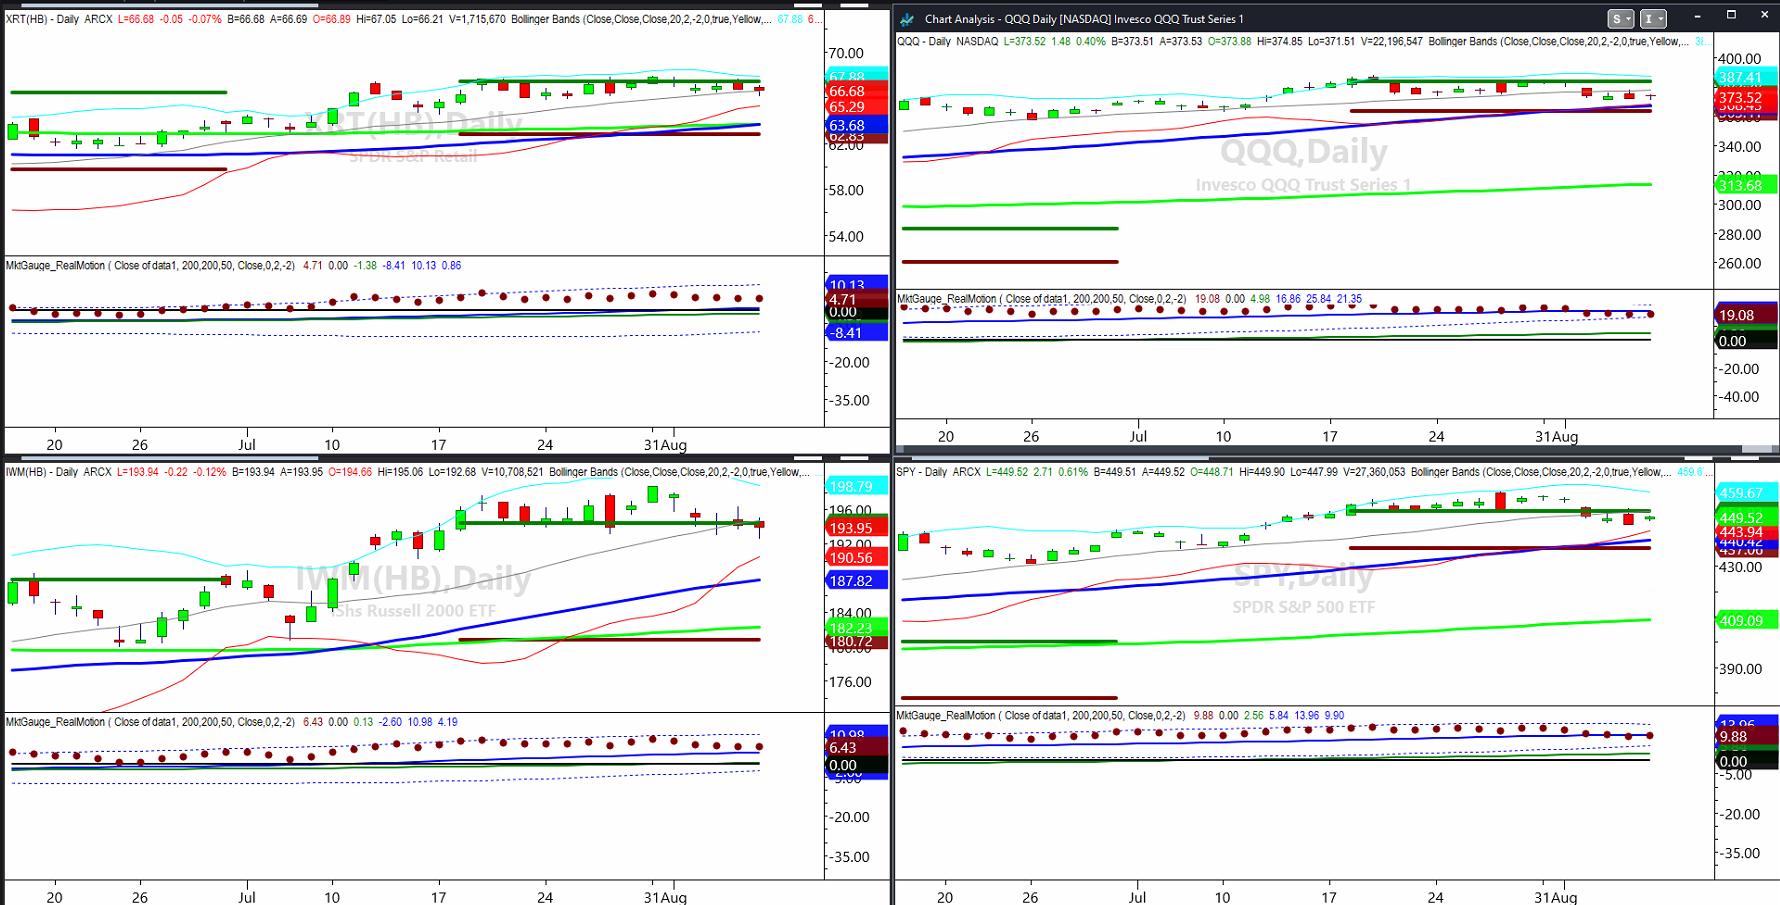
* Small cap and retail stocks are rising and need to hold support to clear overhead resistance.
* iShares Nasdaq Biotechnology ETF (IBB) should stay within the 120 to 125 range.
* Watch the range in regional banks, a potential uptrend in Bitcoin, and a bullish move in commodities.
With words...
READ MORE
MEMBERS ONLY

When News Moves So Fast, Stocks Can Stand Still
Waking up to a new week of geopolitical stress, fake news (Blackrock spot ETF), higher yields, softer dollar, equities rally, I thought to myself: As far as the market goes, it feels like time is standing still.
Why would I think that? After all, it may not last and certainly...
READ MORE
MEMBERS ONLY

Will Bitcoin Go the Way of a Commodity or an Equity?
I went back to my Outlook 2023 written in December 2022, where I begin with:
You Can't Run with the Hare and Hunt with the Hounds.
This expression will ultimately summarize the upcoming year.
As the Year of the Tiger loses its roar, the Year of the Rabbit...
READ MORE
MEMBERS ONLY
Comfort in the Stock Charts (Video Interview)
Some notes this week:
Growth stocks are acting as a defense move again, especially given that the Fed remains on the fence about interest rate. Small caps and retail though, could still act as an anchor. For now, they both held a key area -- 6-7-year business cycle lows --...
READ MORE
MEMBERS ONLY
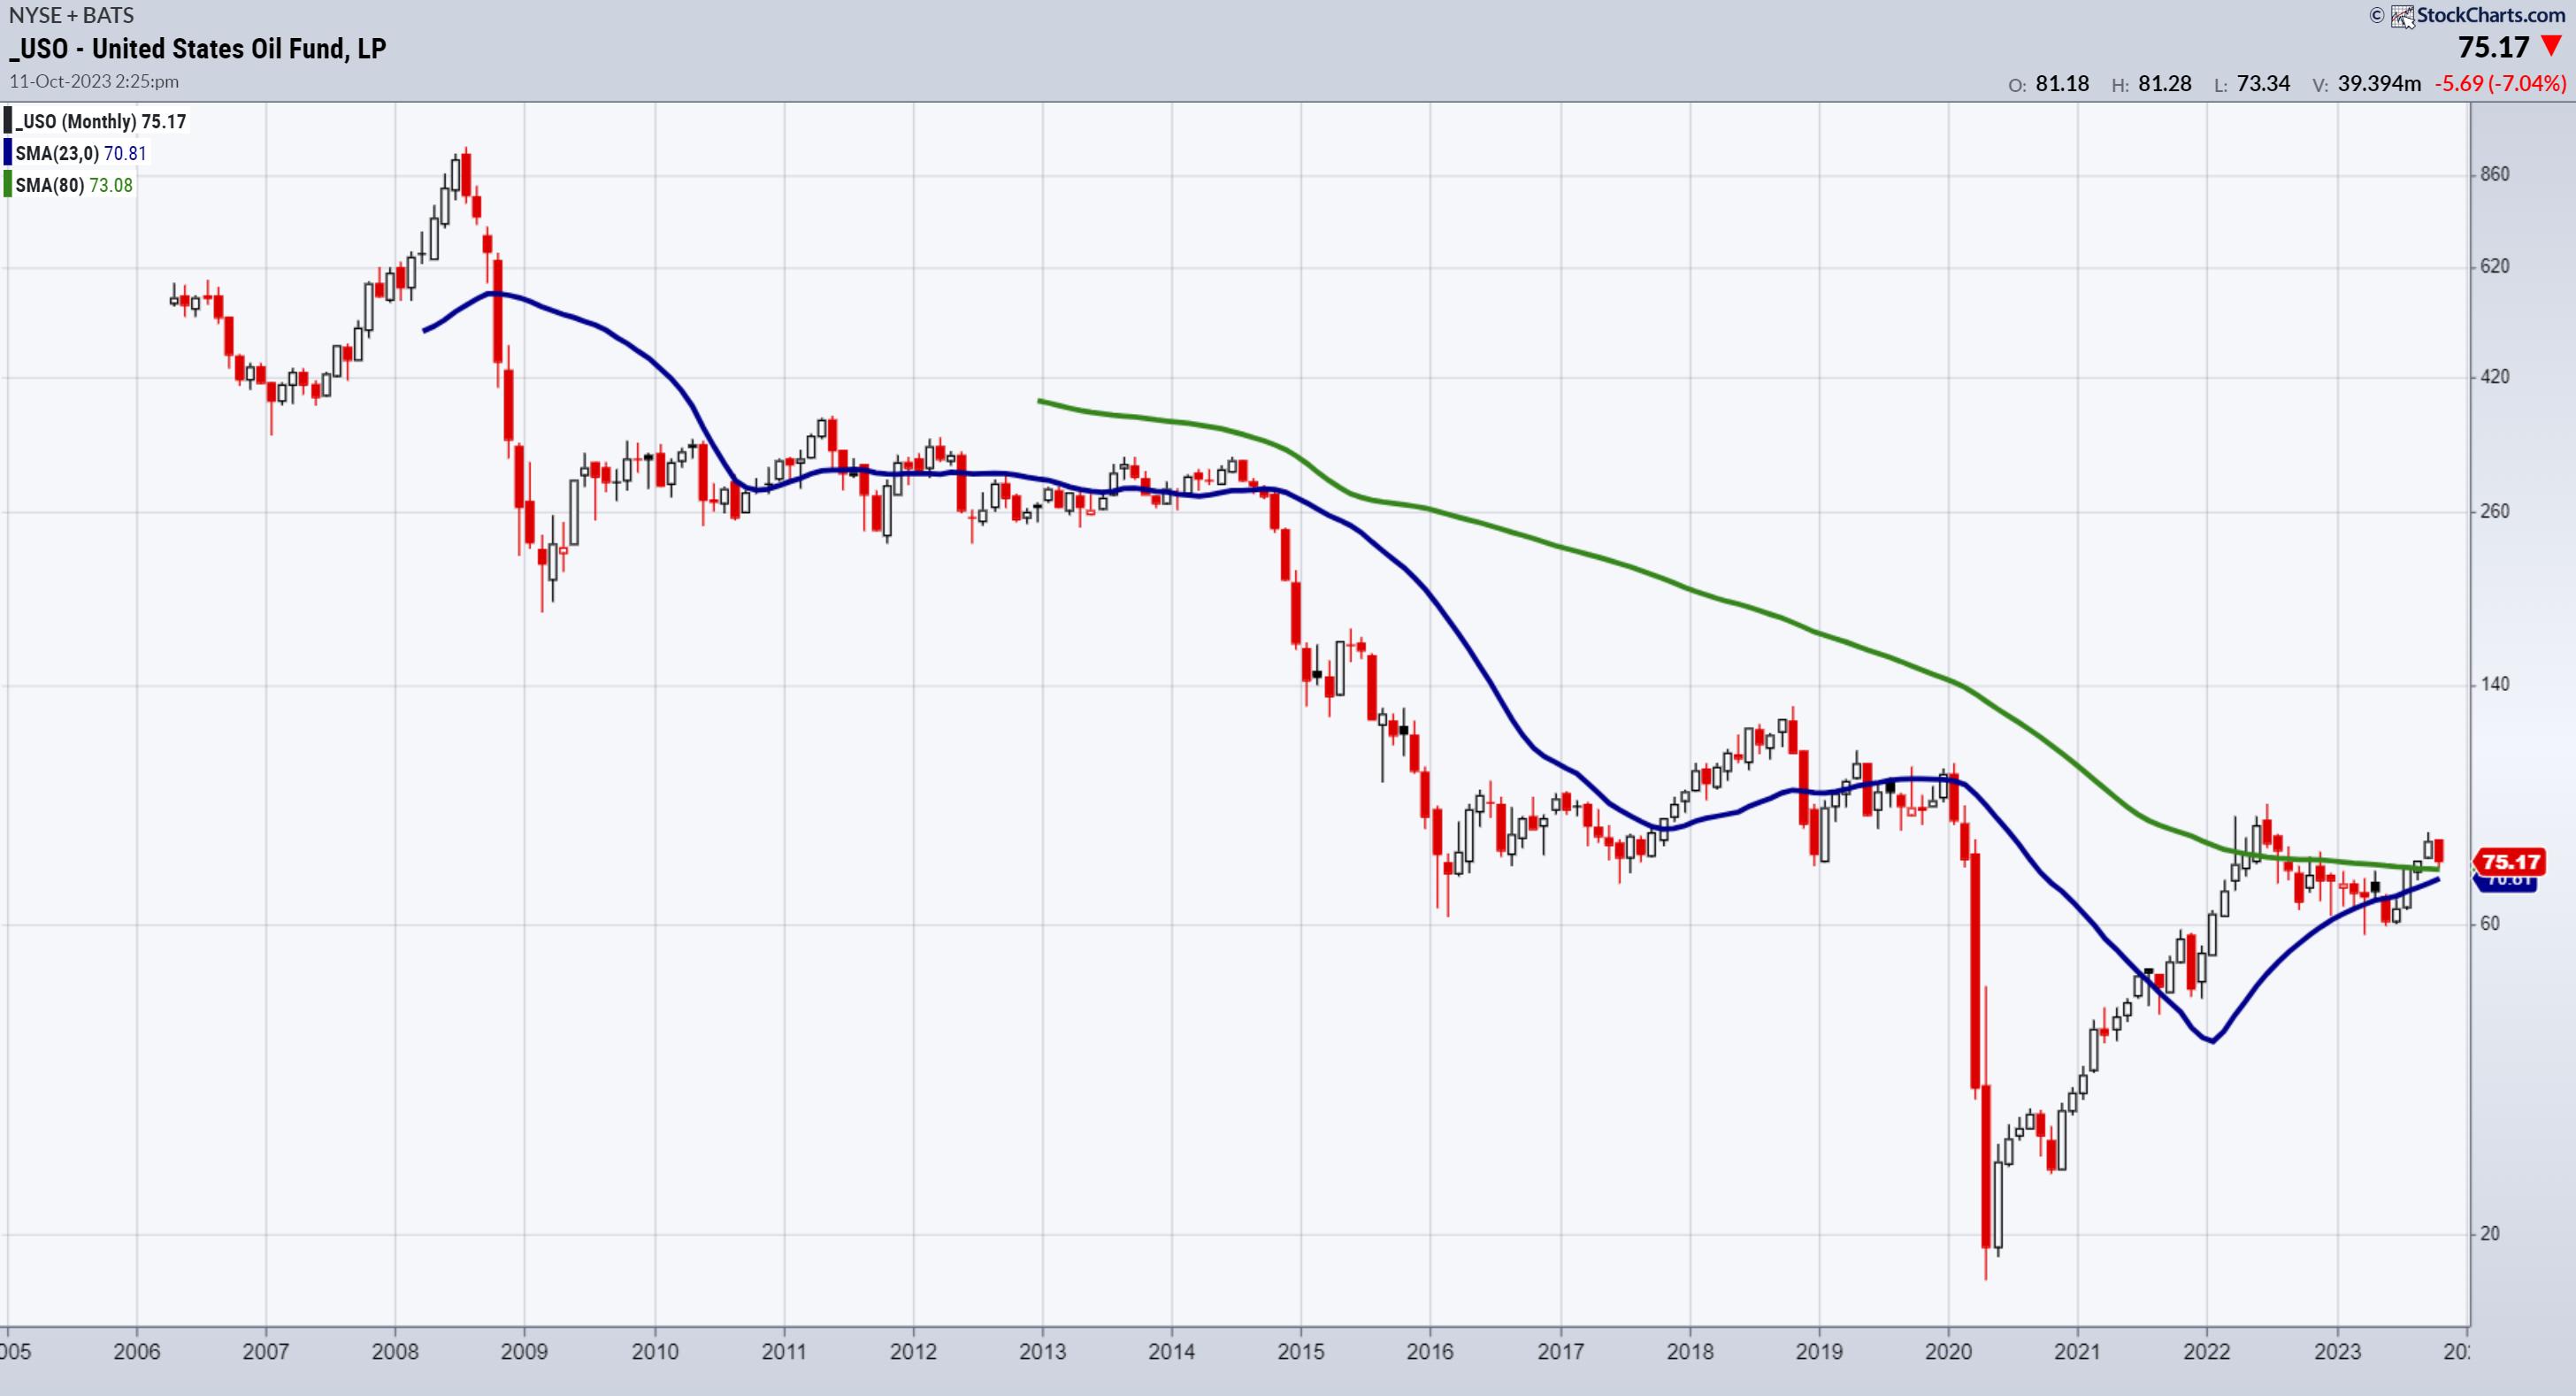
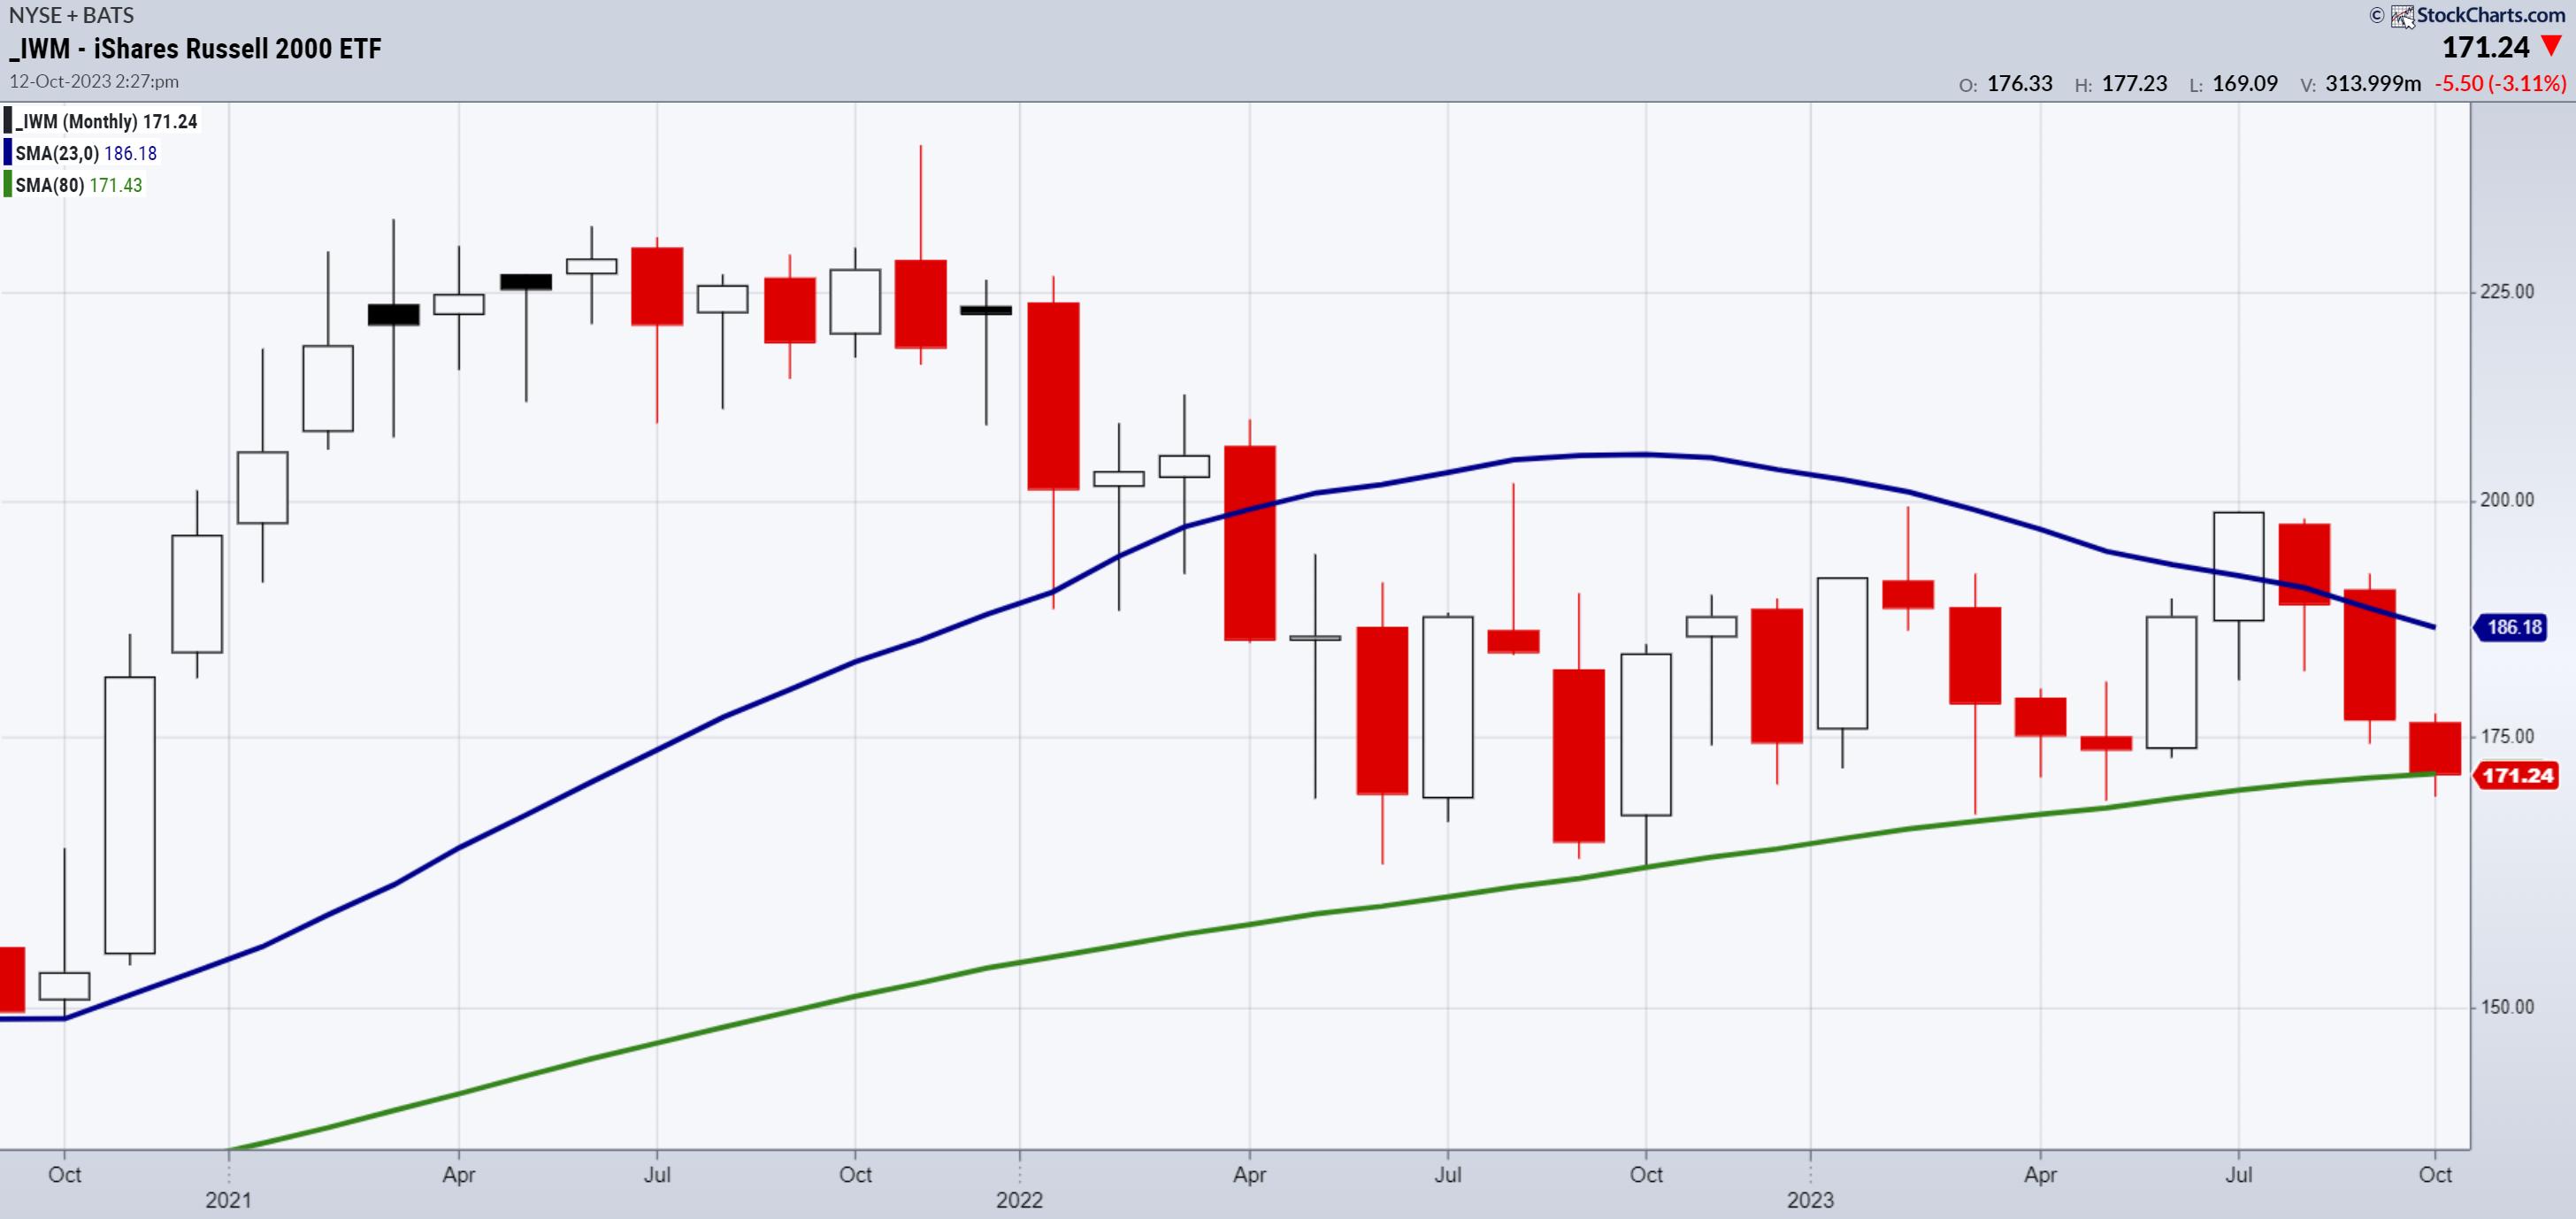
Monthly Chart Points to Much Higher Oil Prices Coming
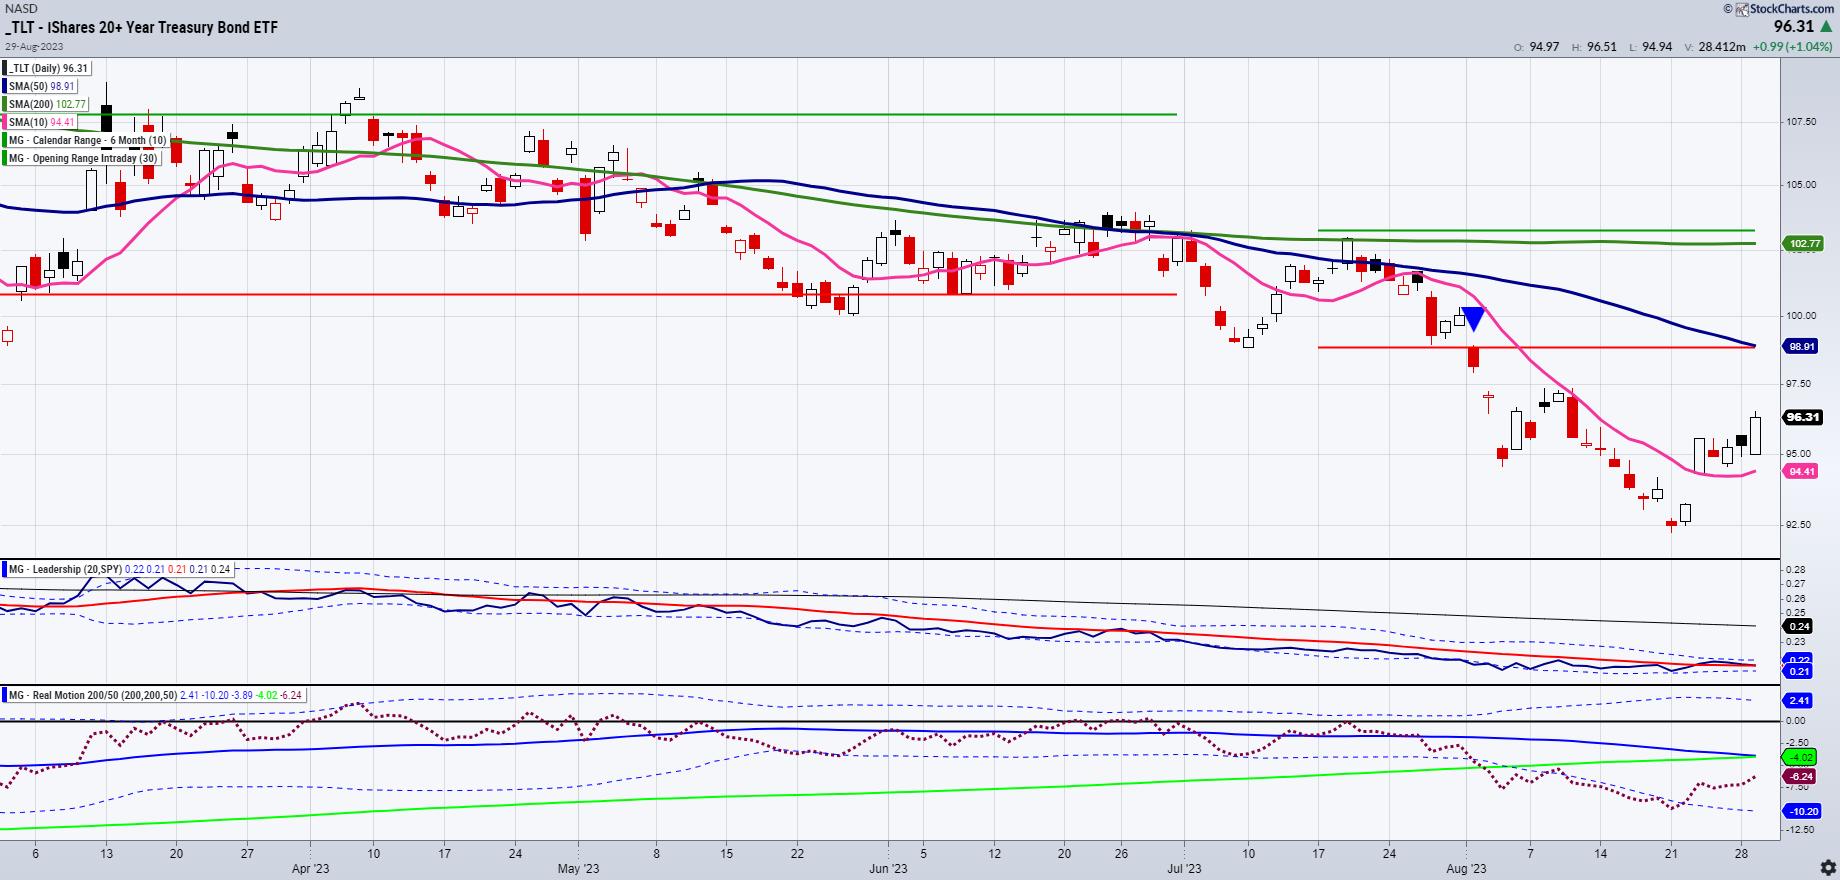
Before we begin, just a note to mention that TLT took out the fast MA featured in the October 10th daily, while SPY underperformed. If that is a trend, it behooves you to review that daily.
Loyal readers of the Daily know that we often focus on zooming out to...
READ MORE
MEMBERS ONLY

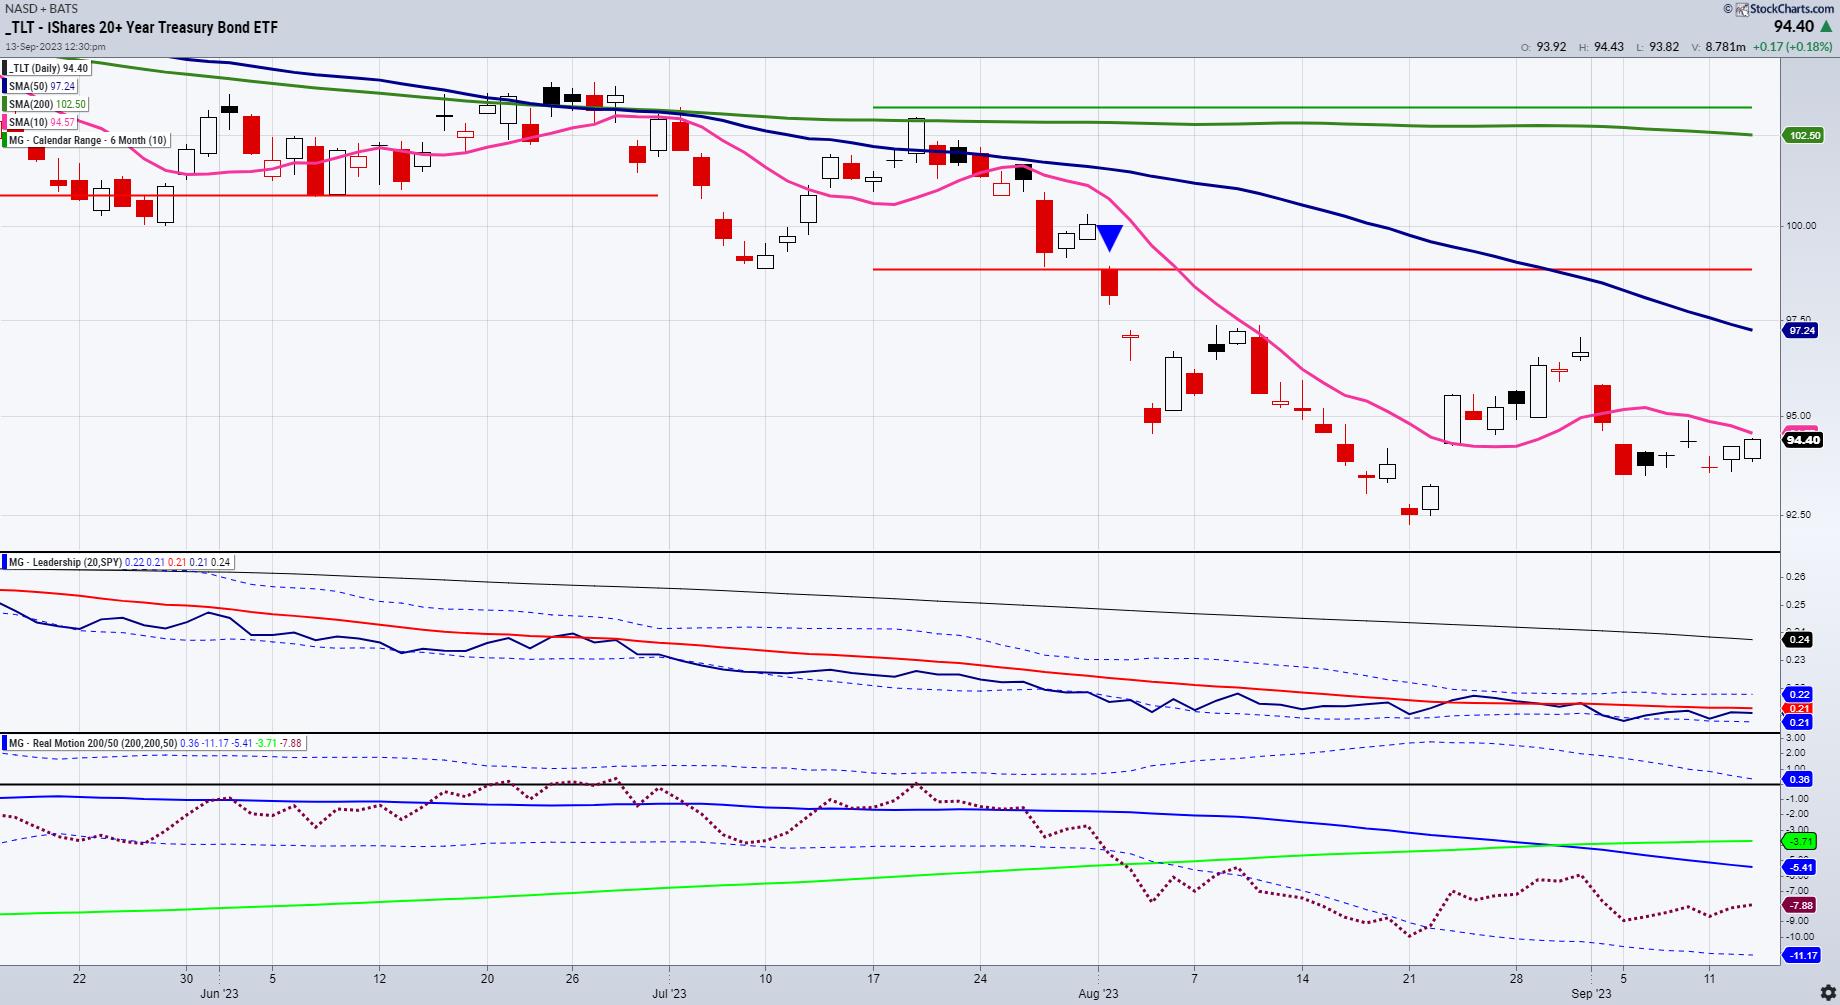
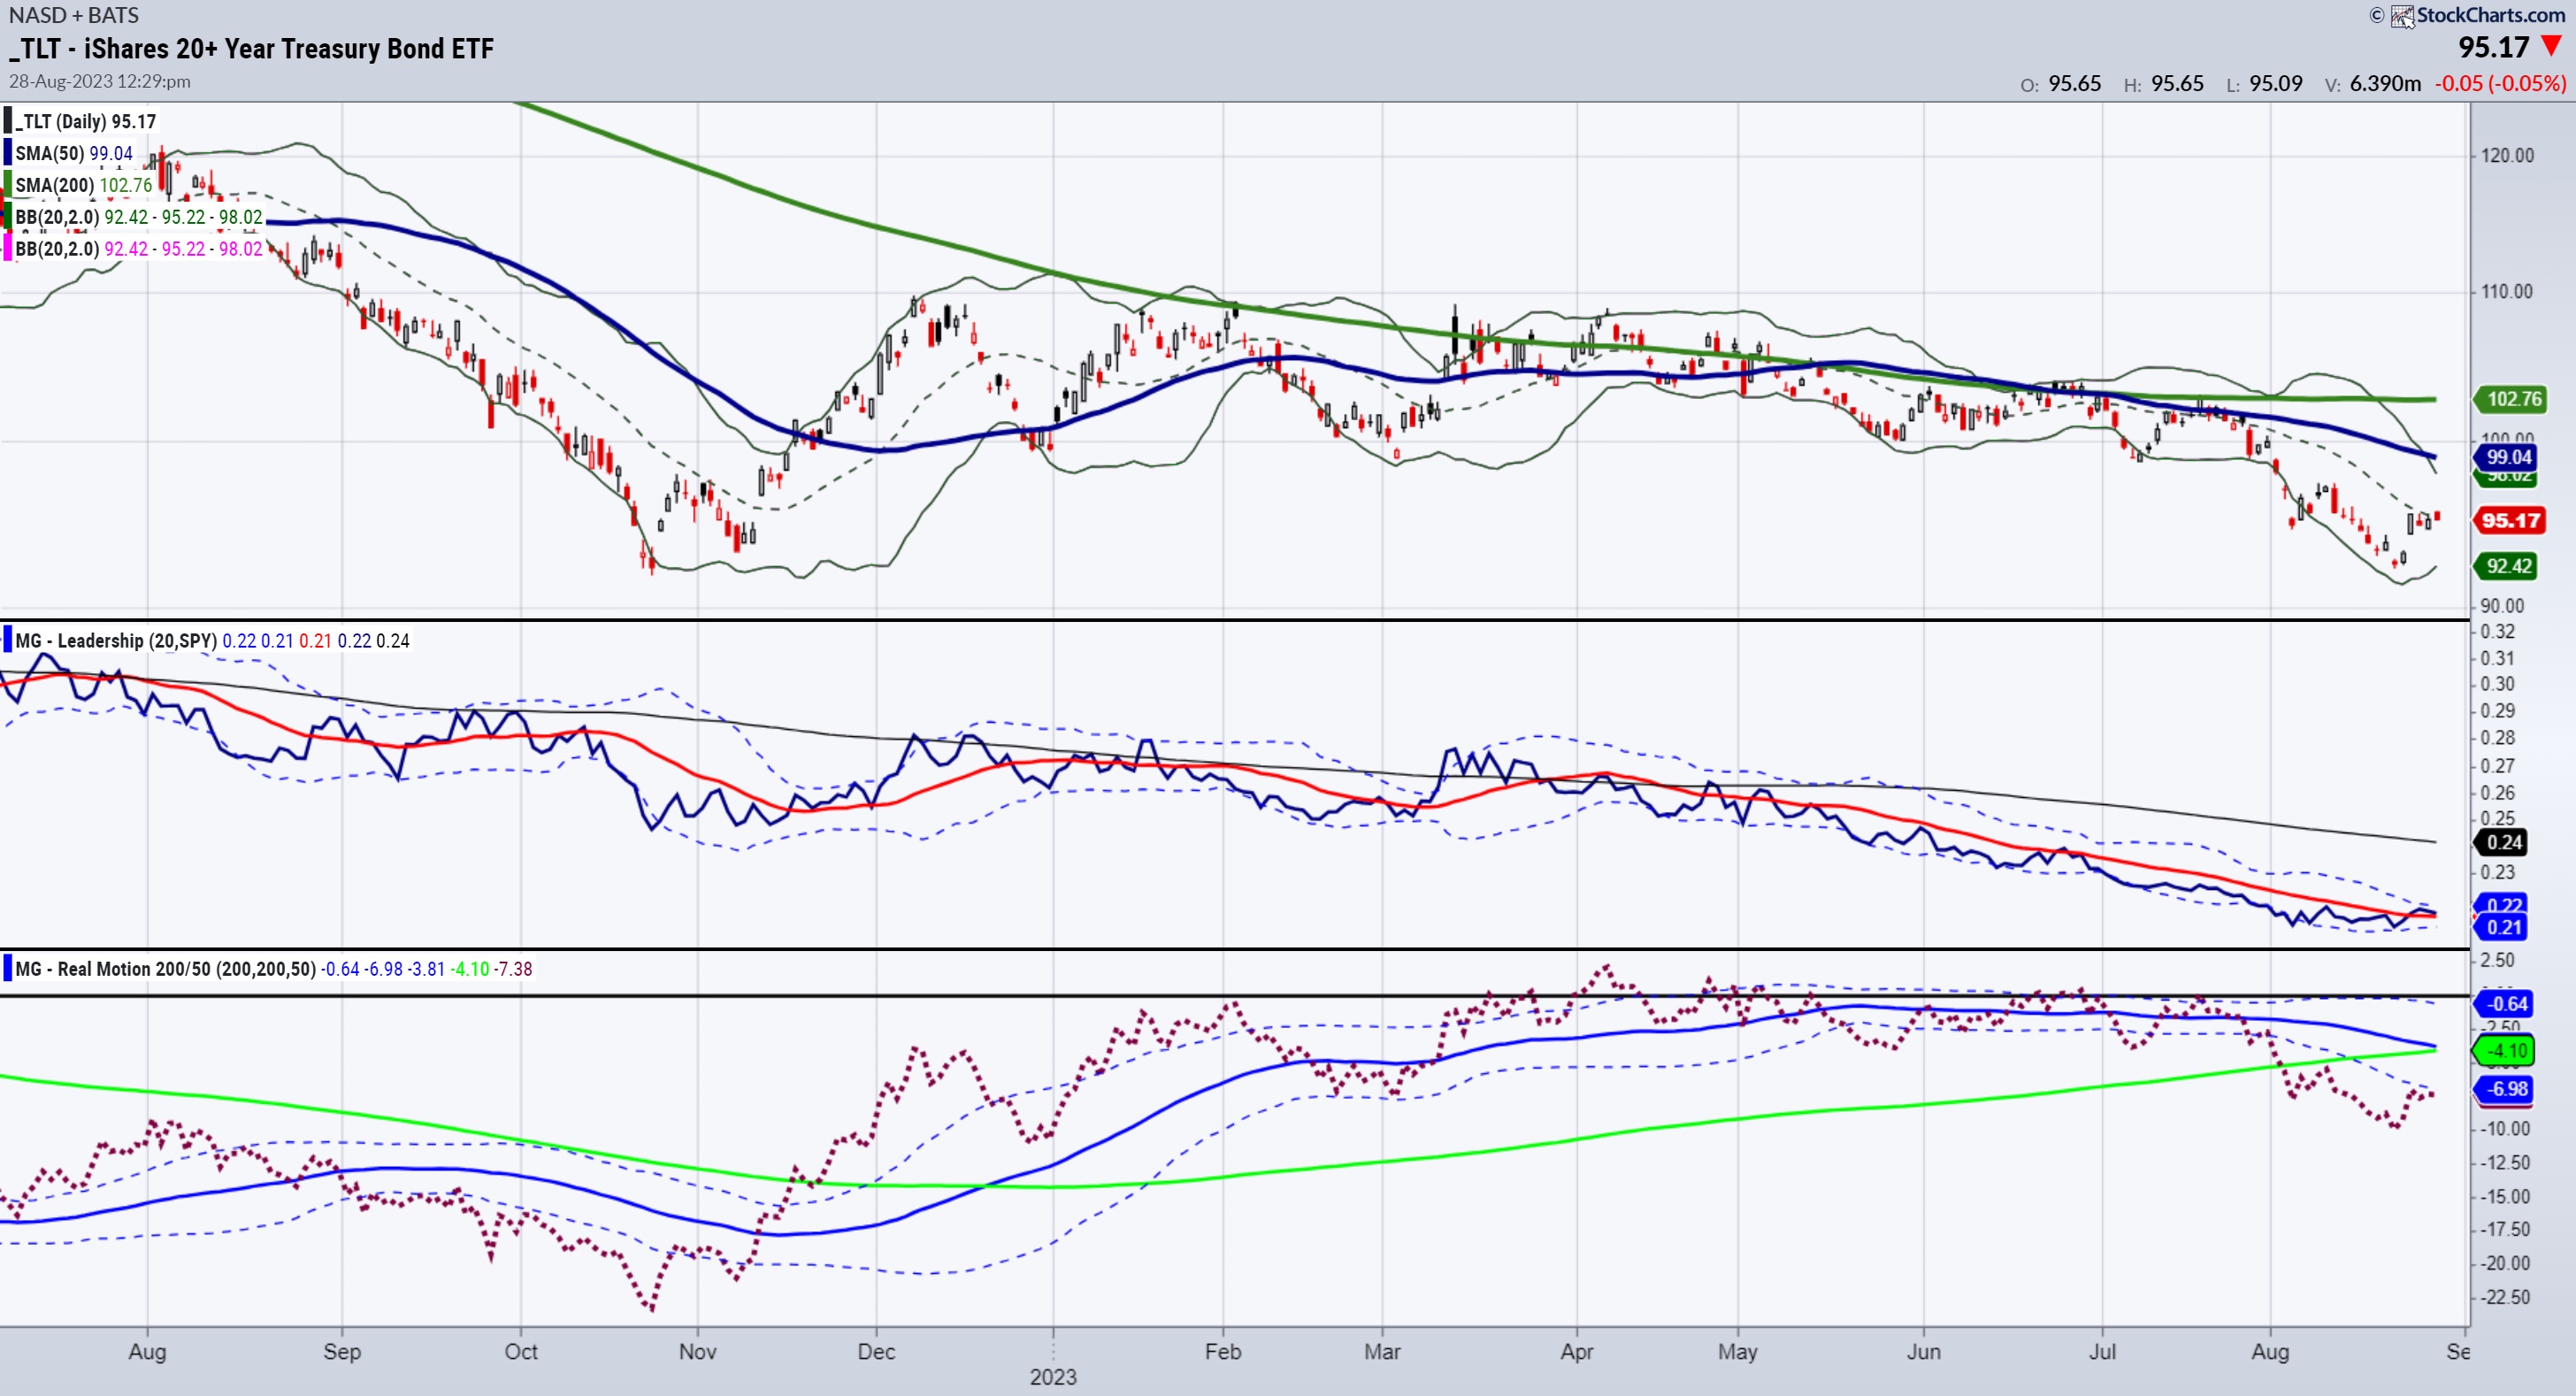
A Closer Look at Long Bonds and The US Dollar
The next direction of the long bonds is crucial in determining the macro.
First, after a wrecking ball crash and ahead of the FOMC, we could surmise that a bottoming-like action defines the last several trading days. Our Real Motion indicator shows a mean reversion. The 10-day moving averages (cyan...
READ MORE
MEMBERS ONLY

Navigating Uncertain Times: Market Recap with Mish Schneider
In this special edition of StockCharts TV'sThe Final Bar, Mish Schneider, Chief Strategist at MarketGauge, takes over for Dave Keller to share her thoughts on the daily Market Recap during a day of uncertain news.
This video originally premiered on October 9, 2023. Watch on our dedicated Final...
READ MORE
MEMBERS ONLY
What We Will Use to Ascertain the Market's Next Moves
For consistency, here are the key go-tos during an uncertain time in the market:
1. The next direction of long bonds (TLT).
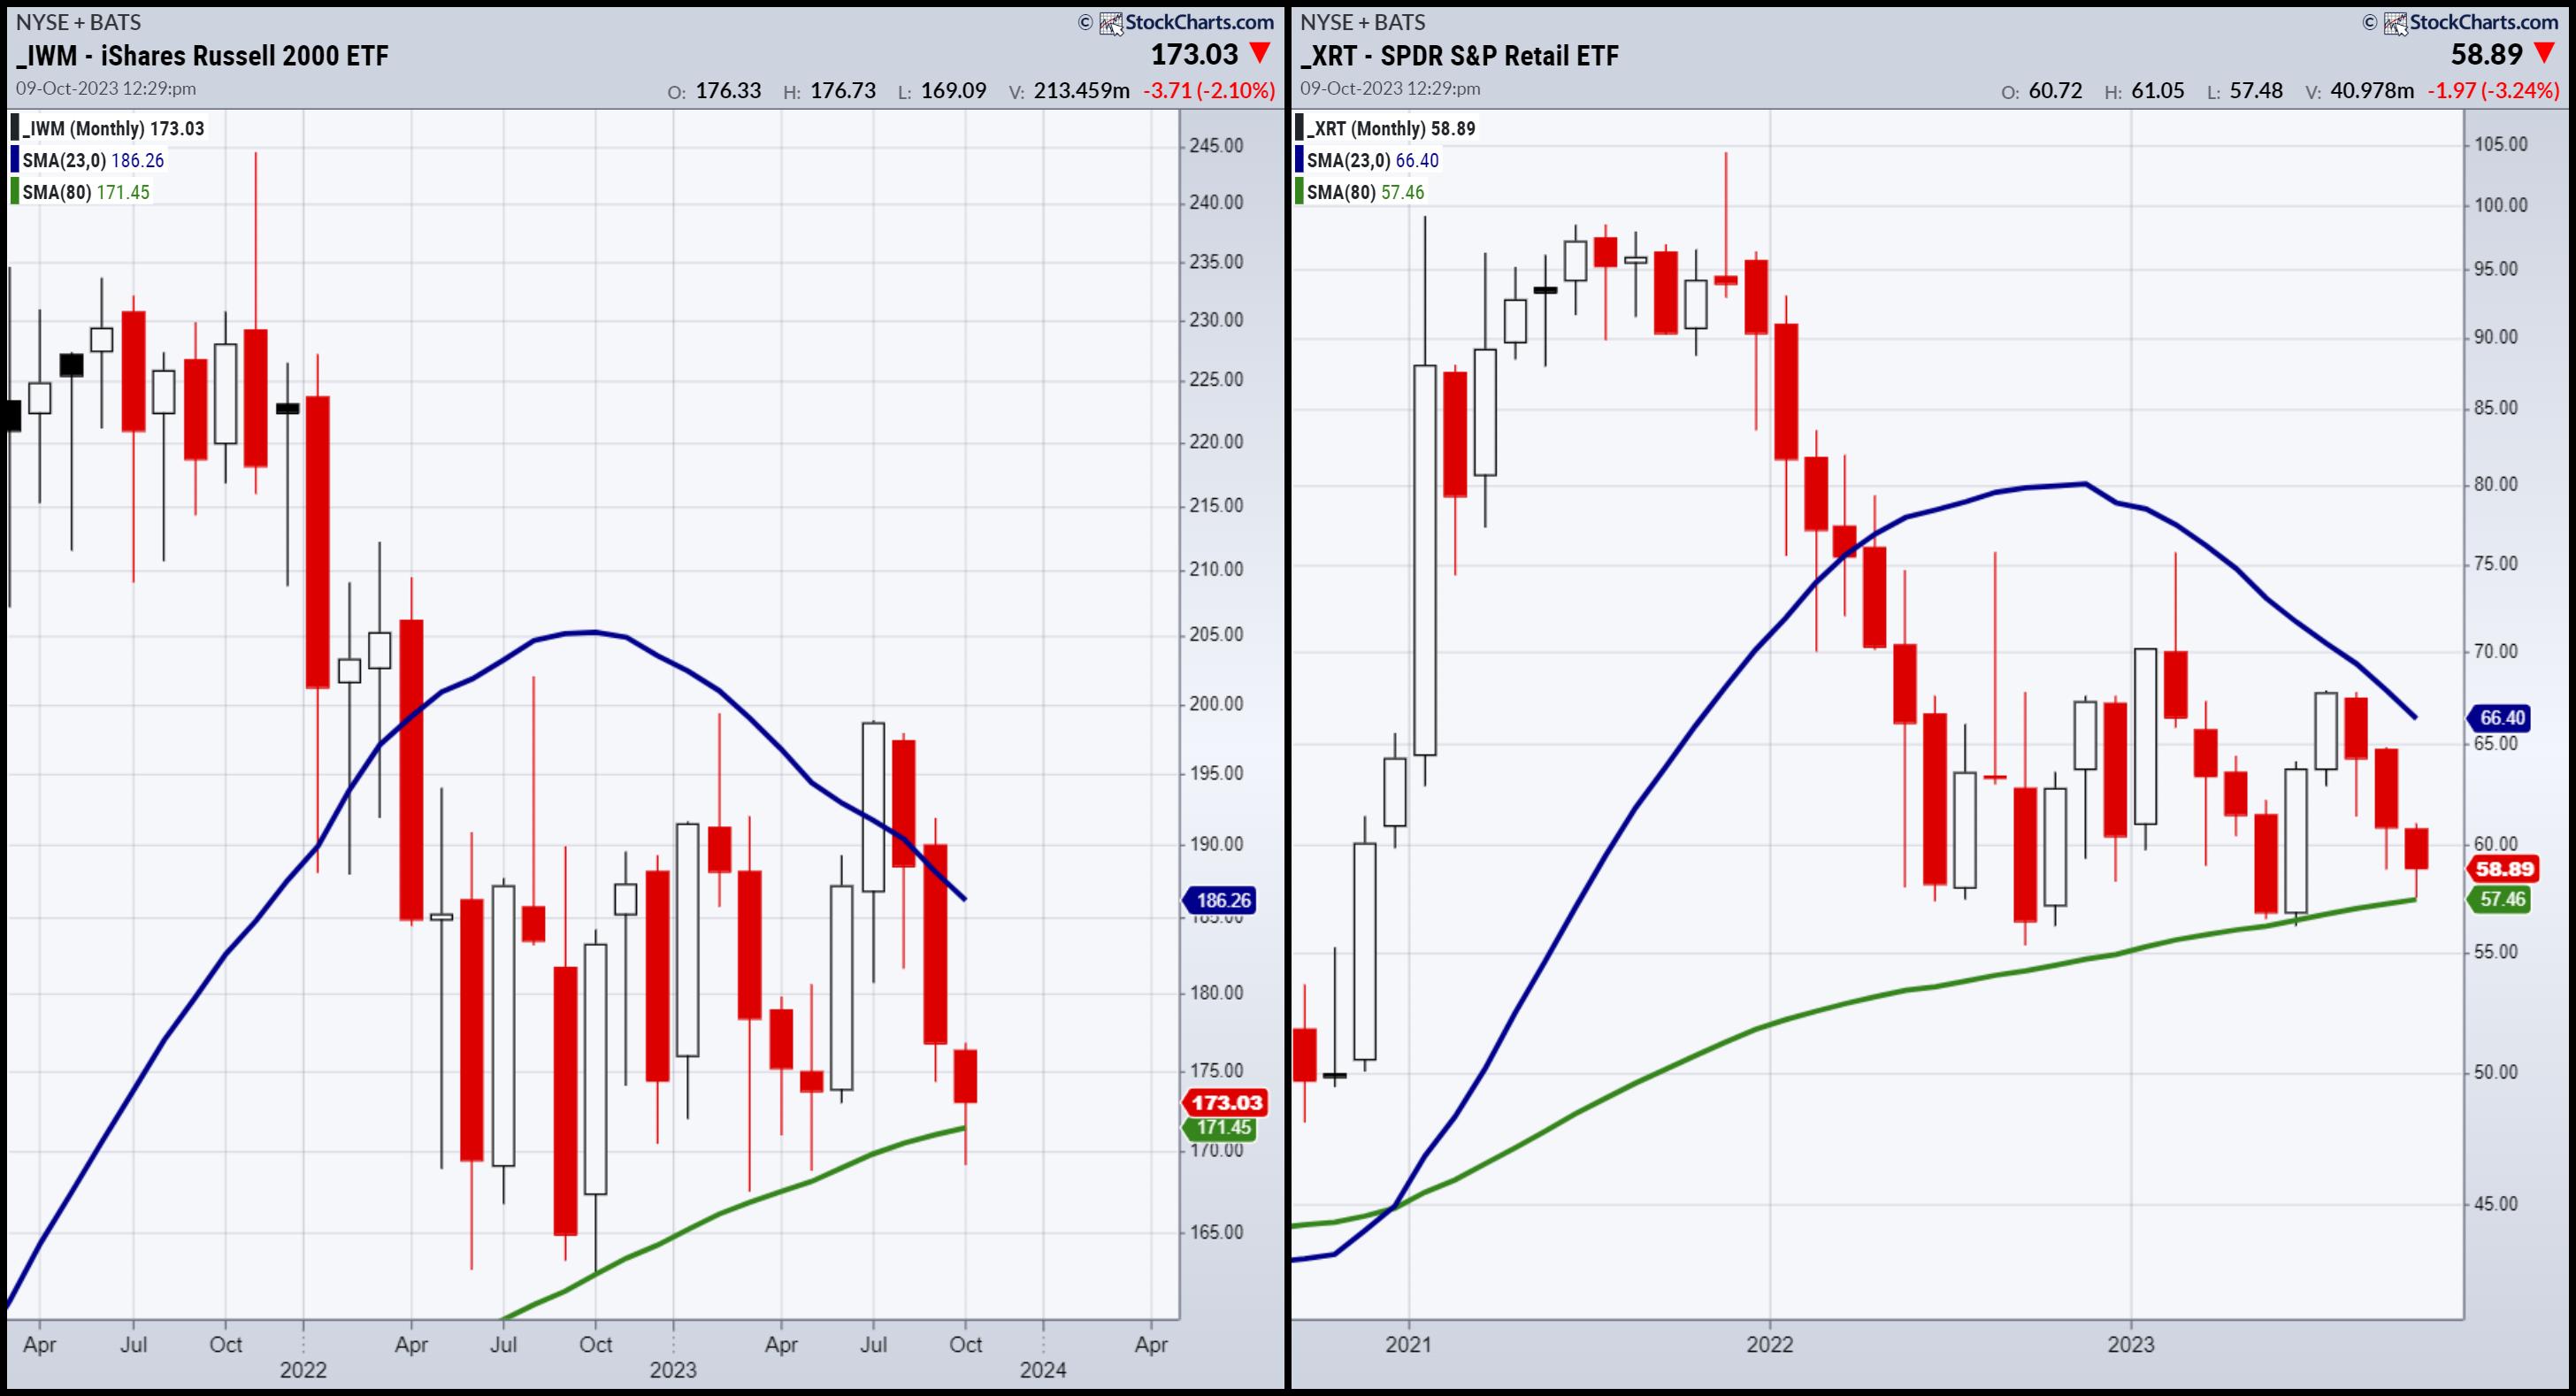
2. The next direction of the small caps and retail sectors (IWM, XRT).
3. The next direction of commodities, all of them, but particularly the agricultural ones, oil...
READ MORE
MEMBERS ONLY

Small-Caps and Retail Hold the Line in the Sand
I spent all of last week, in the media and in print, going over the importance of 2 key indicators. (See the media clips below.)
1. Our risk gauges on Big View, all of which kept flashing risk-on regardless of the doom-and-gloom and initial selloff in bonds and SPY.
2....
READ MORE
MEMBERS ONLY
Watch Mish on Real Vision and More!
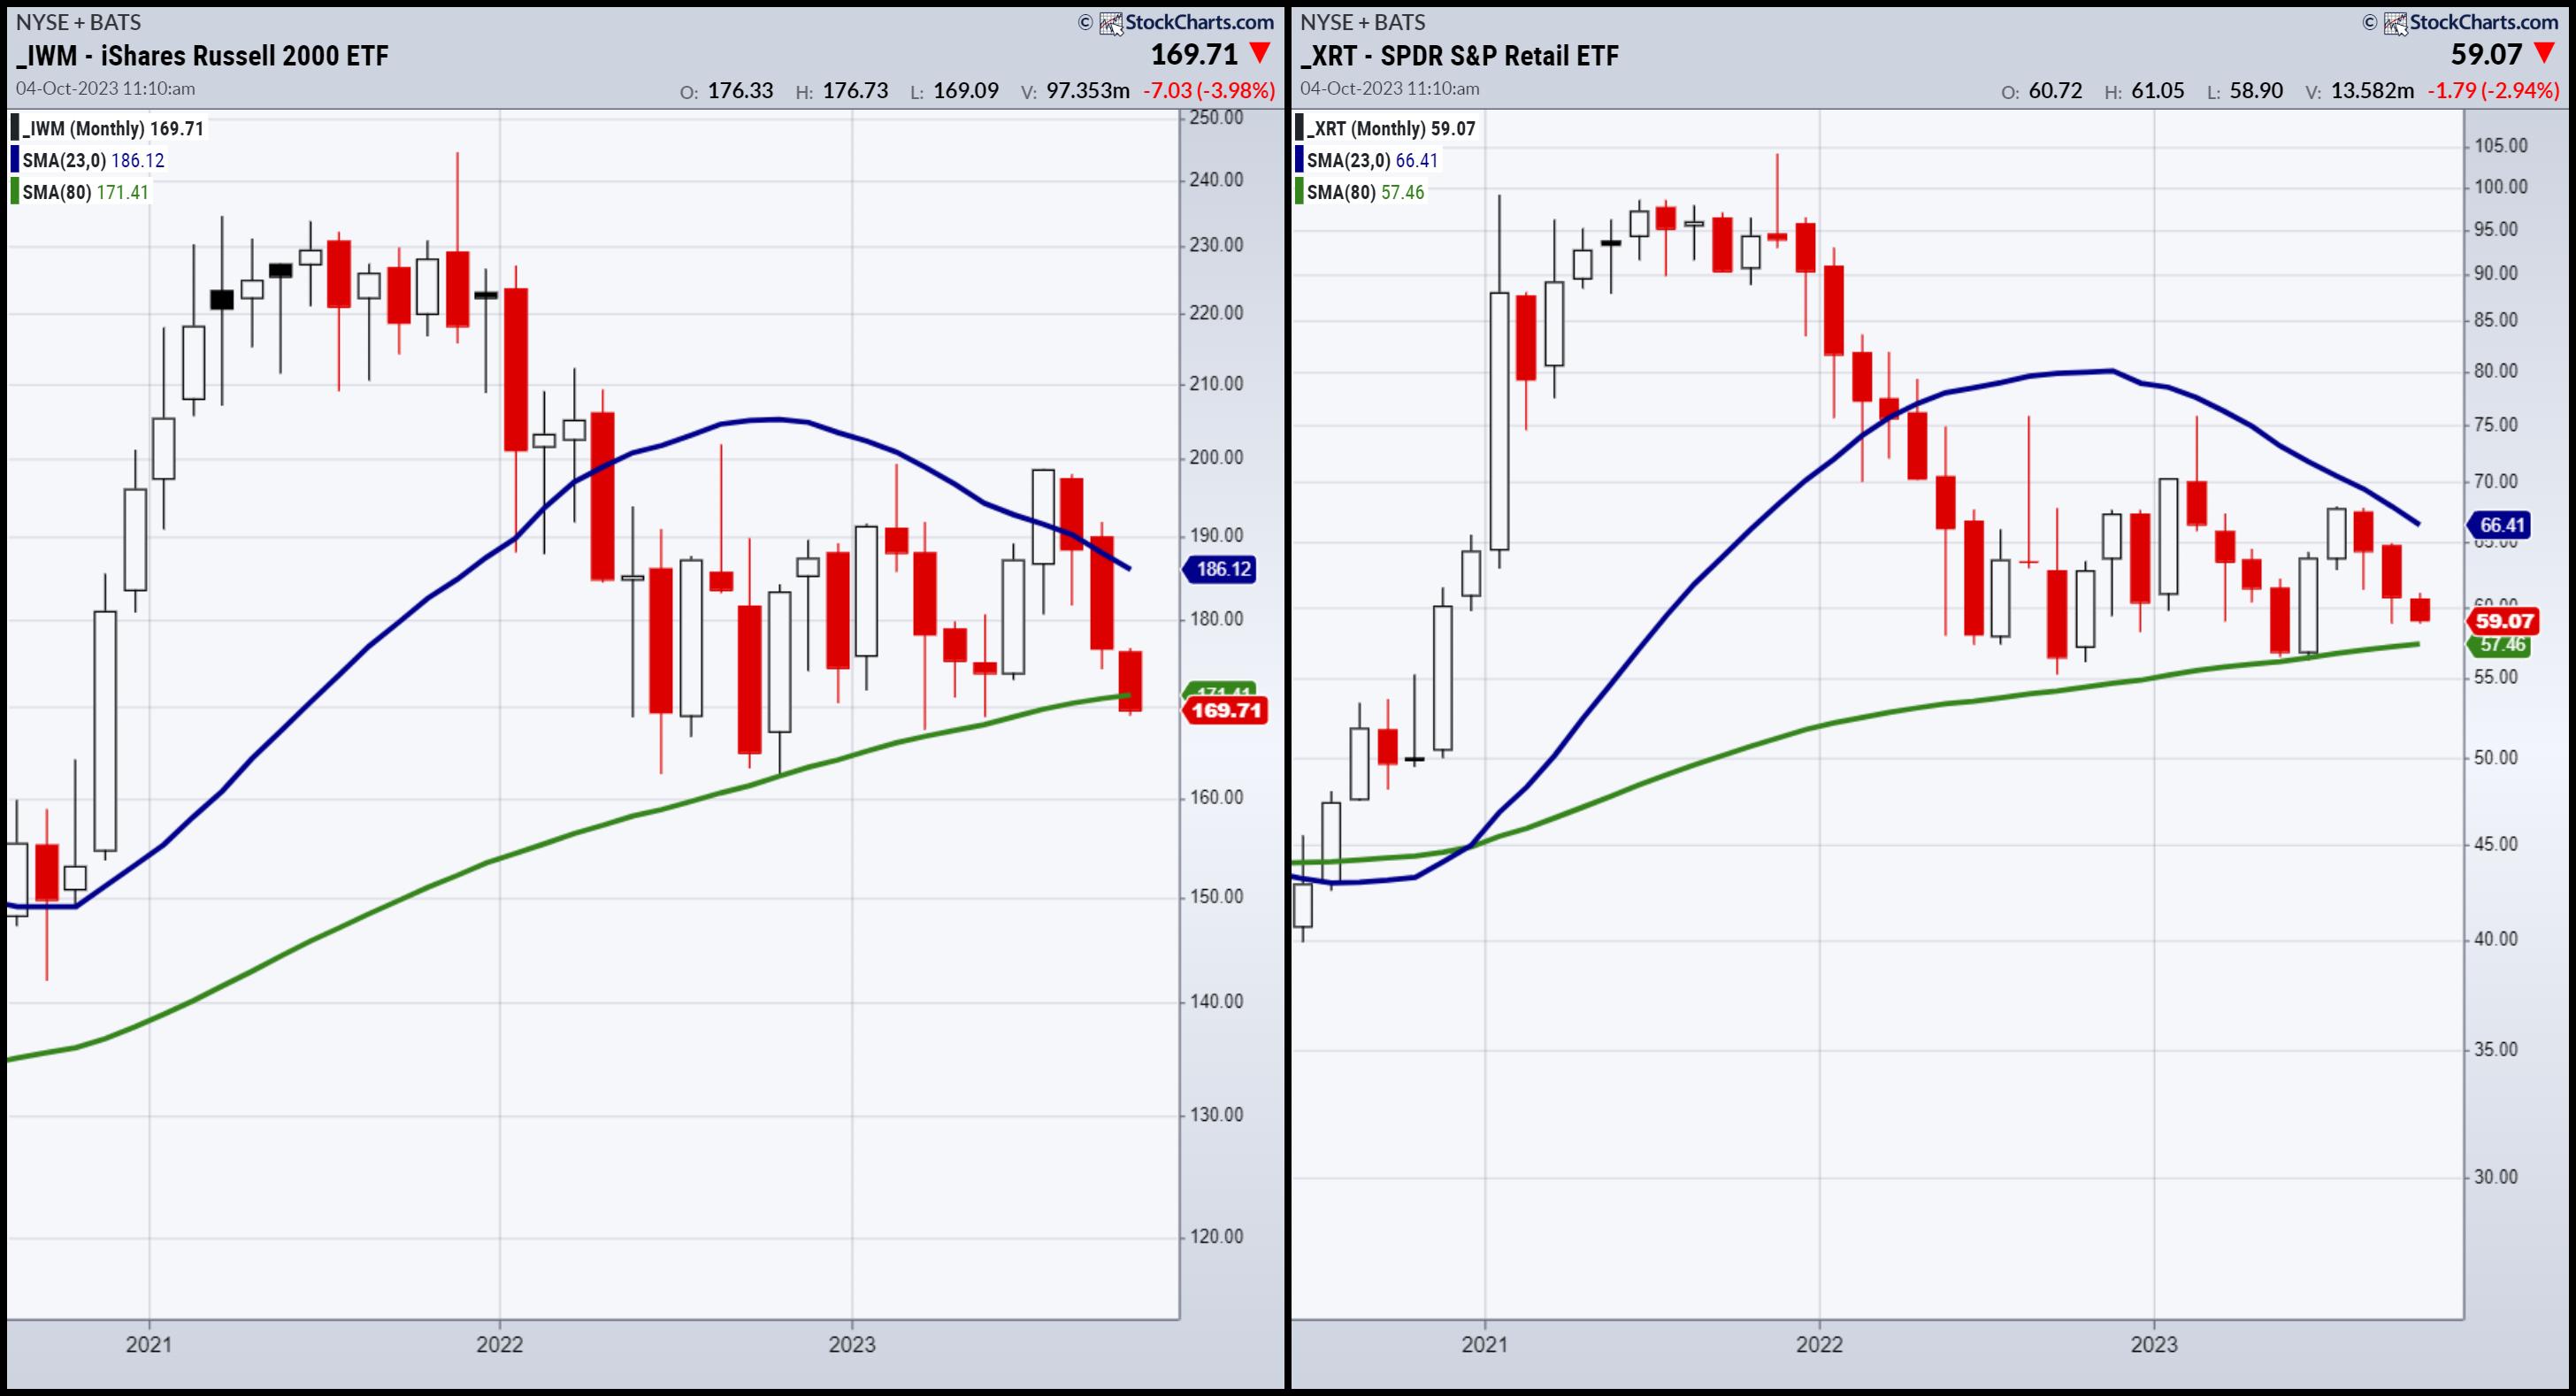
Yesterday, we covered the 80-month moving average in small caps and retail.
Today, I did several interviews -- some already out (BNN Bloomberg), others out soon (Financial Sense with Jim Pupluva), and the one that you'll find on YouTubelater today with Real Vision.
We chose this one to...
READ MORE
MEMBERS ONLY
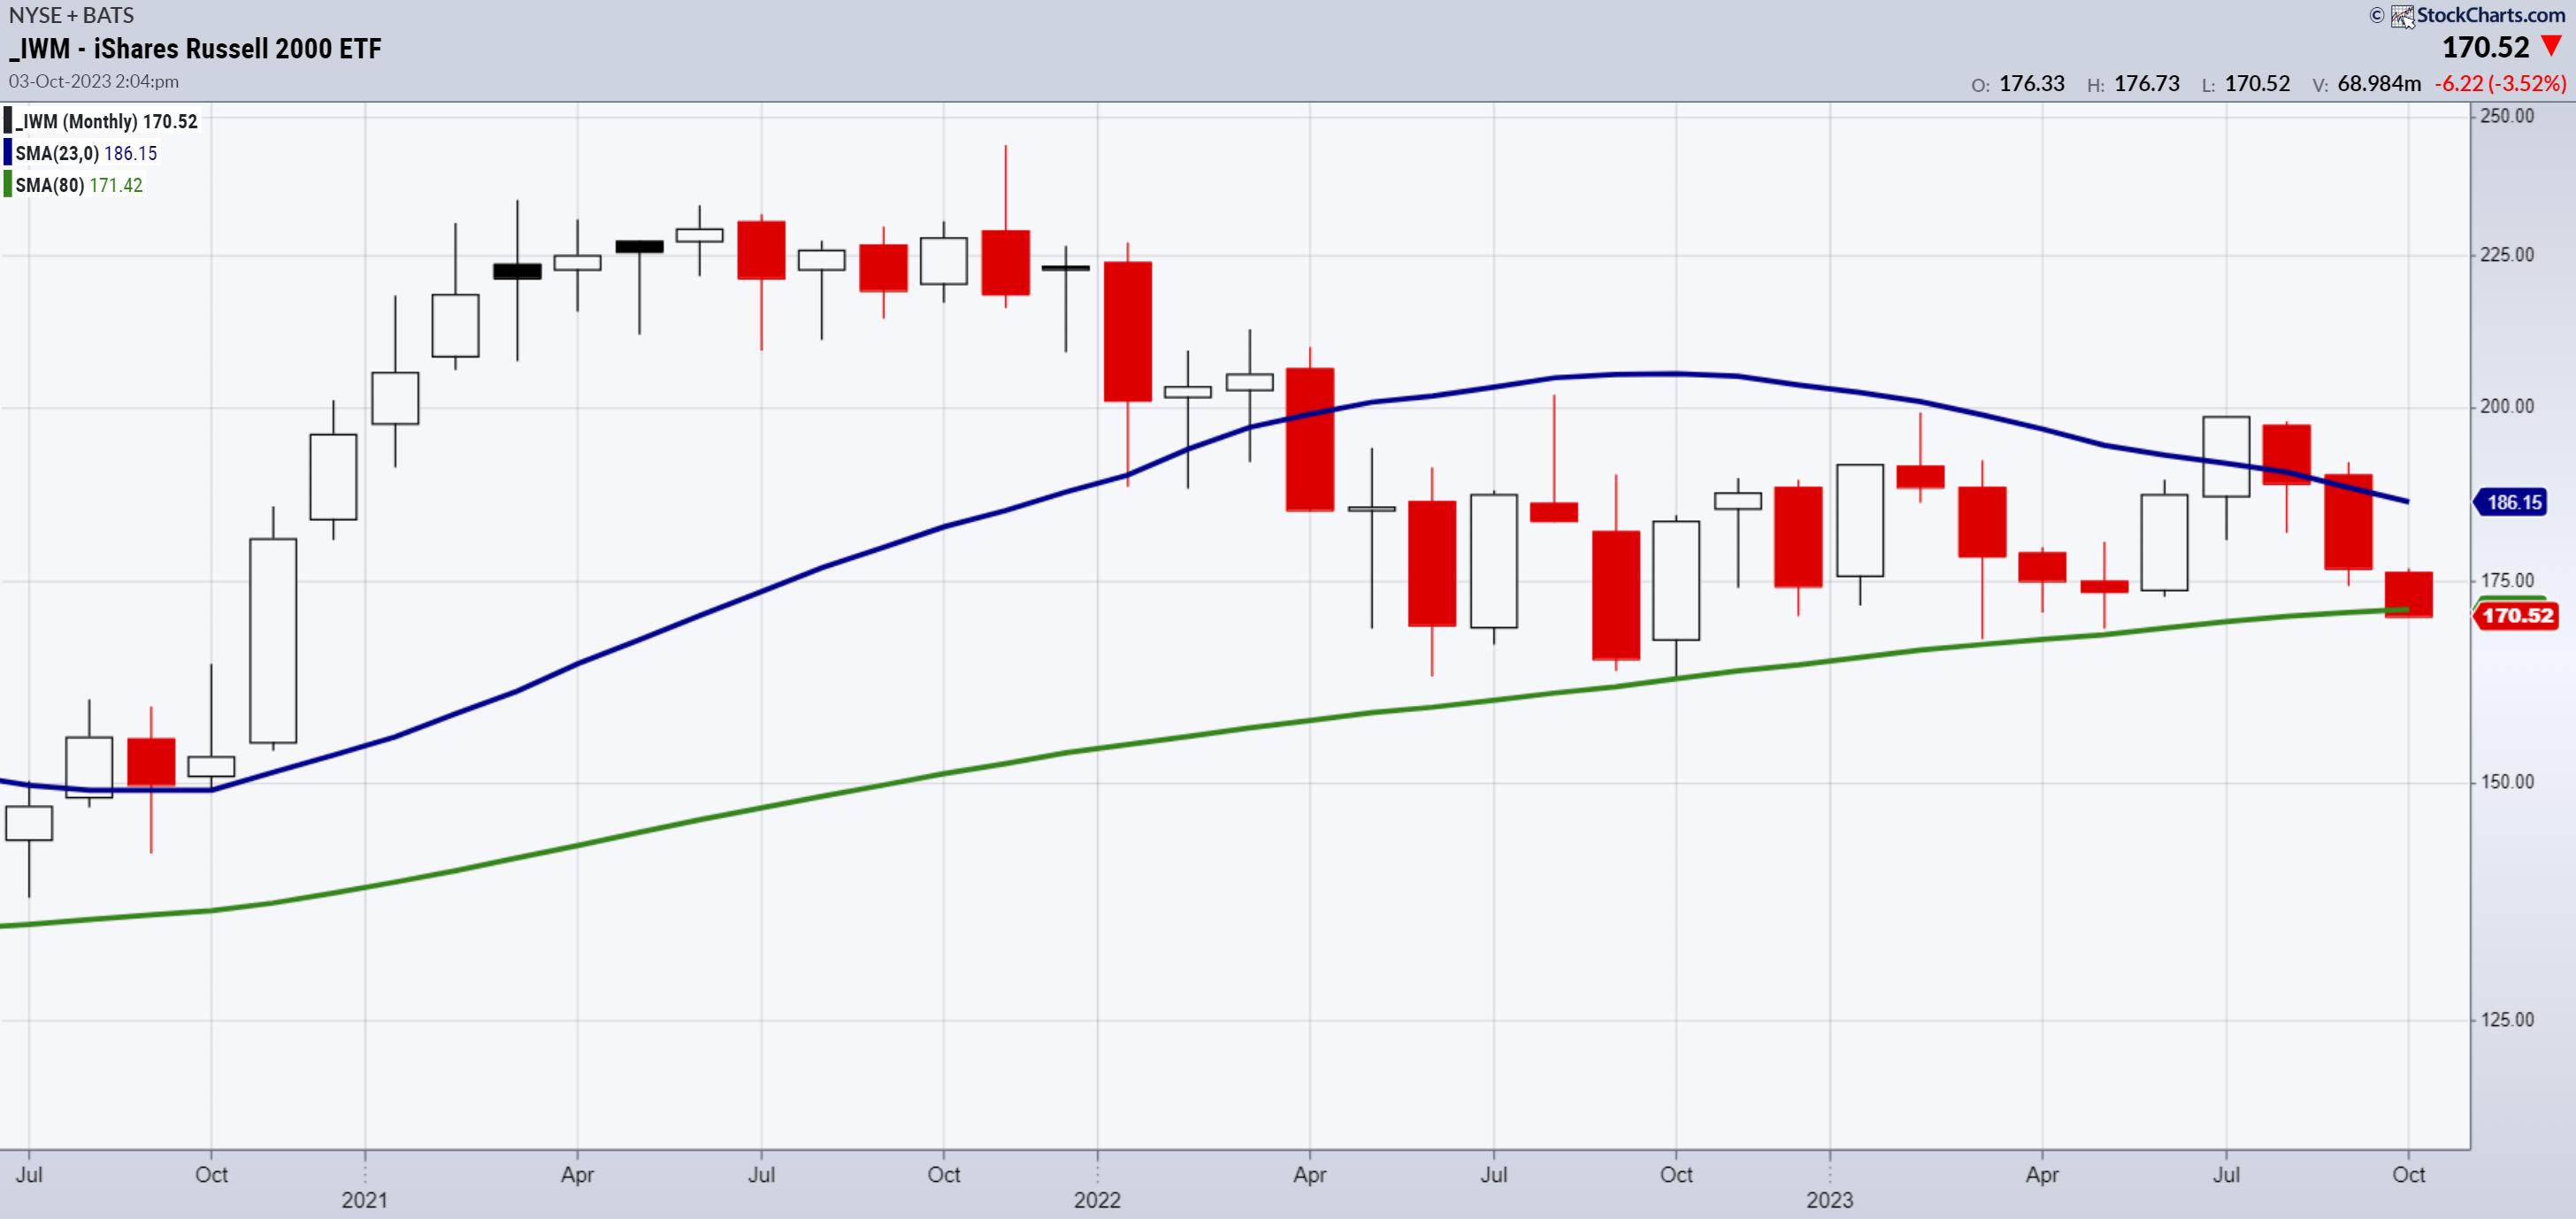
Time to Talk 6-7 Year Market Business Cycles
We began the year examining the 23-month moving averages in all the indices and major market sectors. It was pretty simple, really: buy anything that cleared the blue line (2-year business cycle), which we explained was a good reflection of a cycle within a cycle (6-7 year cycles are typical)...
READ MORE
MEMBERS ONLY
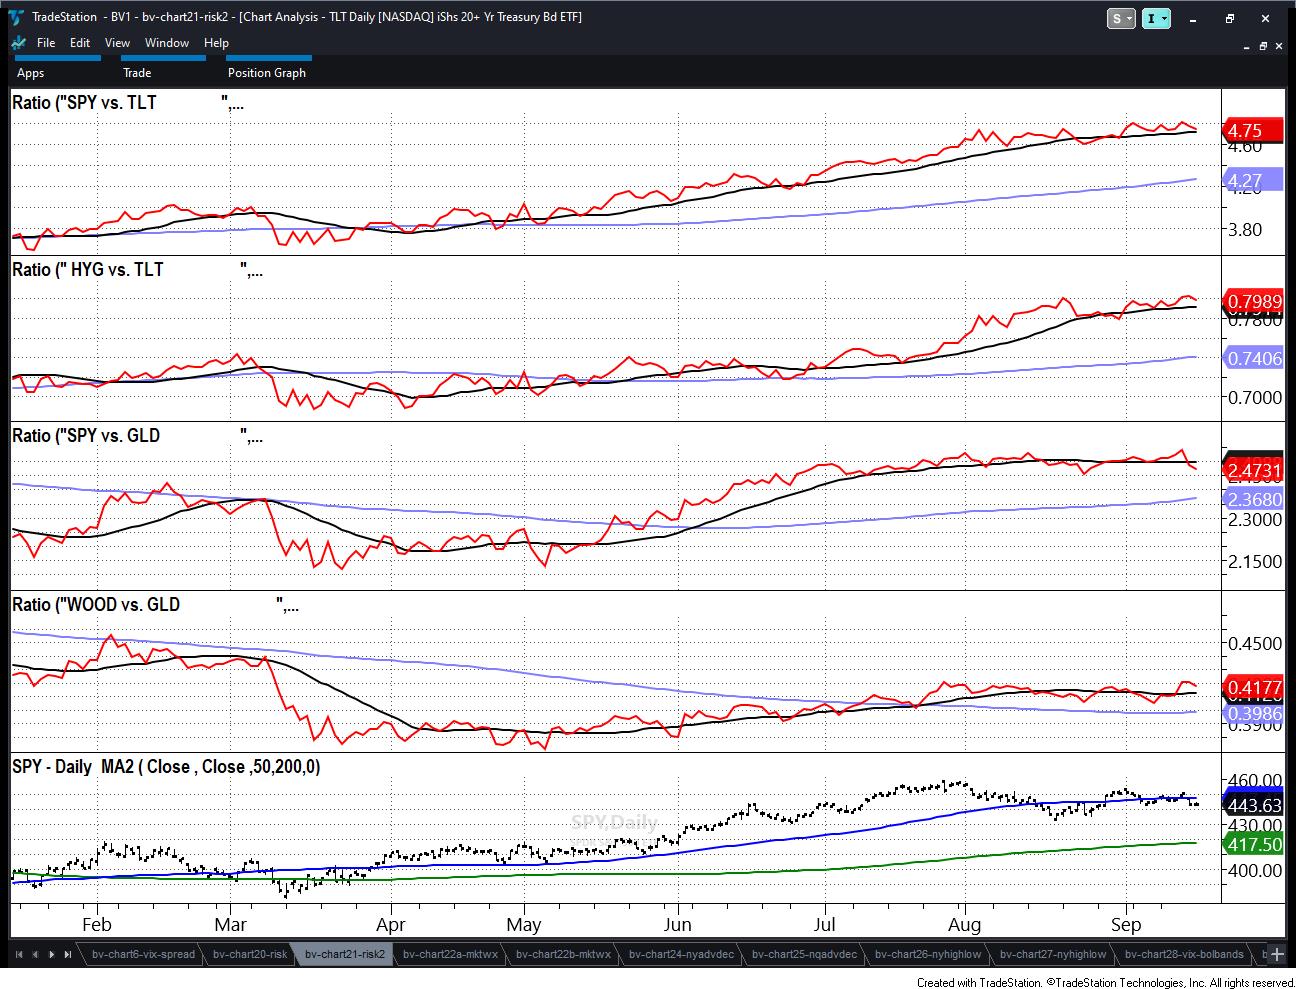
3 Key Relationships to Help Assess Market Direction
If you are finding yourself fluctuating between bullishness and bearishness, then congratulations! Hopefully, that also means you are waiting for certain signals to help you commit to one way or another.
Here are the signals we are waiting for before overly committing to a bias:
1. As we wrote over...
READ MORE
MEMBERS ONLY

Risk-Neutral Market Gauges Ahead of Sunday Deadline
We do not want to walk down the political aisle. Nonetheless, what person can turn their heads away from the Sunday deadline on funding the government?
The aftermath of a shutdown will most likely include a credit downgrade for the US. Do Americans need another reason to distrust the politicos?...
READ MORE
MEMBERS ONLY

Boyz to Men -- Step Back to Small Caps & Growth Stocks
We started this year looking at the monthly charts and the 2 moving averages that depict business cycles.
Back in February, we wrote:
All in all, the key sectors (retail, transportation) have more to prove, especially by clearing the 23-month moving average or 2-year business cycle. This is a significant...
READ MORE
MEMBERS ONLY
Market Begs: Tell Us Something Good!
We compiled a list of the 10 biggest uncertainties in the stock market right now.
In no particular order:
1. China-trade wars and chip wars
2. Oil and food inflation
3. Strikes
4. Government shutdown
5. Corporate and individual bankruptcies on the rise
6. Commercial real estate and banking
7....
READ MORE
MEMBERS ONLY

Volatility Taunting Fresh Equity Buyers
This week I appeared with David Keller on Stockcharts Final Bar. We discussed how the market is at a precipice. And no doubt, the words I wrote on April 20th Daily "Now That "Stagflation" Has Gone Mainstream"some five months later are buzzing in my head:...
READ MORE
MEMBERS ONLY
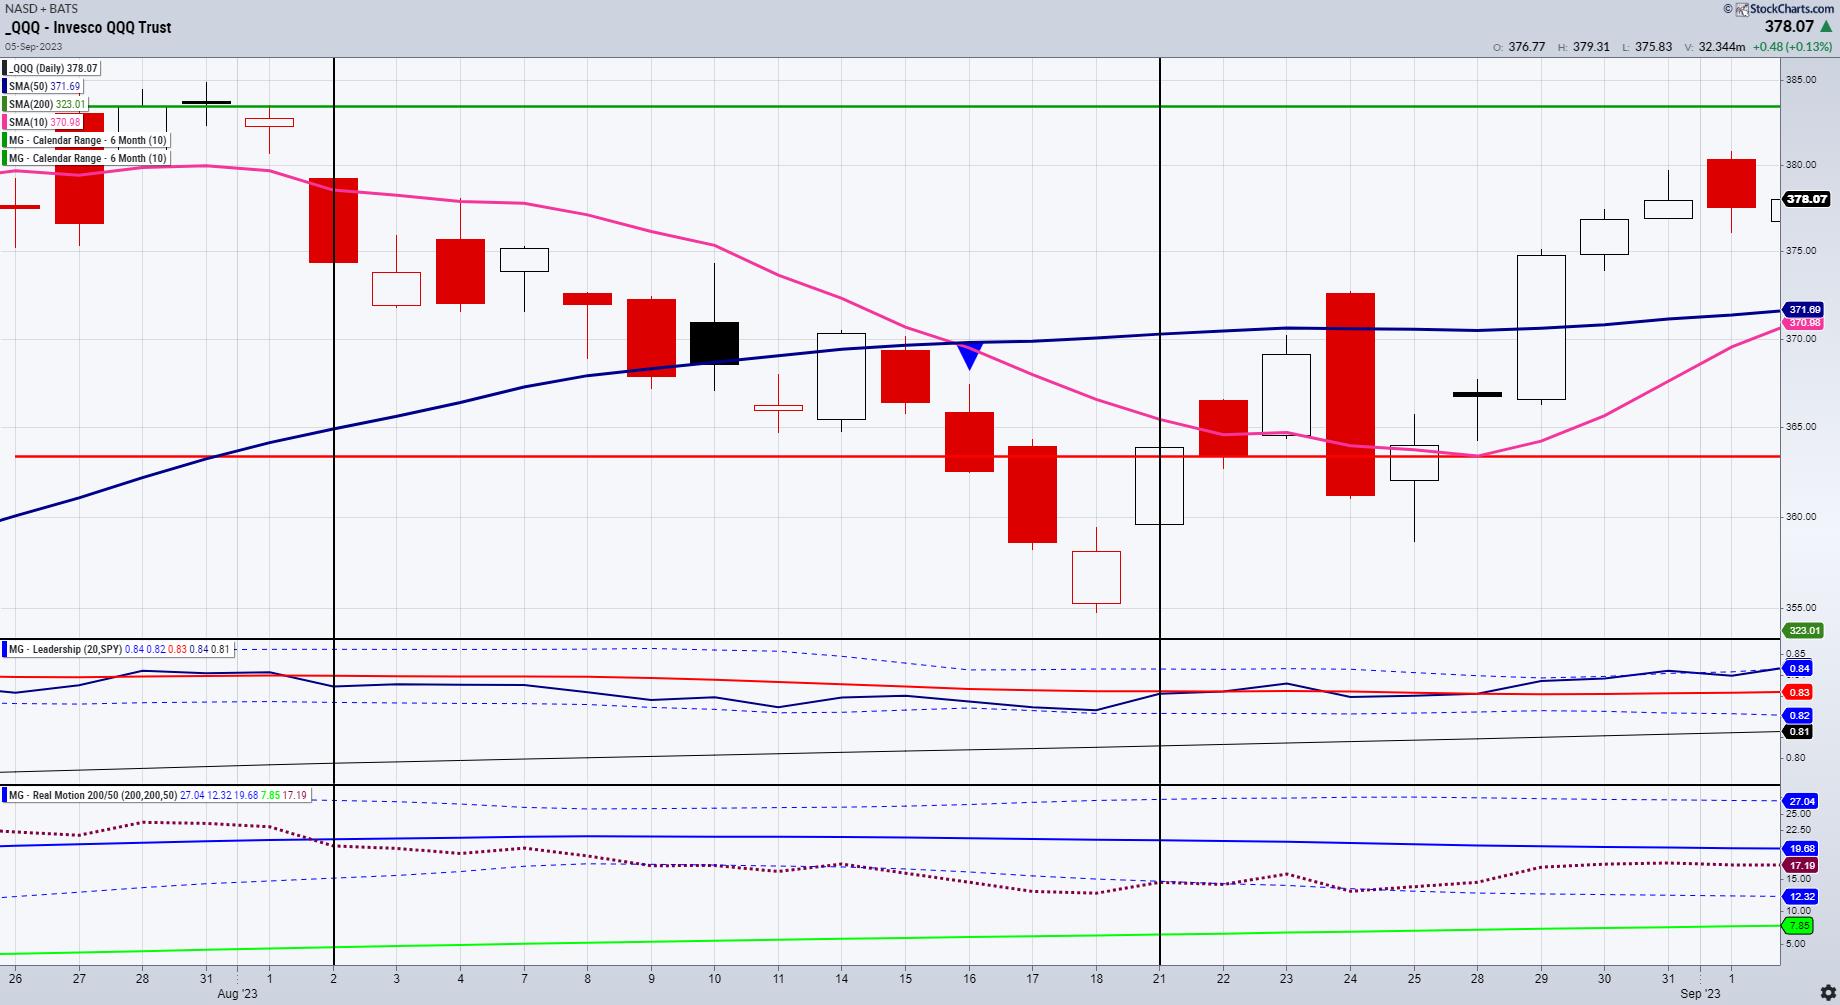
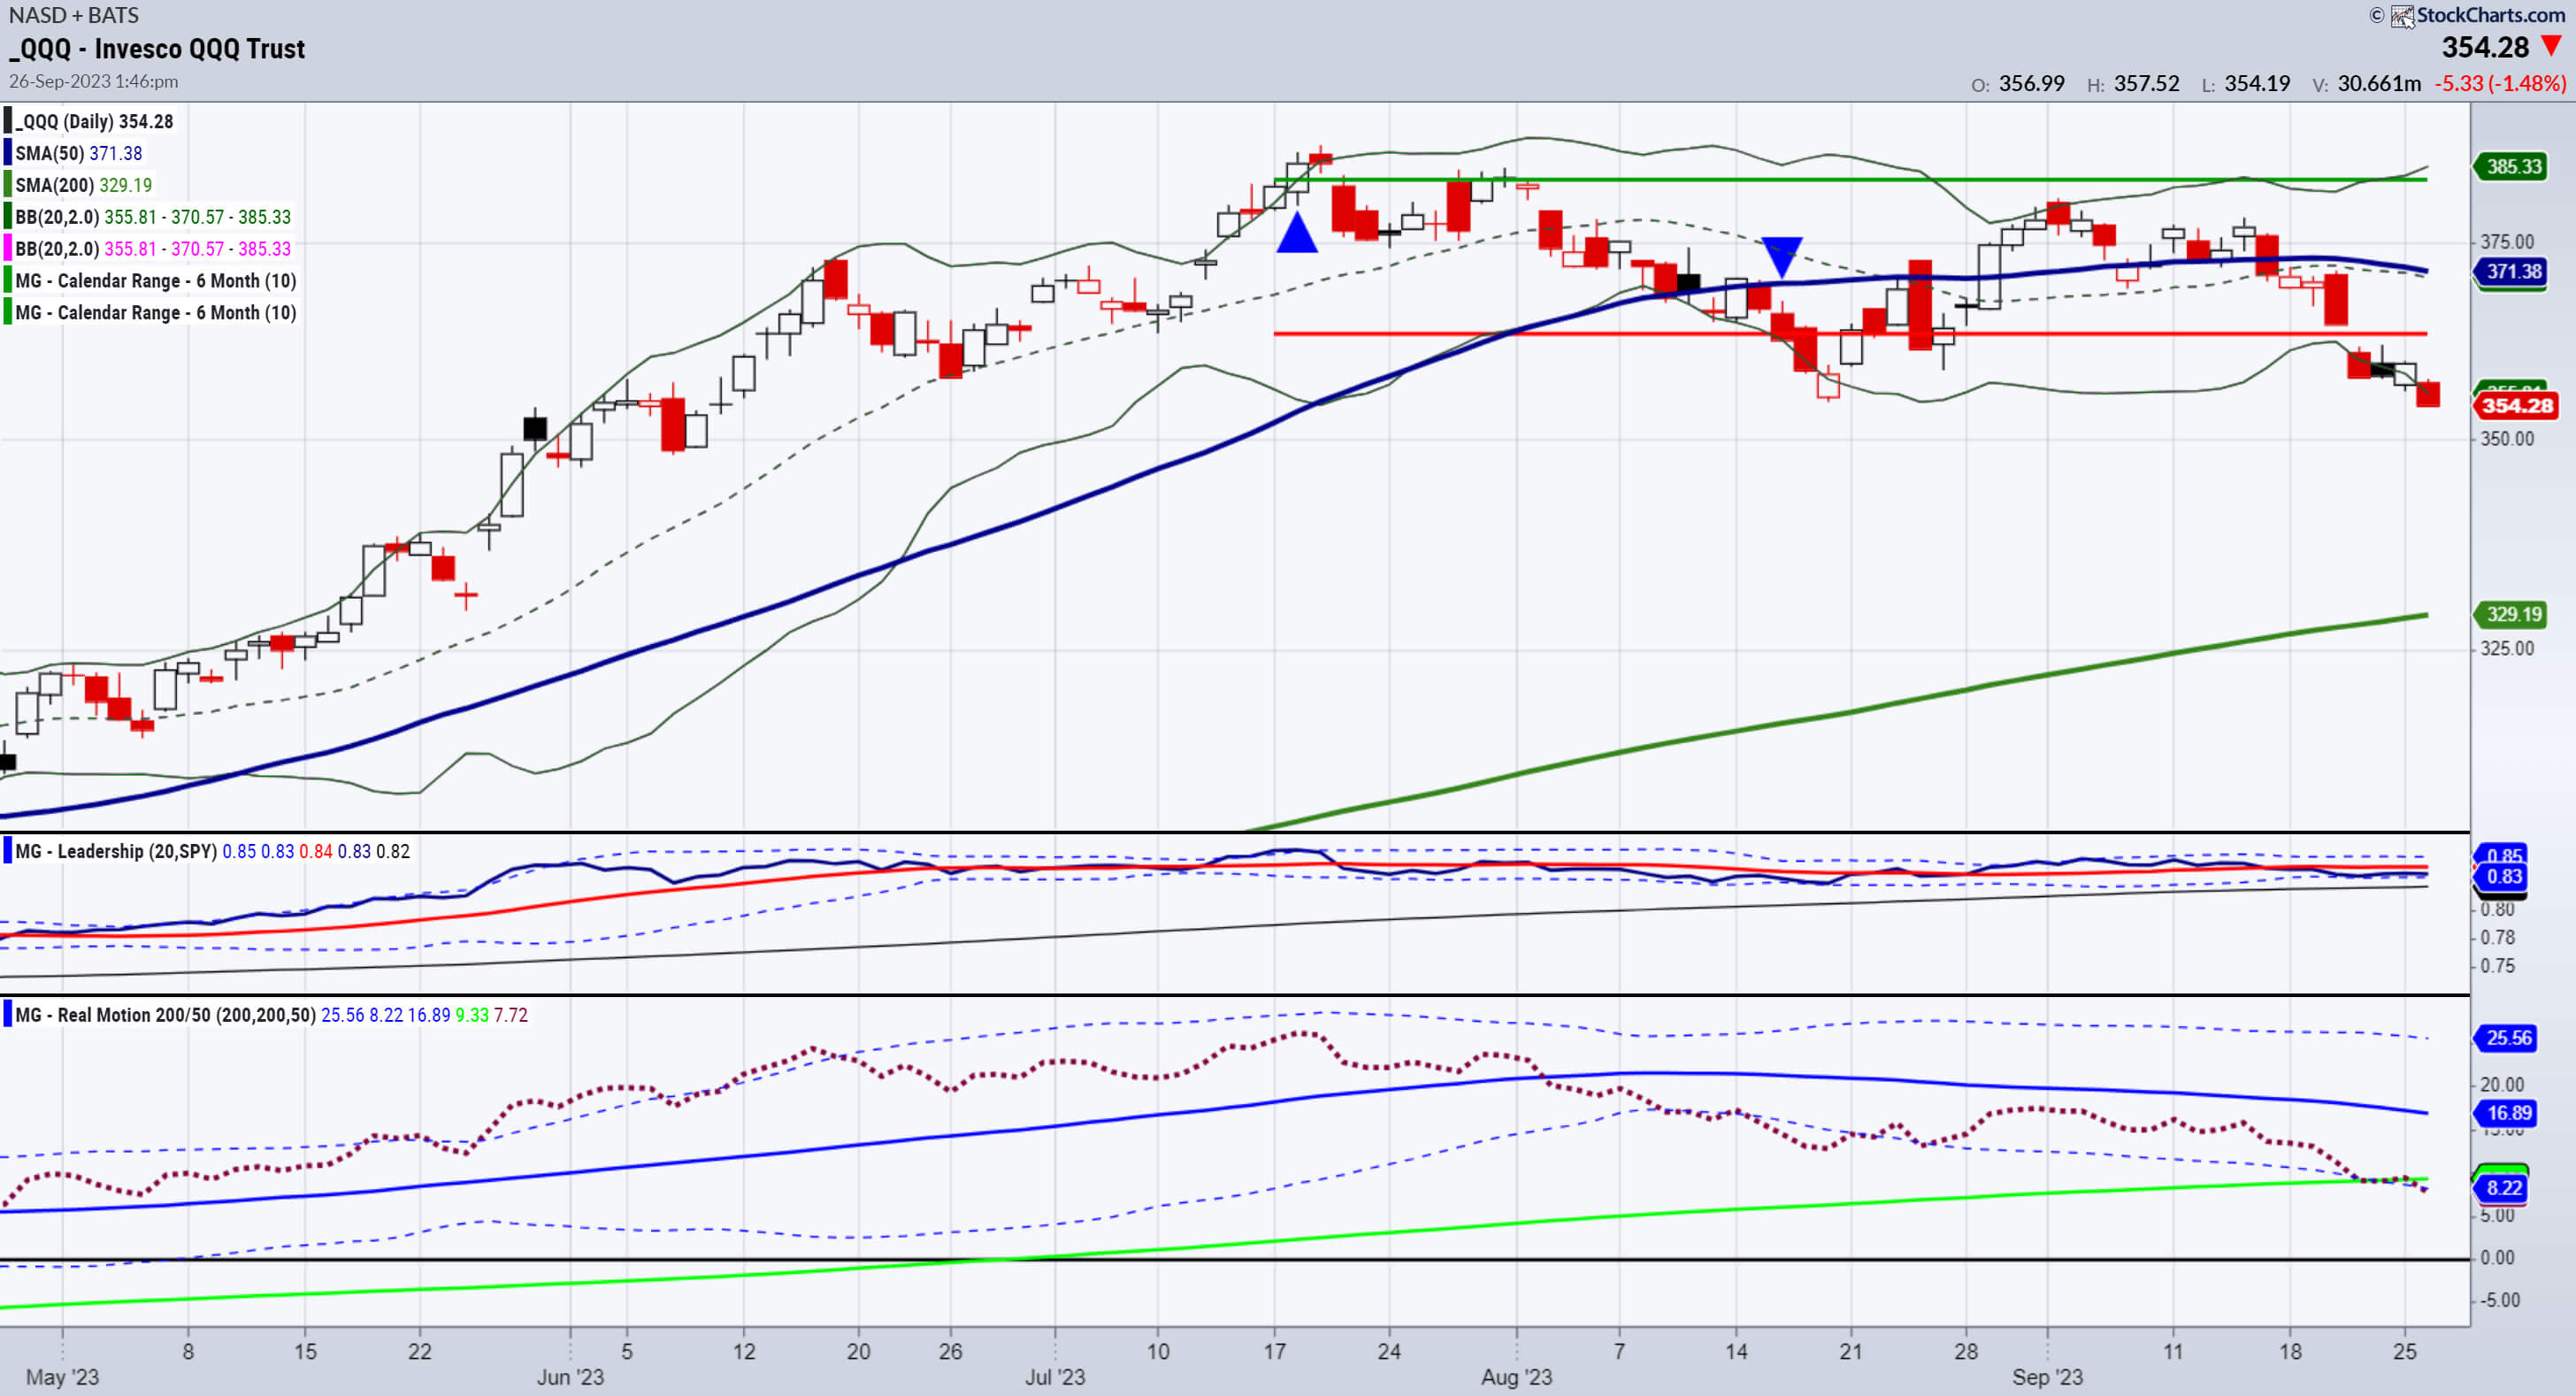
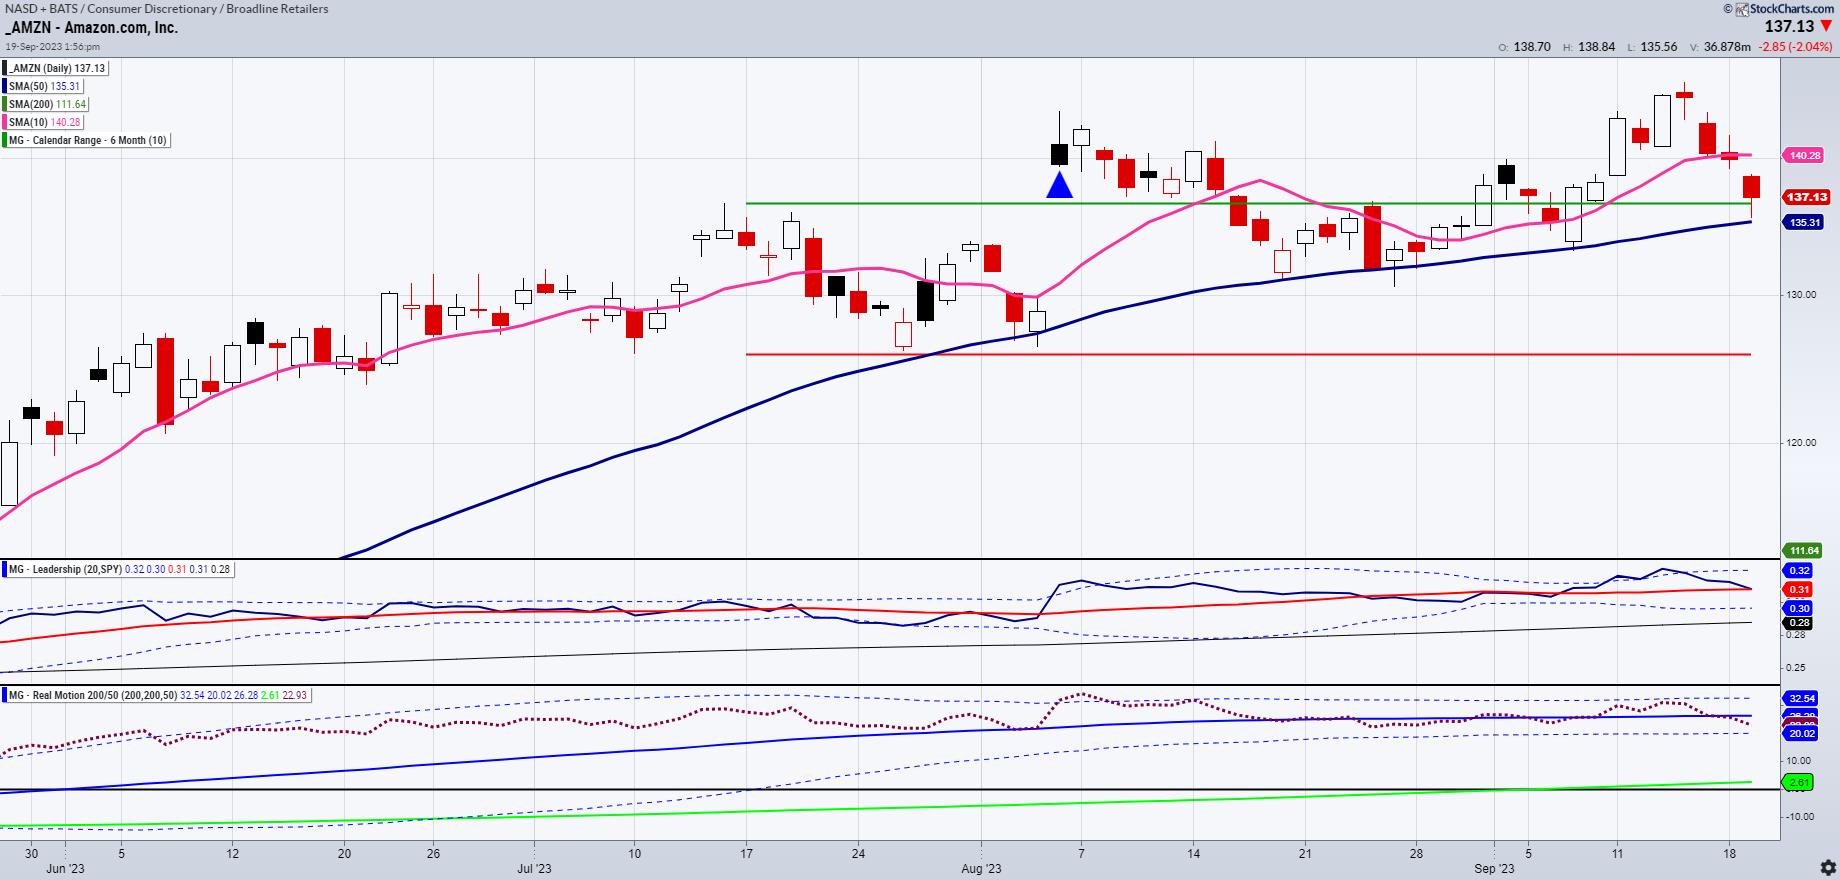
When Calendar Ranges, Leadership, Momentum and Price Align
We are so excited that StockCharts.com is now offering you our ACP plugins, we had to write about it for today's Daily, especially since you can read anywhere the thousands of differing opinions on what Powell said today and the implications for the market. Simply put, these...
READ MORE
MEMBERS ONLY
Wage Inflation: The Stats and the Underlying Implications
While the UAW strike continues, and the debate on how much it matters in the scheme of things rages on, other wage trends are emerging.
Amazon (AZMN) today announced it will hire about 250,000 logistics personnel for the holiday season at a wage of $20.50 per hour. The...
READ MORE
MEMBERS ONLY
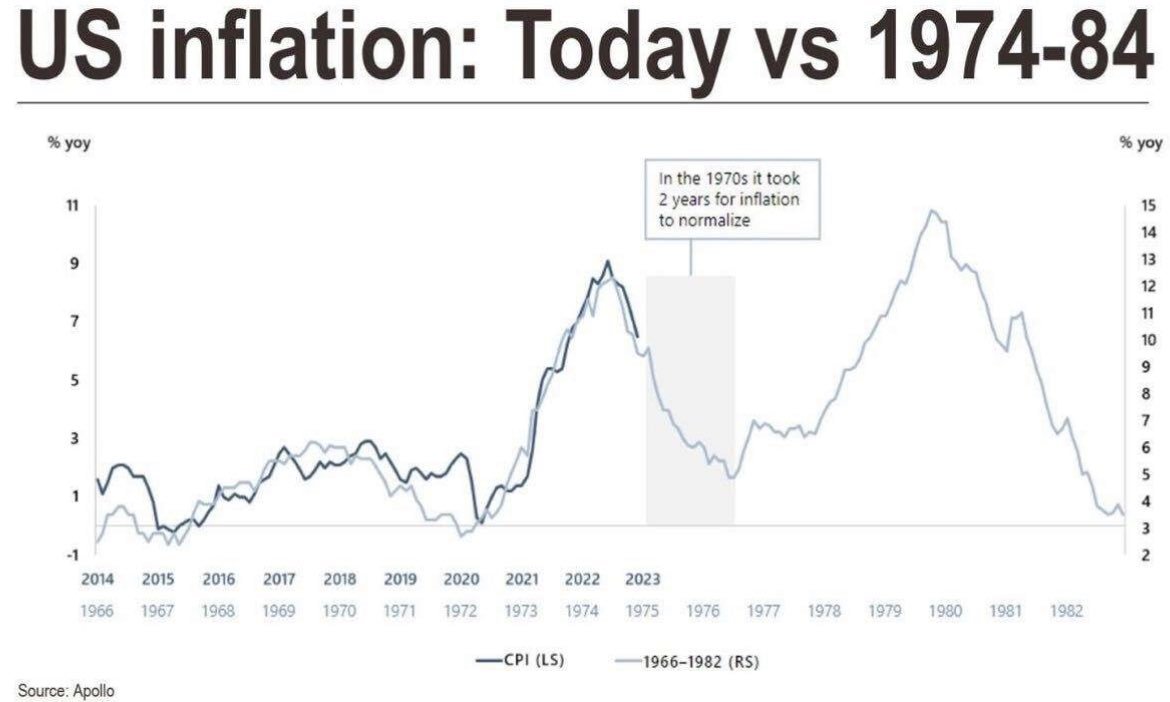
History Rhymes: 1974-1976 vs. 2022-2024?
How many of you have heard me say that commodities are inherently volatile?
Clearly, from this chart, you can see that after the oil rally in the mid 1970s, the CPI went from nearly 9% in 1974 down to 2% in 1976. Sugar, my favorite barometer of inflation, ran to...
READ MORE
MEMBERS ONLY
Fresh Look at Long Bonds
I doubt any of our readers are too surprised by the CPI reading coming in a bit hotter than expected.
The bulk of it was in energy costs. Food costs were, mixed with bread and meat, up, while eggs and milk were down. Services inflation was up slightly, while shelter...
READ MORE
MEMBERS ONLY
Finding and Trading Instrument Bottoms
In June, we wrote about the bottom in oil and cannabis through USO and MSOS (ETFs) respectively. In July, we wrote about the potential top in NASDAQ and SPY. In August, we wrote about the importance of the retail sector; XRT is below the July calendar range and a major...
READ MORE
MEMBERS ONLY
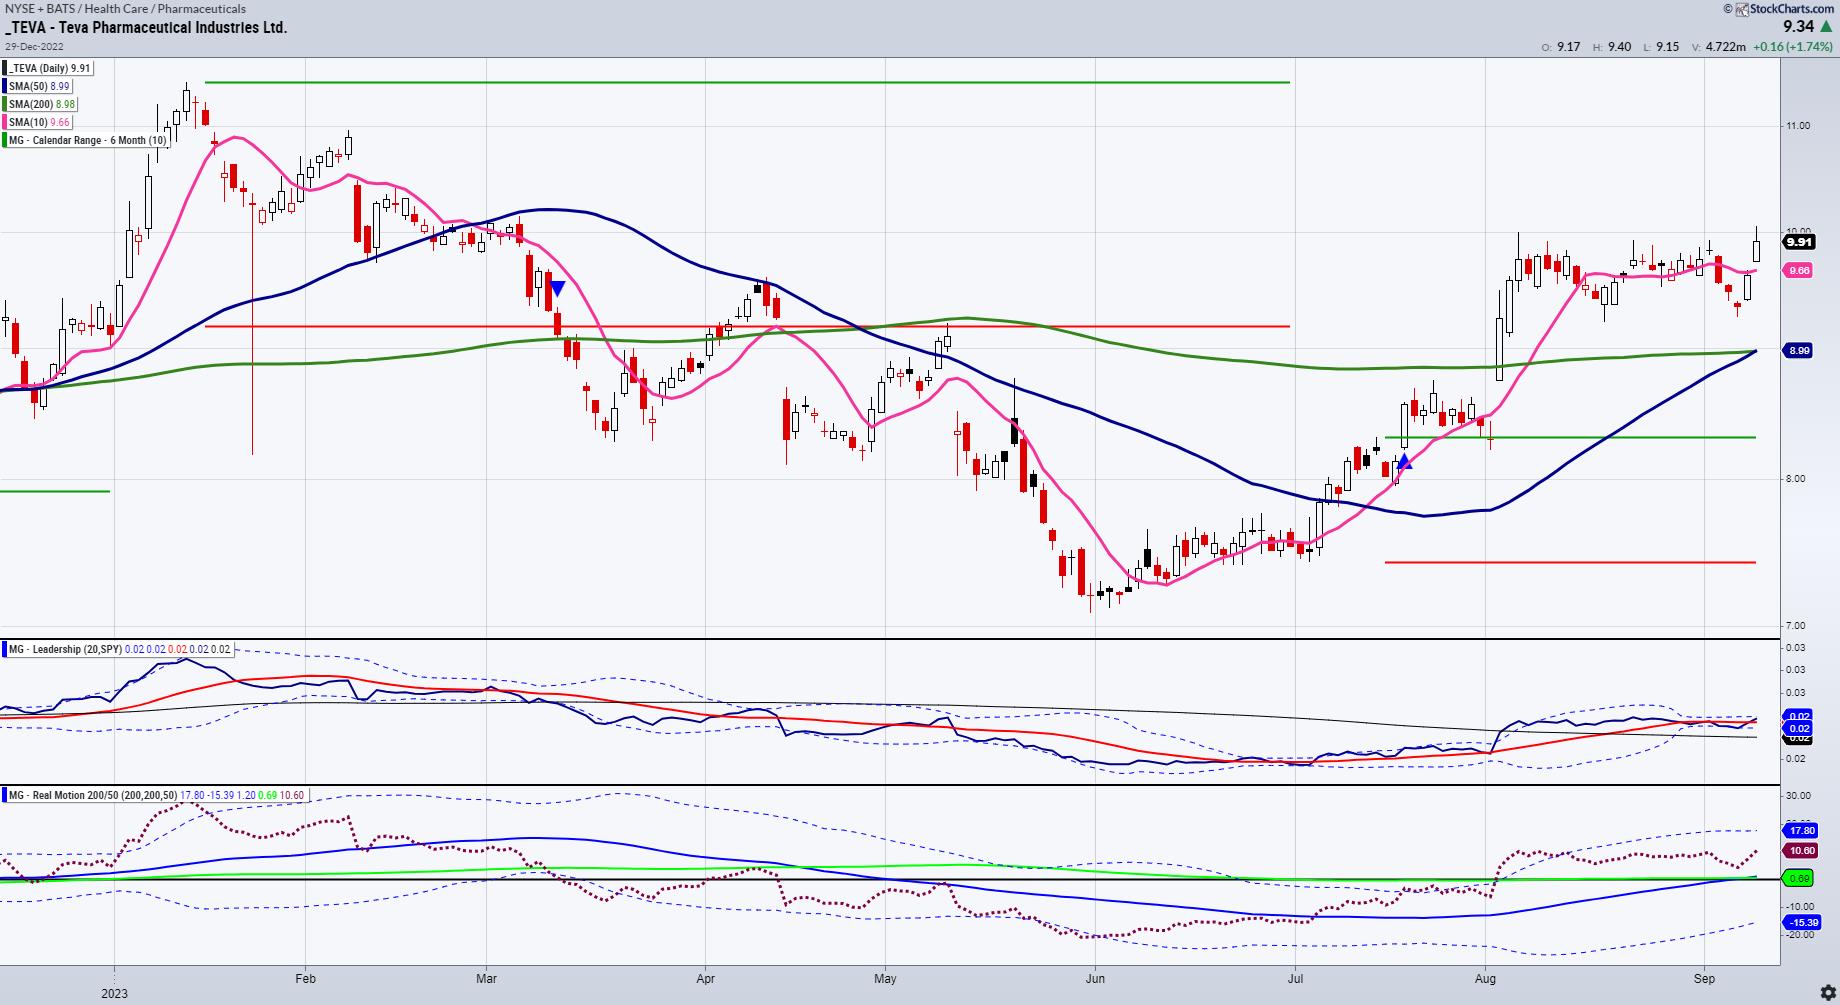
TEVA: A Pharma Stock to Watch
Every week, I am invited on Business First AM with Angela Miles to discuss the market and give a stock pick. This week, I covered TEVA, a stock I have talked about a few times and one, full disclosure, we are positioned in.
First, about the company:
Teva Pharmaceuticals is...
READ MORE
MEMBERS ONLY

Can the Windowmaker Natural Gas Resuscitate?
Probably the worst or at least one of the worst performers in the overall market and in the commodities market, natural gas is choppy and lifeless. So why write about it?
For starters, we love an underdog. Perhaps a bit too contrarian, as the reasons for the decline in natural...
READ MORE
MEMBERS ONLY
Technical Correction? Or Return of the Bear Market?
On July 5th, Mish wrote an article called "Sell in July and Go Away? Calendar Range Reset".
In that article, she noted, "should IWM fail to clear the calendar range high and worse, break down under a new 6-month calendar range low[...] it would be hard to...
READ MORE
MEMBERS ONLY
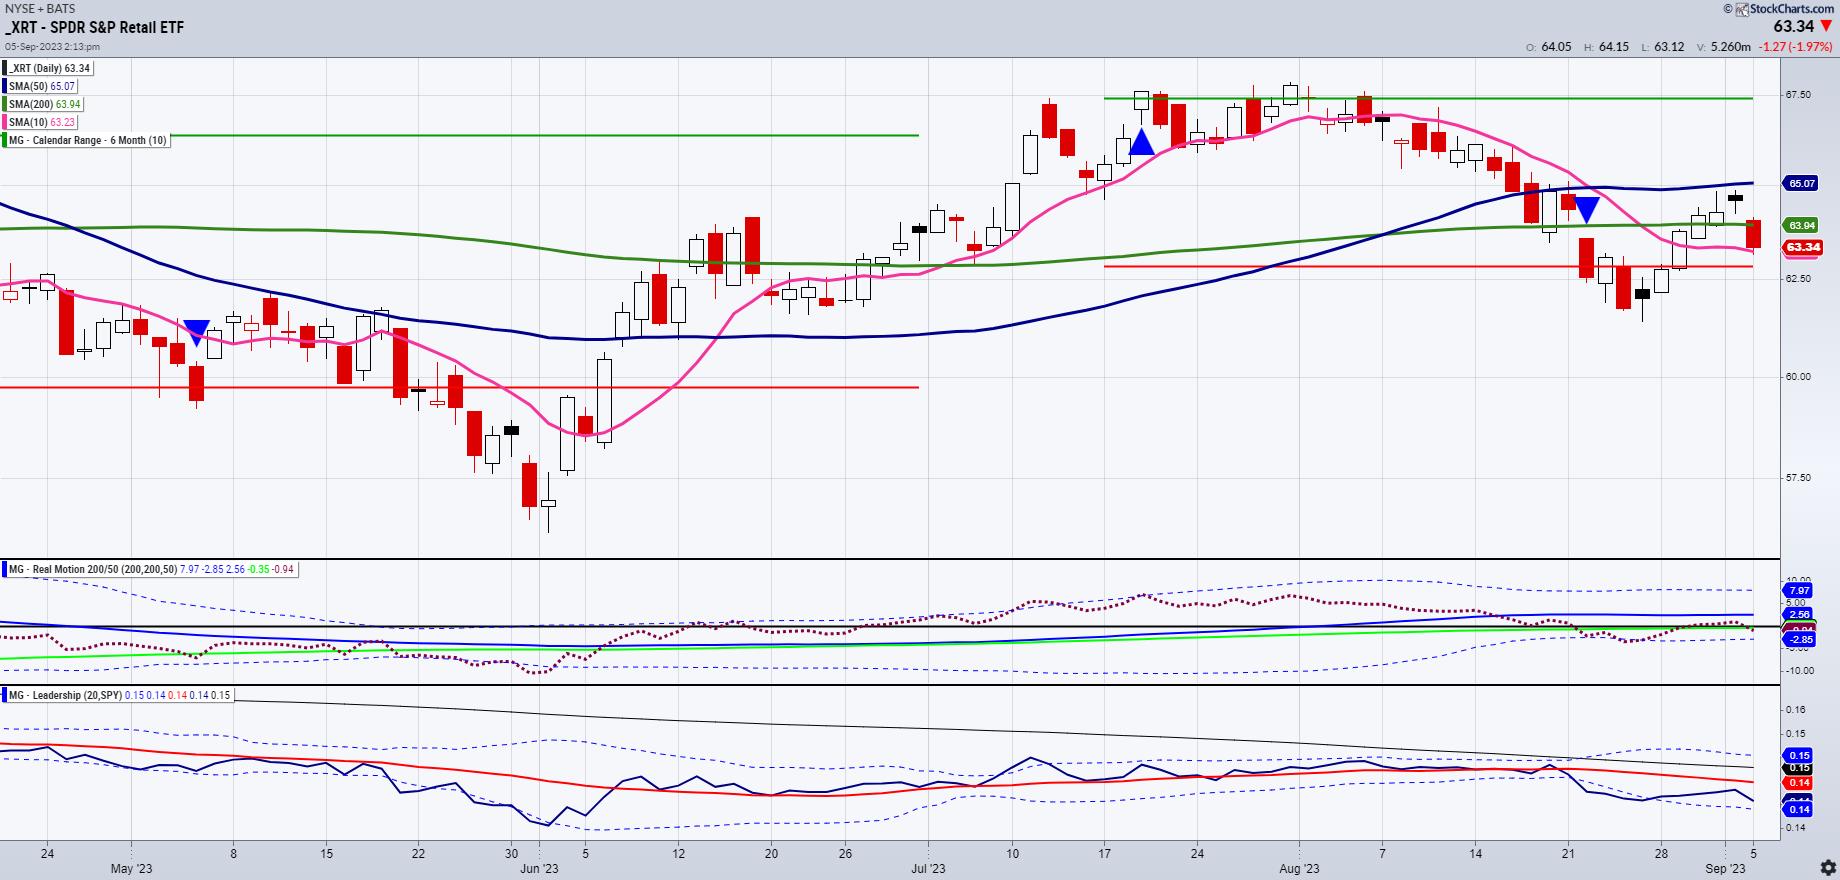
It's Really All About the Retail Sector Now
This entire year, retail, as measured by the ETF XRT (a.k.a. the Granny of the Economic Modern Family), has underperformed the SPY and QQQs. Encumbered by higher interest rates, higher oil prices, higher inflation, higher insurance costs, and a burgeoning credit card debt, we have wondered many times...
READ MORE
MEMBERS ONLY
The GDP PCE ADP Waltz
Conference Board Economic Forecast:
Looking into 2024, we expect the volatility that dominated the US economy over the pandemic period to diminish. In the second half of 2024, we forecast that overall growth will return to more stable pre-pandemic rates, inflation will drift closer to 2 percent, and the Fed...
READ MORE
MEMBERS ONLY

Will the Rotation to Small Caps Hold and Last THIS TIME?
In this special edition of StockCharts TV'sThe Final Bar, guest host Mish Schneider (MarketGauge) steps in for Dave. Mish puts her own spin on the Market Recap, starting with the indices and exploring sectors using her "Economic Modern Family" analysis.
Mish then sits down with Keith...
READ MORE
MEMBERS ONLY
Bonds, Secular Bear Market, and the Impact on Small Caps
Bonds have had one of the worst years in modern times and one of the fastest rates of interest rate rises.
The good news is the market has absorbed the bond's performance. A better risk-on environment is when the SPY outperforms the long bonds. The same is true...
READ MORE
MEMBERS ONLY
Can Small Caps Lead the Market Higher? A Video Analysis
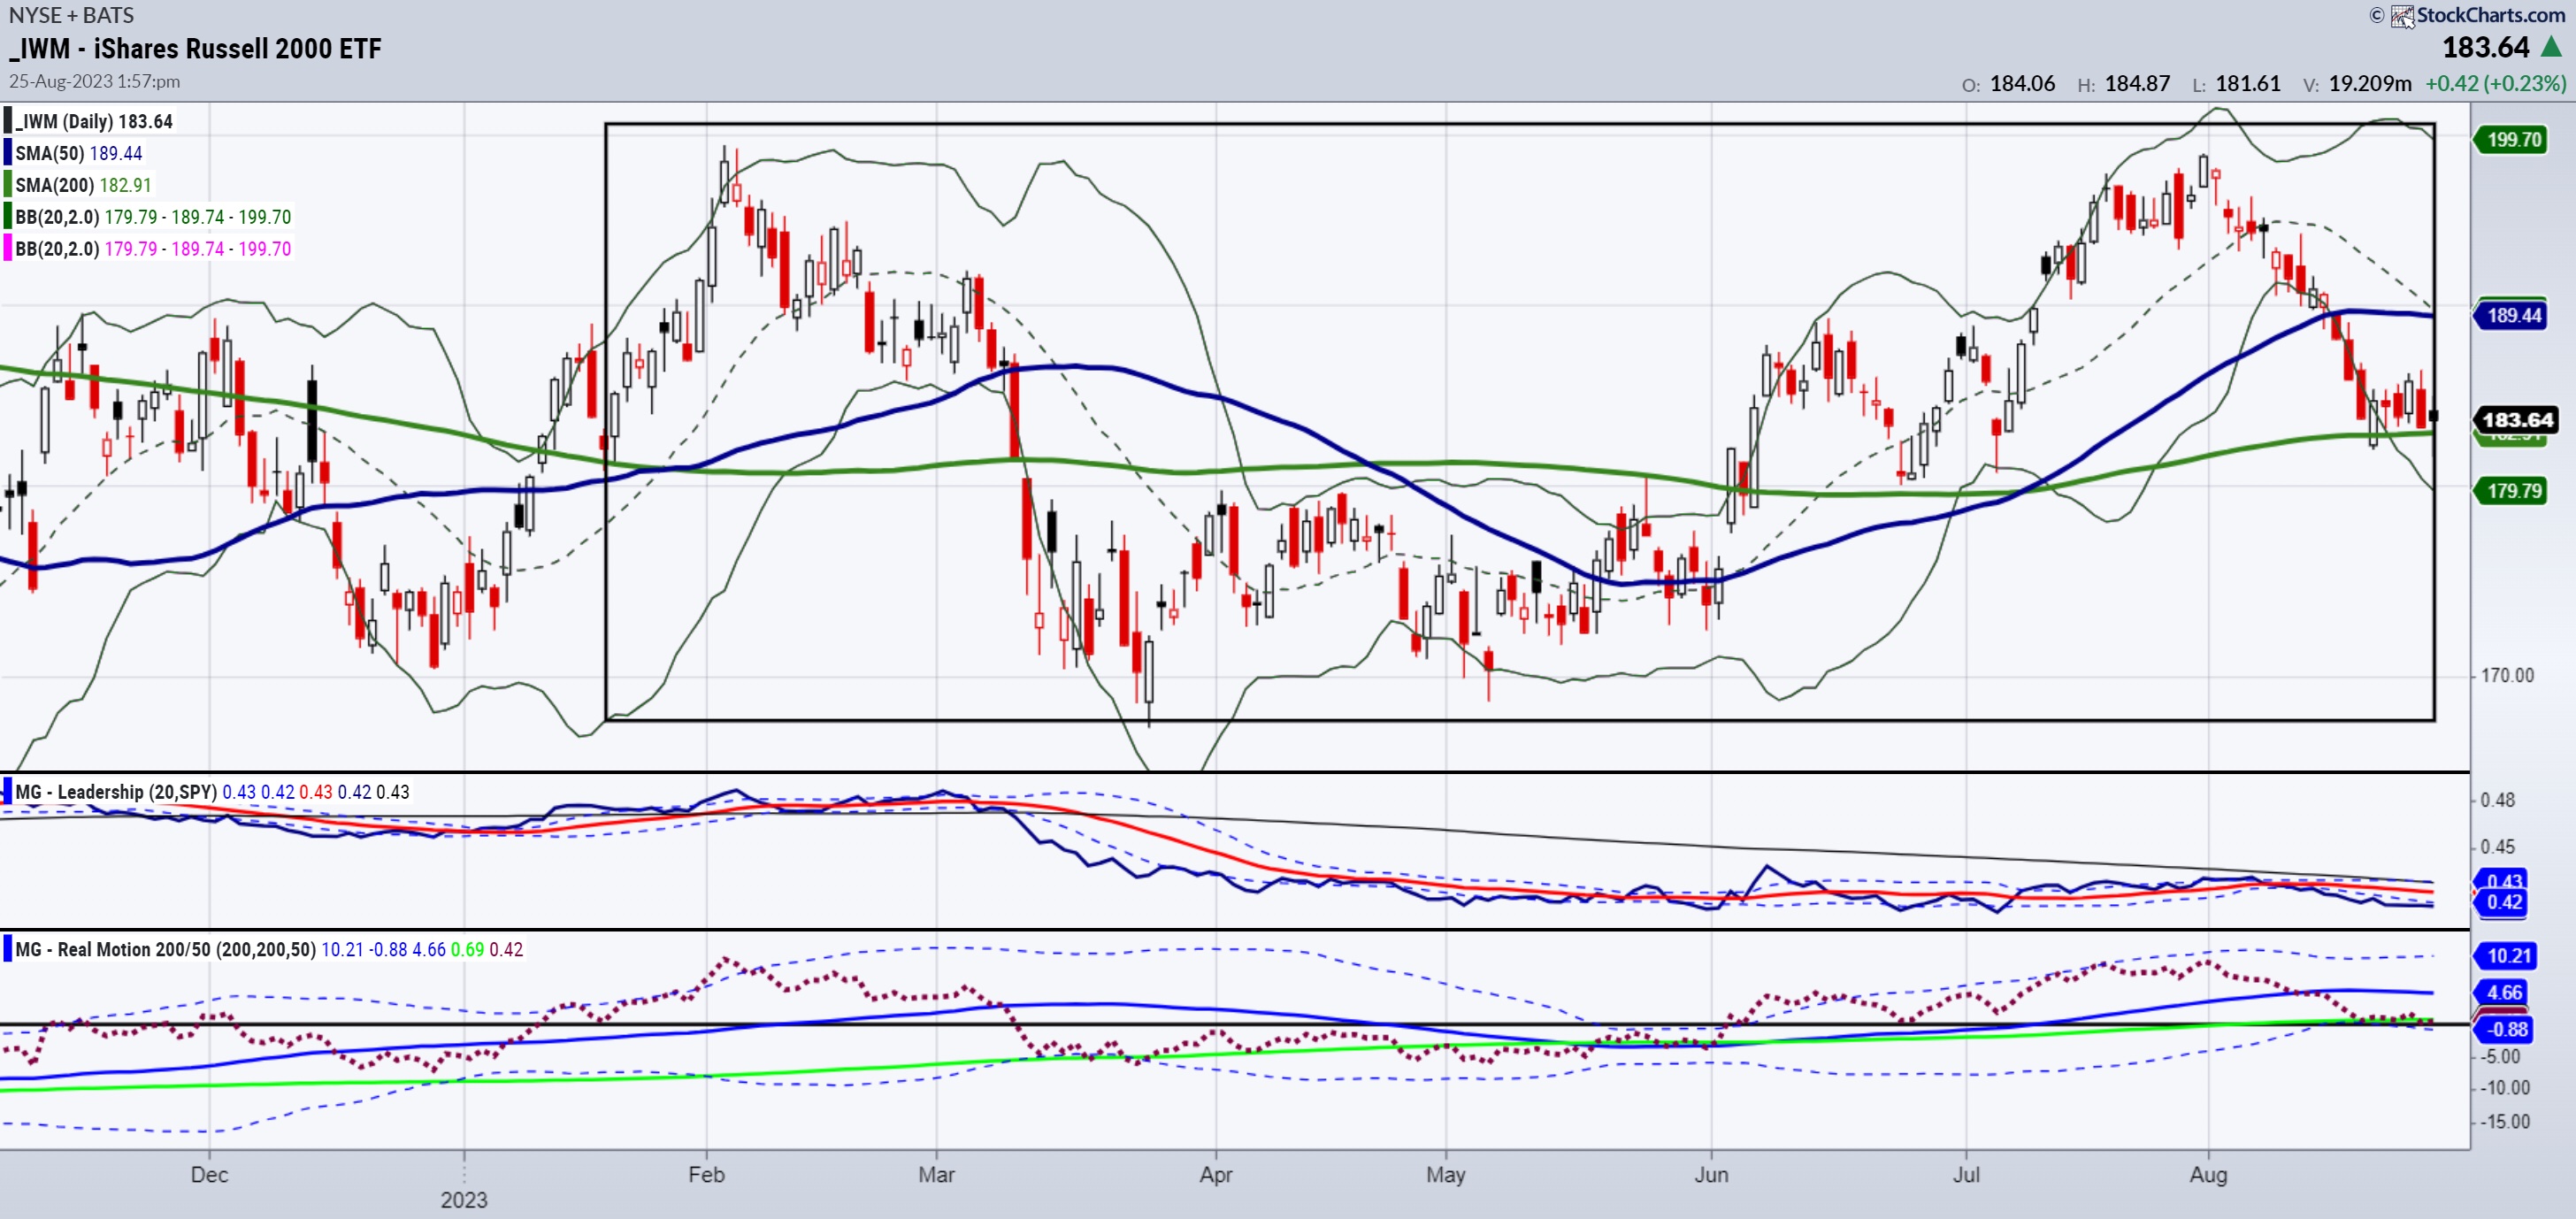
Small caps, as measured by IWM, are key for the fall and heading into 2024. You can also look at the S&P 600 (SML).
IWM could be forming an inverted head-and-shoulders bottom, going back from the start of 2023. (See the rectangle area of the IWM chart). SPY...
READ MORE
MEMBERS ONLY
MarketGauge's Market Beat Rarely Misses a Beat!
Over the course of our writing the Daily, it has served as a reliable and remarkable guide for investors, traders, and investments.
For example, looking most recently on August 22nd, we wrote about watching the dollar decline and TLTs rising. That is happening. Earlier this week, we wrote about Biotechnology...
READ MORE
MEMBERS ONLY
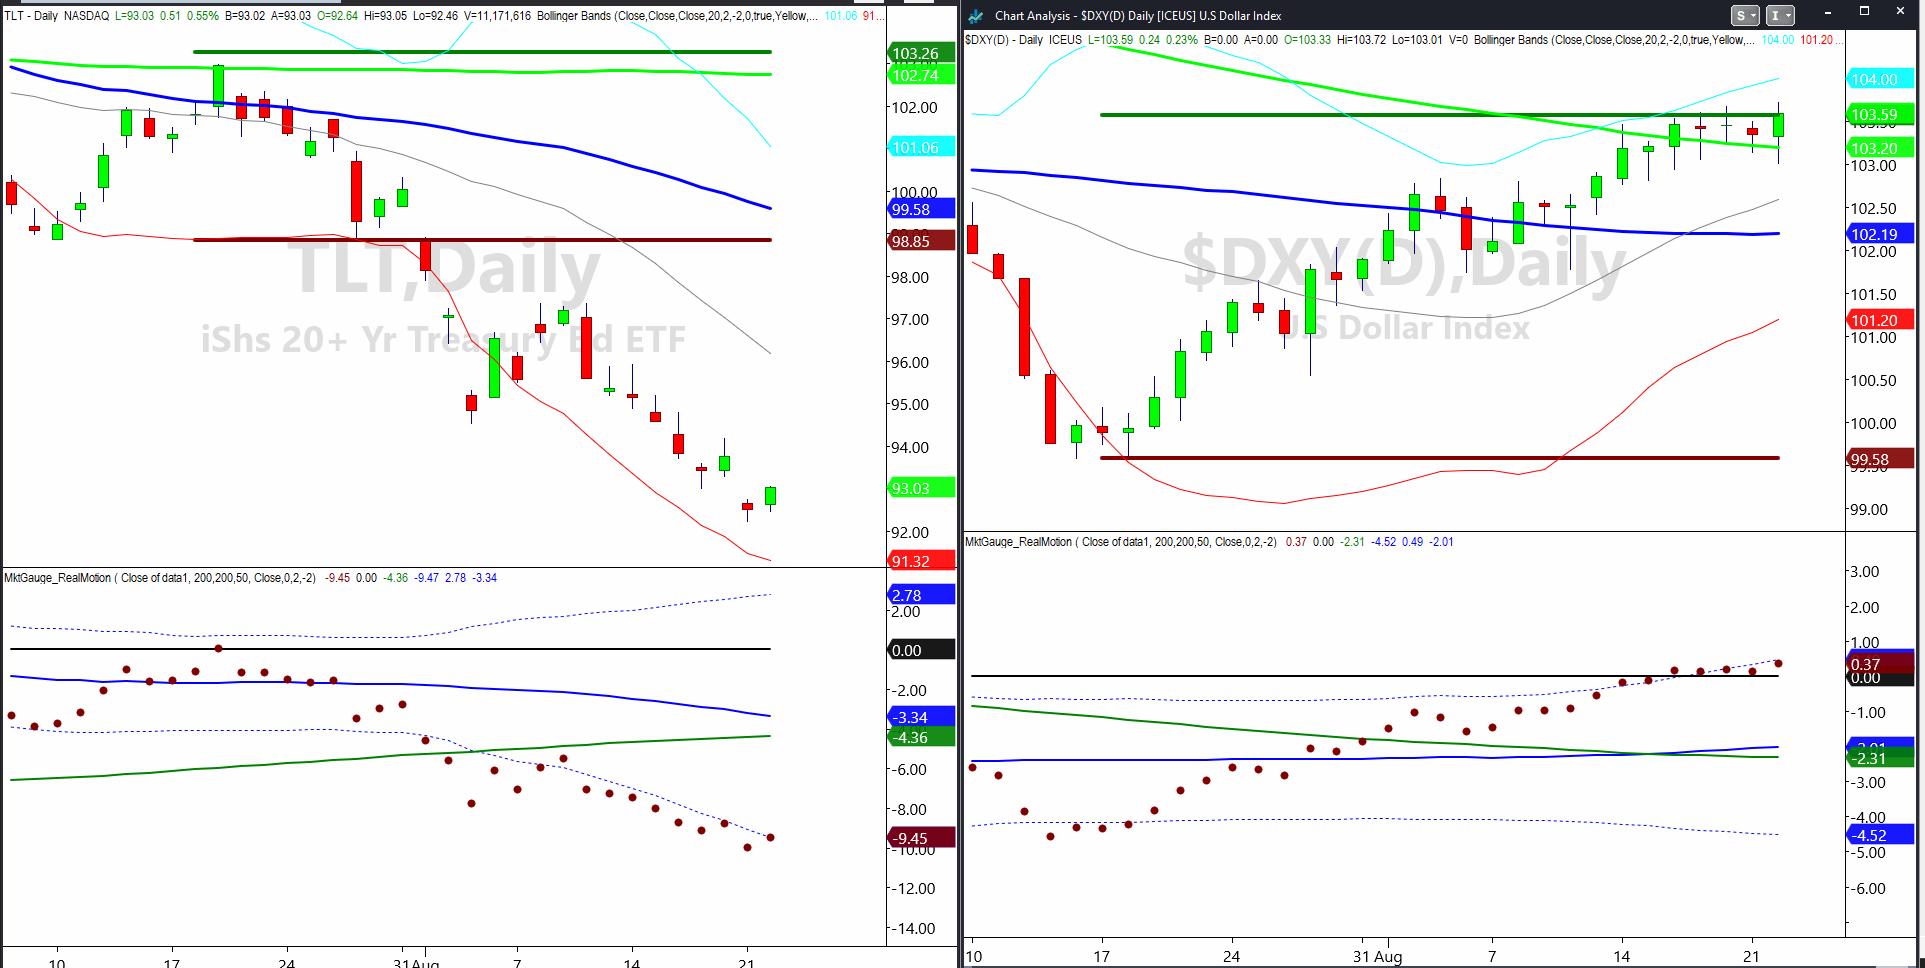
The US Dollar and Long Bonds Doing the Dosey Doe
With BRICS happening ahead of Jackson Hole, we thought it would be good to look at the technical charts on both the dollar and the long bonds.
The chart below shows that BRICS vs. G7 as a share of purchasing power has increased since 1995. With the number of countries...
READ MORE
MEMBERS ONLY
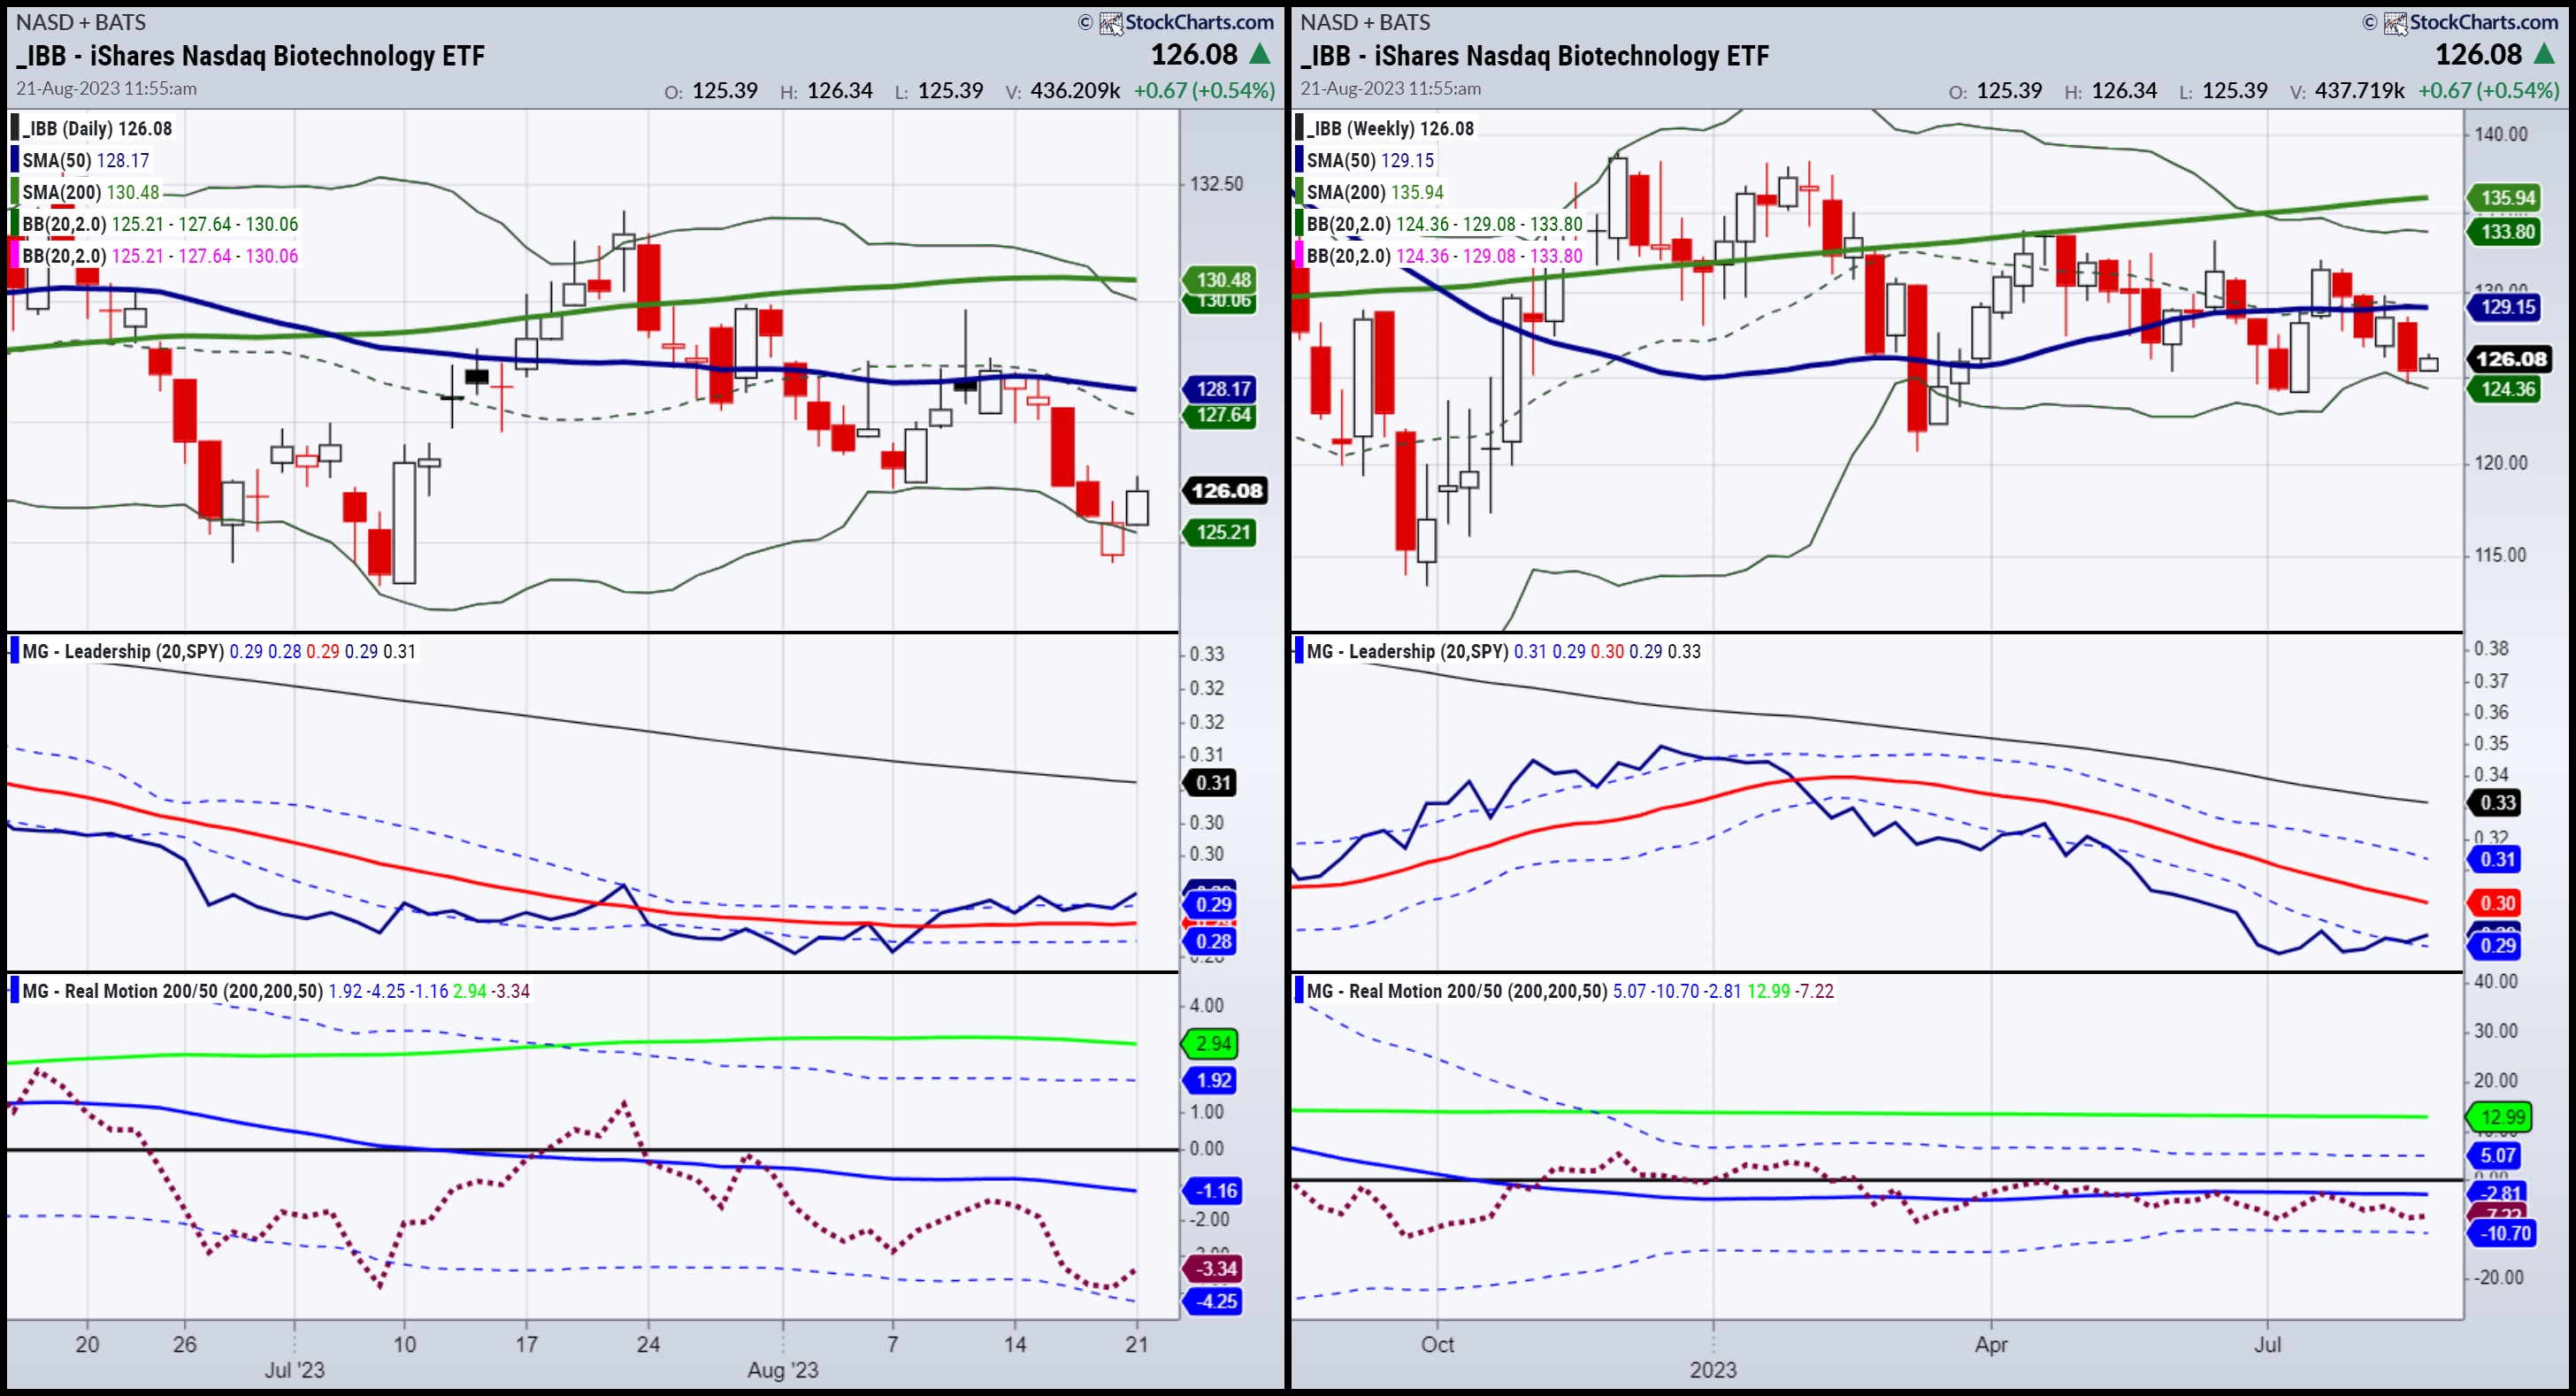
Biotechnology on Drugs
Biotechnology has traded basically sideways since the start of 2023.
In the face of higher rates, stronger dollar, inflation, FDA approvals and busts, and an emerging winter season, the ETF IBB has a serenity to it that appears drug-induced, if you will.
Of the top 10 holdings, Regeneron is the...
READ MORE
MEMBERS ONLY
How High Will U.S. Yields Fly?
On Thursday, August 17th, I sat down with Maggie Lake and Real Vision. During the 36-minute interview, the overriding theme continues to be one of "Stagflation".
Here are the main points:
1. Rates: We don't really know yet the impact of the rapid rate rise.
2....
READ MORE
MEMBERS ONLY
Alibaba and China -- Can They Push Through Resistance?
On August 10, I appeared on CNBC Asia to discuss Alibaba (BABA)'s surprise beat on earnings and China's weak economic data.
I began the segment reminding investors (and myself) that regardless of the news, opinions of analysts and the talking heads, price pays. It is with...
READ MORE
MEMBERS ONLY

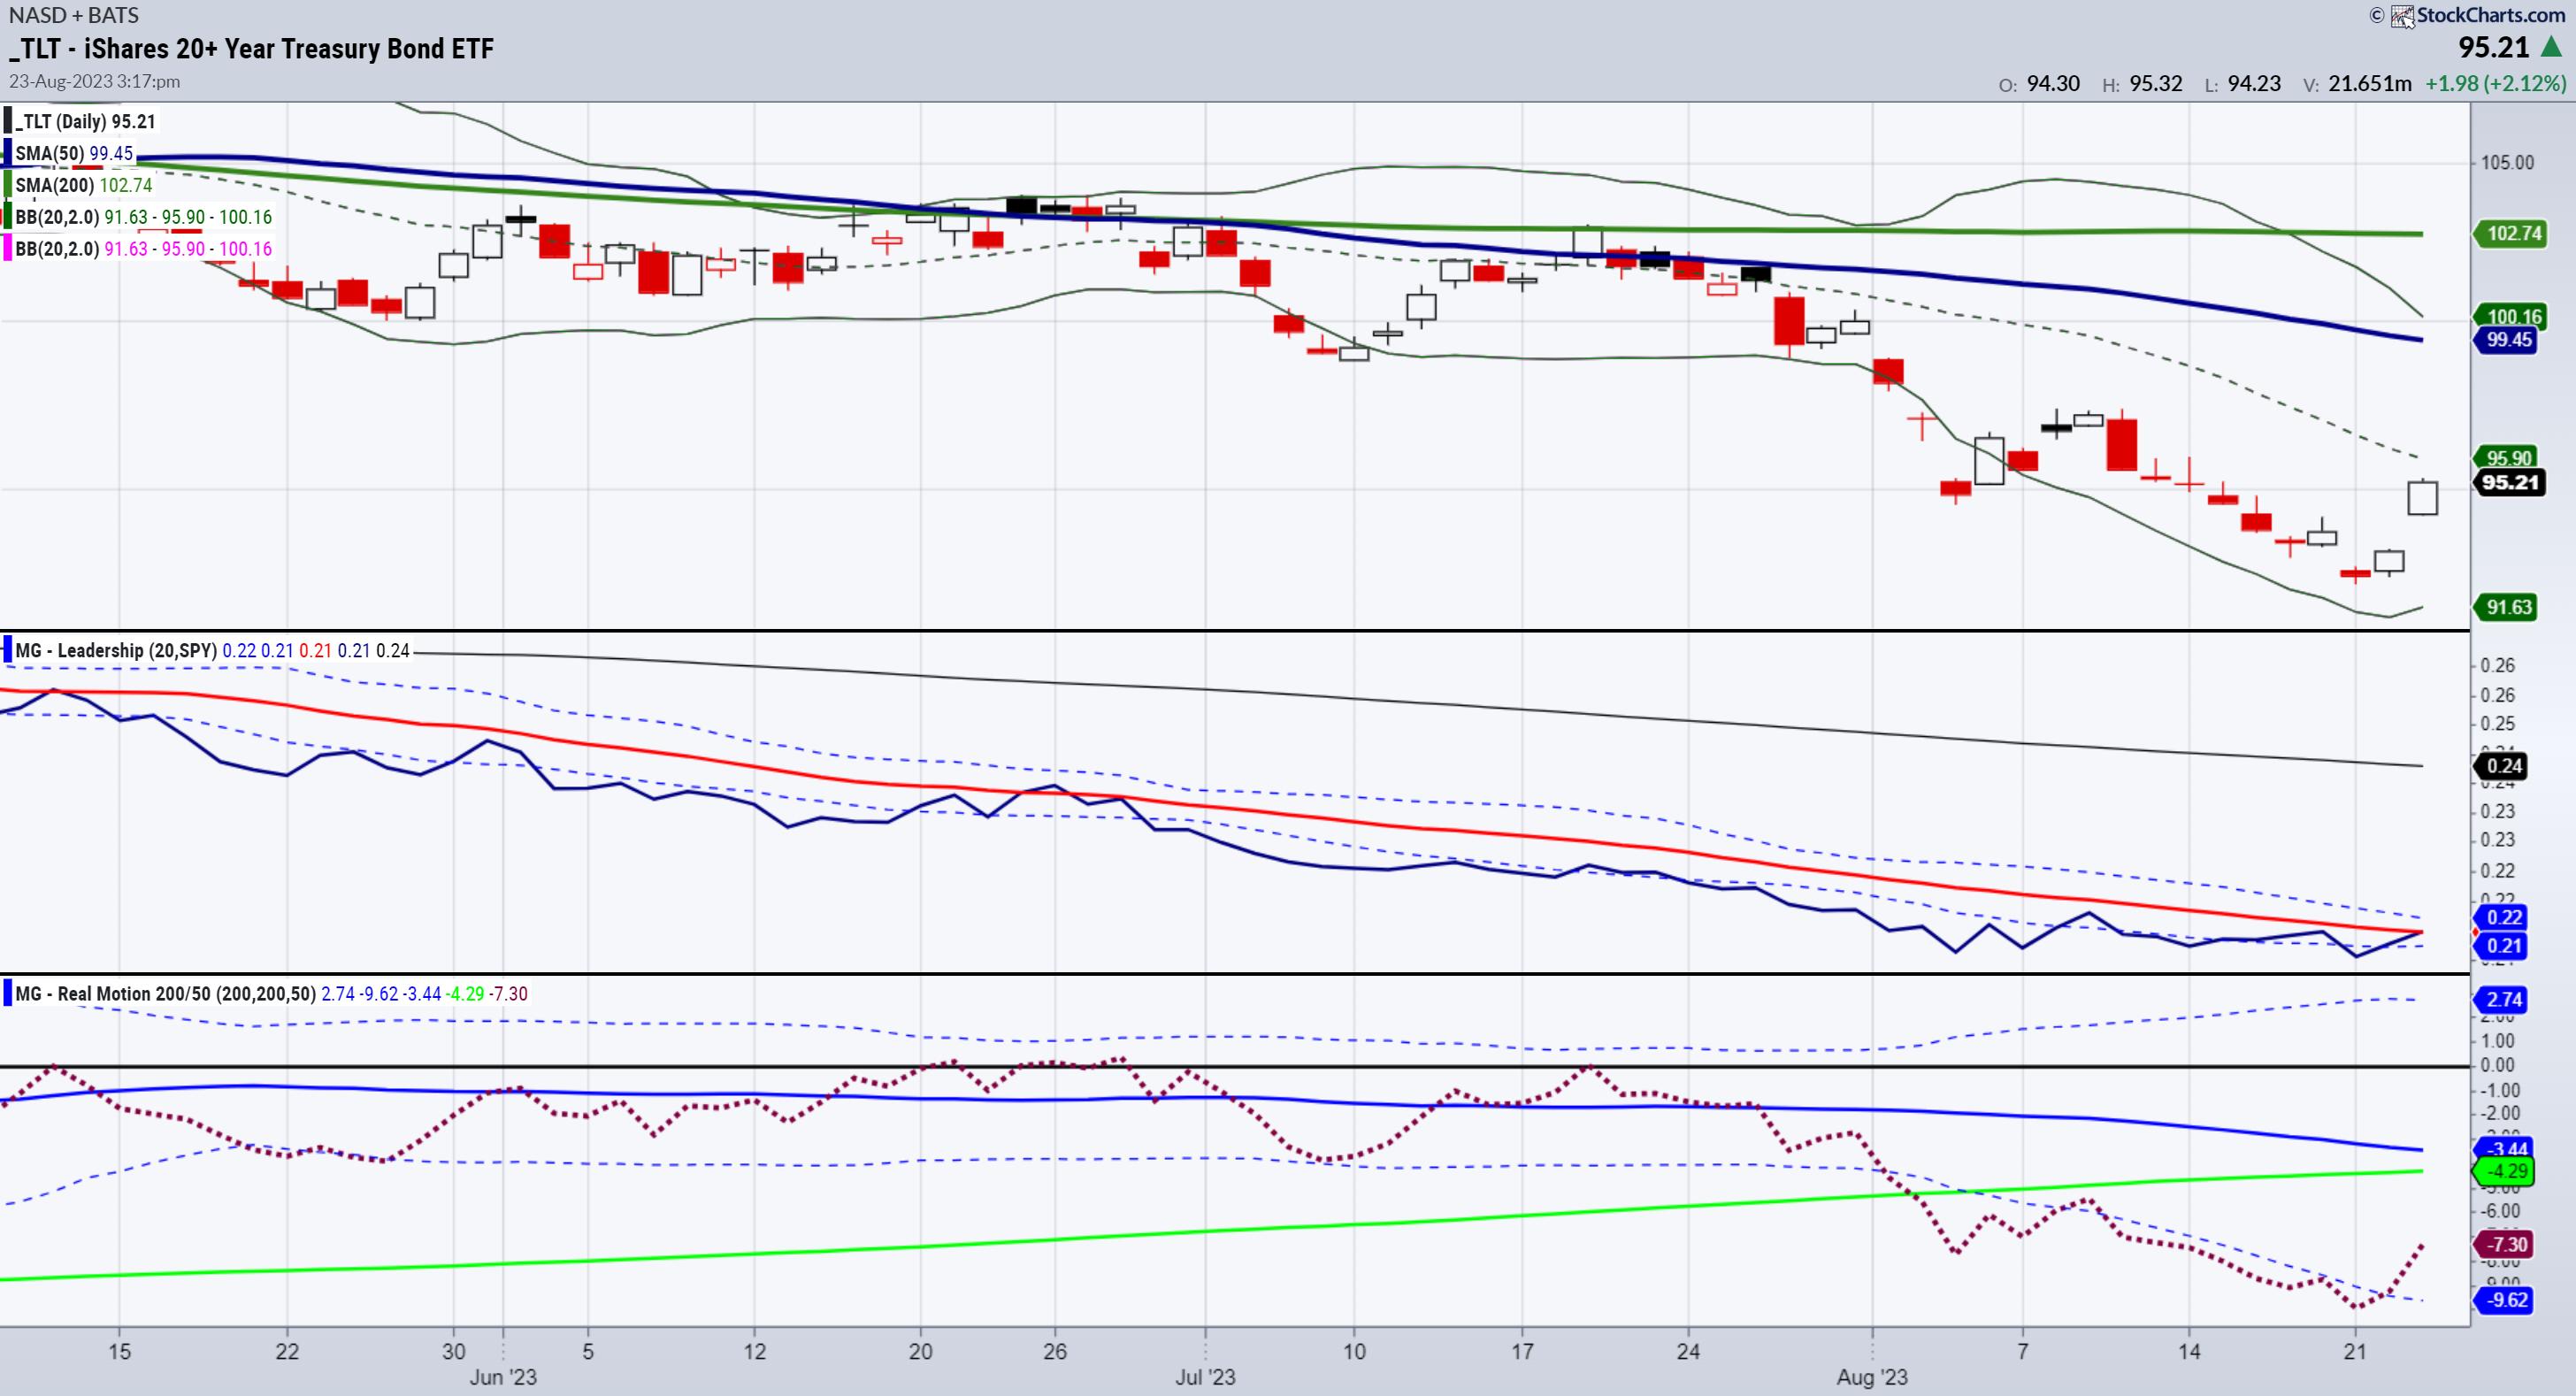
What's Up or Down with Long Bonds (TLT)?
Many, in fact most, retail investors that were surveyed believe that the bonds have bottomed. Bill Ackman came out last week extremely bearish.
Here's the technical skinny. Last week, TLT had a classic reversal bottom on very oversold conditions. Although TLT still underperforms SPY (risk on) according to...
READ MORE
MEMBERS ONLY
July 6-Month Calendar Range Hits August Doldrums, Part 2
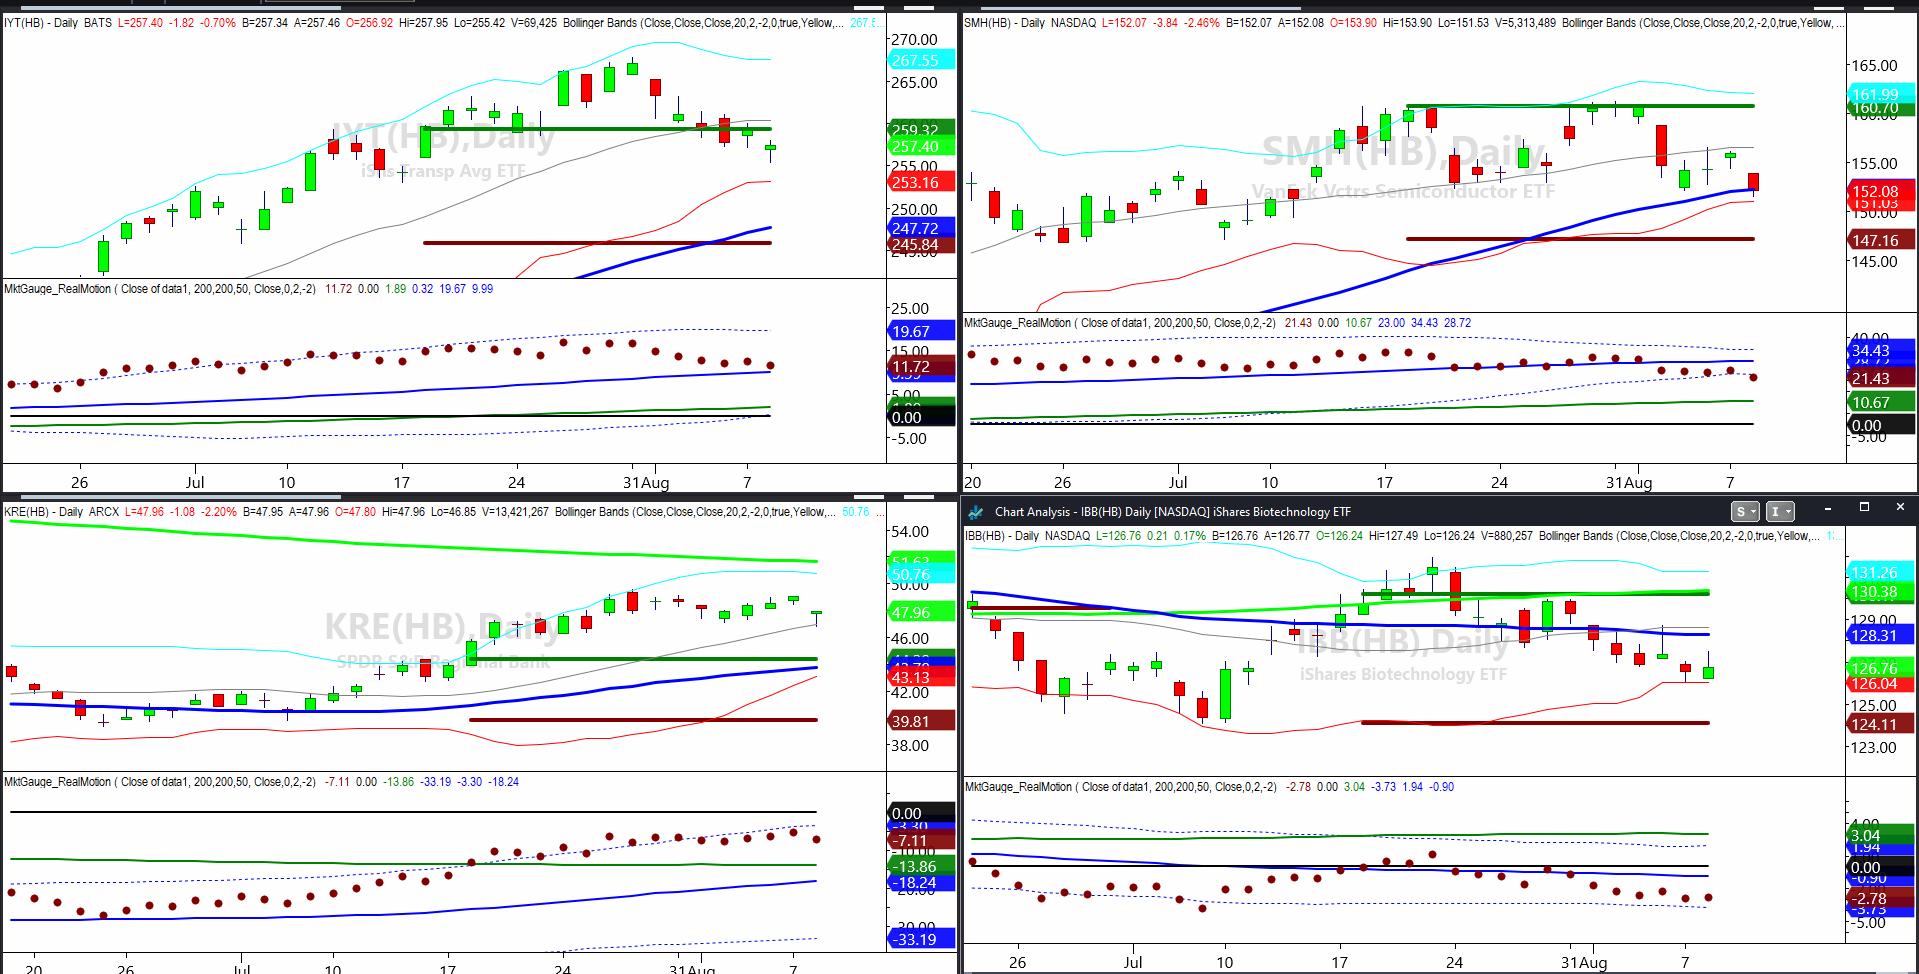
Today, we're continuing to look at the reset of the July 6-month calendar ranges in 4 of the Economic Modern FamilySectors.To remind you, the range is good until the next time it resets in January 2024.
Beginning with Transportation (IYT), as of last Friday, it has begun...
READ MORE
MEMBERS ONLY
The July 6-Month Calendar Range Hits August Doldrums
It's summertime, and the living should be easy. Folks do tend to go away in August as the market tends to chop around on lower volume. This August proves to be no exception thus far.
What is interesting though, is looking at the reset of the July 6-month...
READ MORE
MEMBERS ONLY
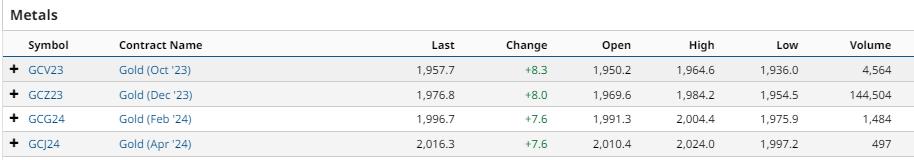
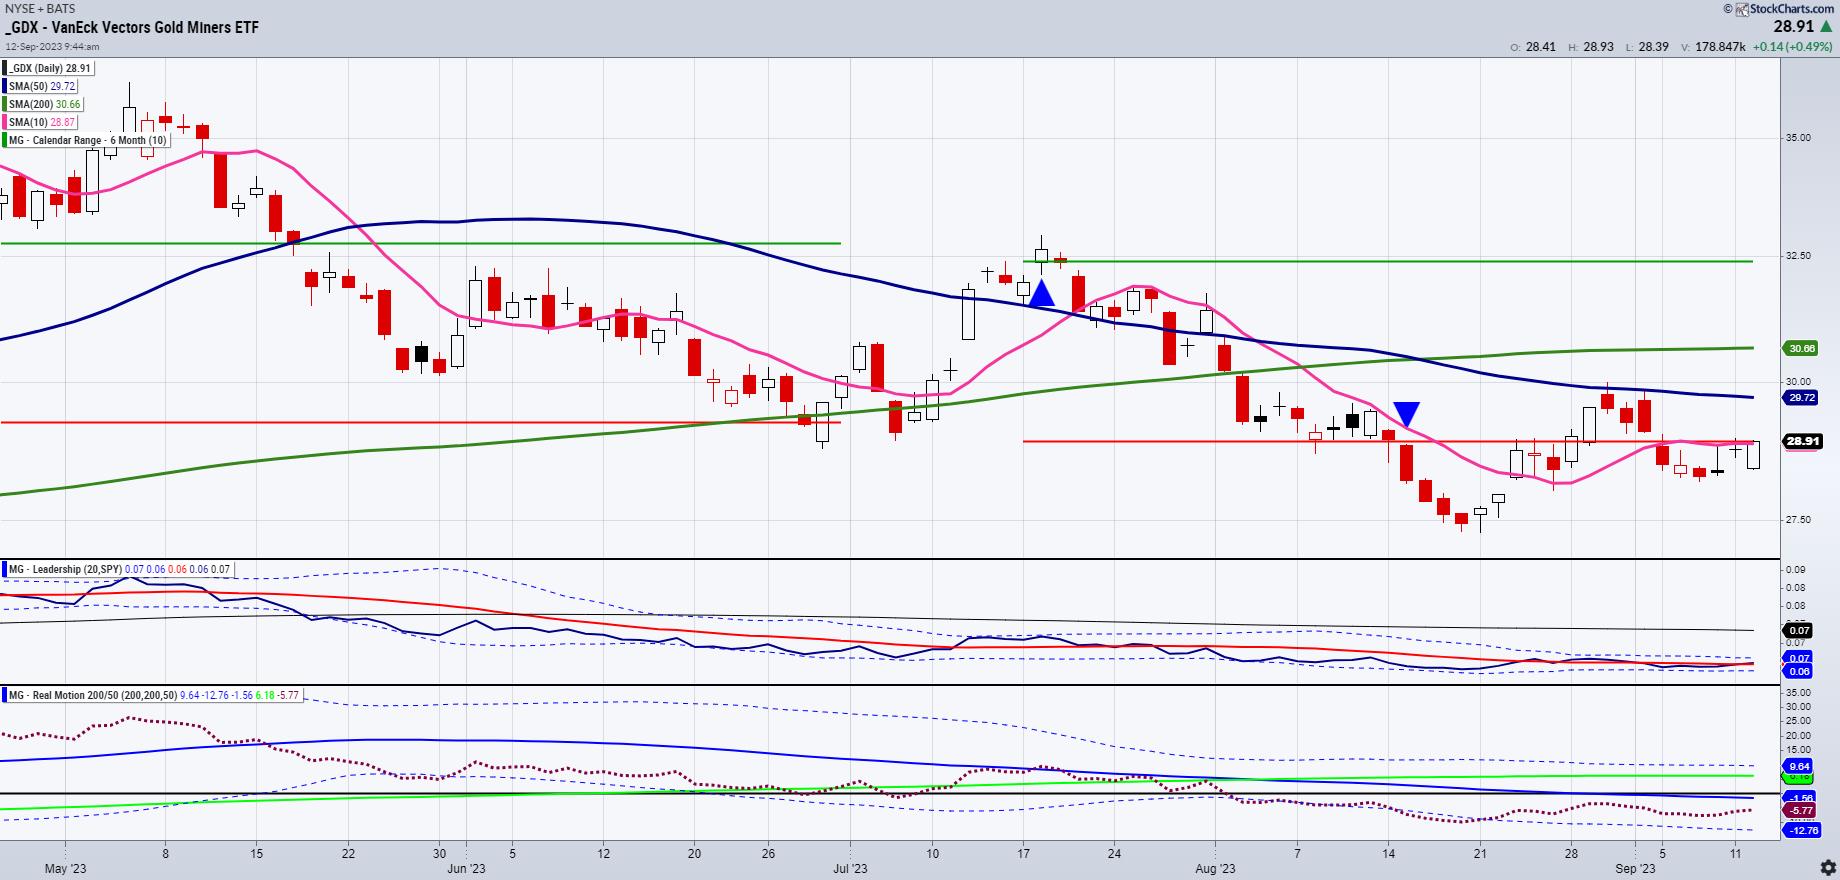
A Fresh Look at Precious Metals
We finished a very heavy week filled with all kinds of data:
1. Fitch downgrade
2. Earnings -- Amazon up, Apple down
3. Jobs report -- wages rising
4. Treasury Yields higher -- at October 2022 highs
5. Record temperatures around the globe, including winter in S. America
6. Oil...
READ MORE
MEMBERS ONLY

Granddad Russell, Grandma Retail and Grand Debt
On August 1st, as many cheered the rise in GDP (partly because consumer spending is 70% of the GDP), another agency did not cheer at all.
With Government Debt to the GDP ratio super high, coupled with high interest rates, Fitch was not having it. They see this as a...
READ MORE
MEMBERS ONLY

Will Rising Oil Prices Smack the S&P 500?
As the market and economy cheer the rise in GDP, we can thank consumer spending, 70% of GDP; services (what consumer pay for in aid, help or information), 45% of GDP; and government spending, about 19% of GDP.
Hence, one sector to watch carefully is retail, or our Granny XRT....
READ MORE
