MEMBERS ONLY
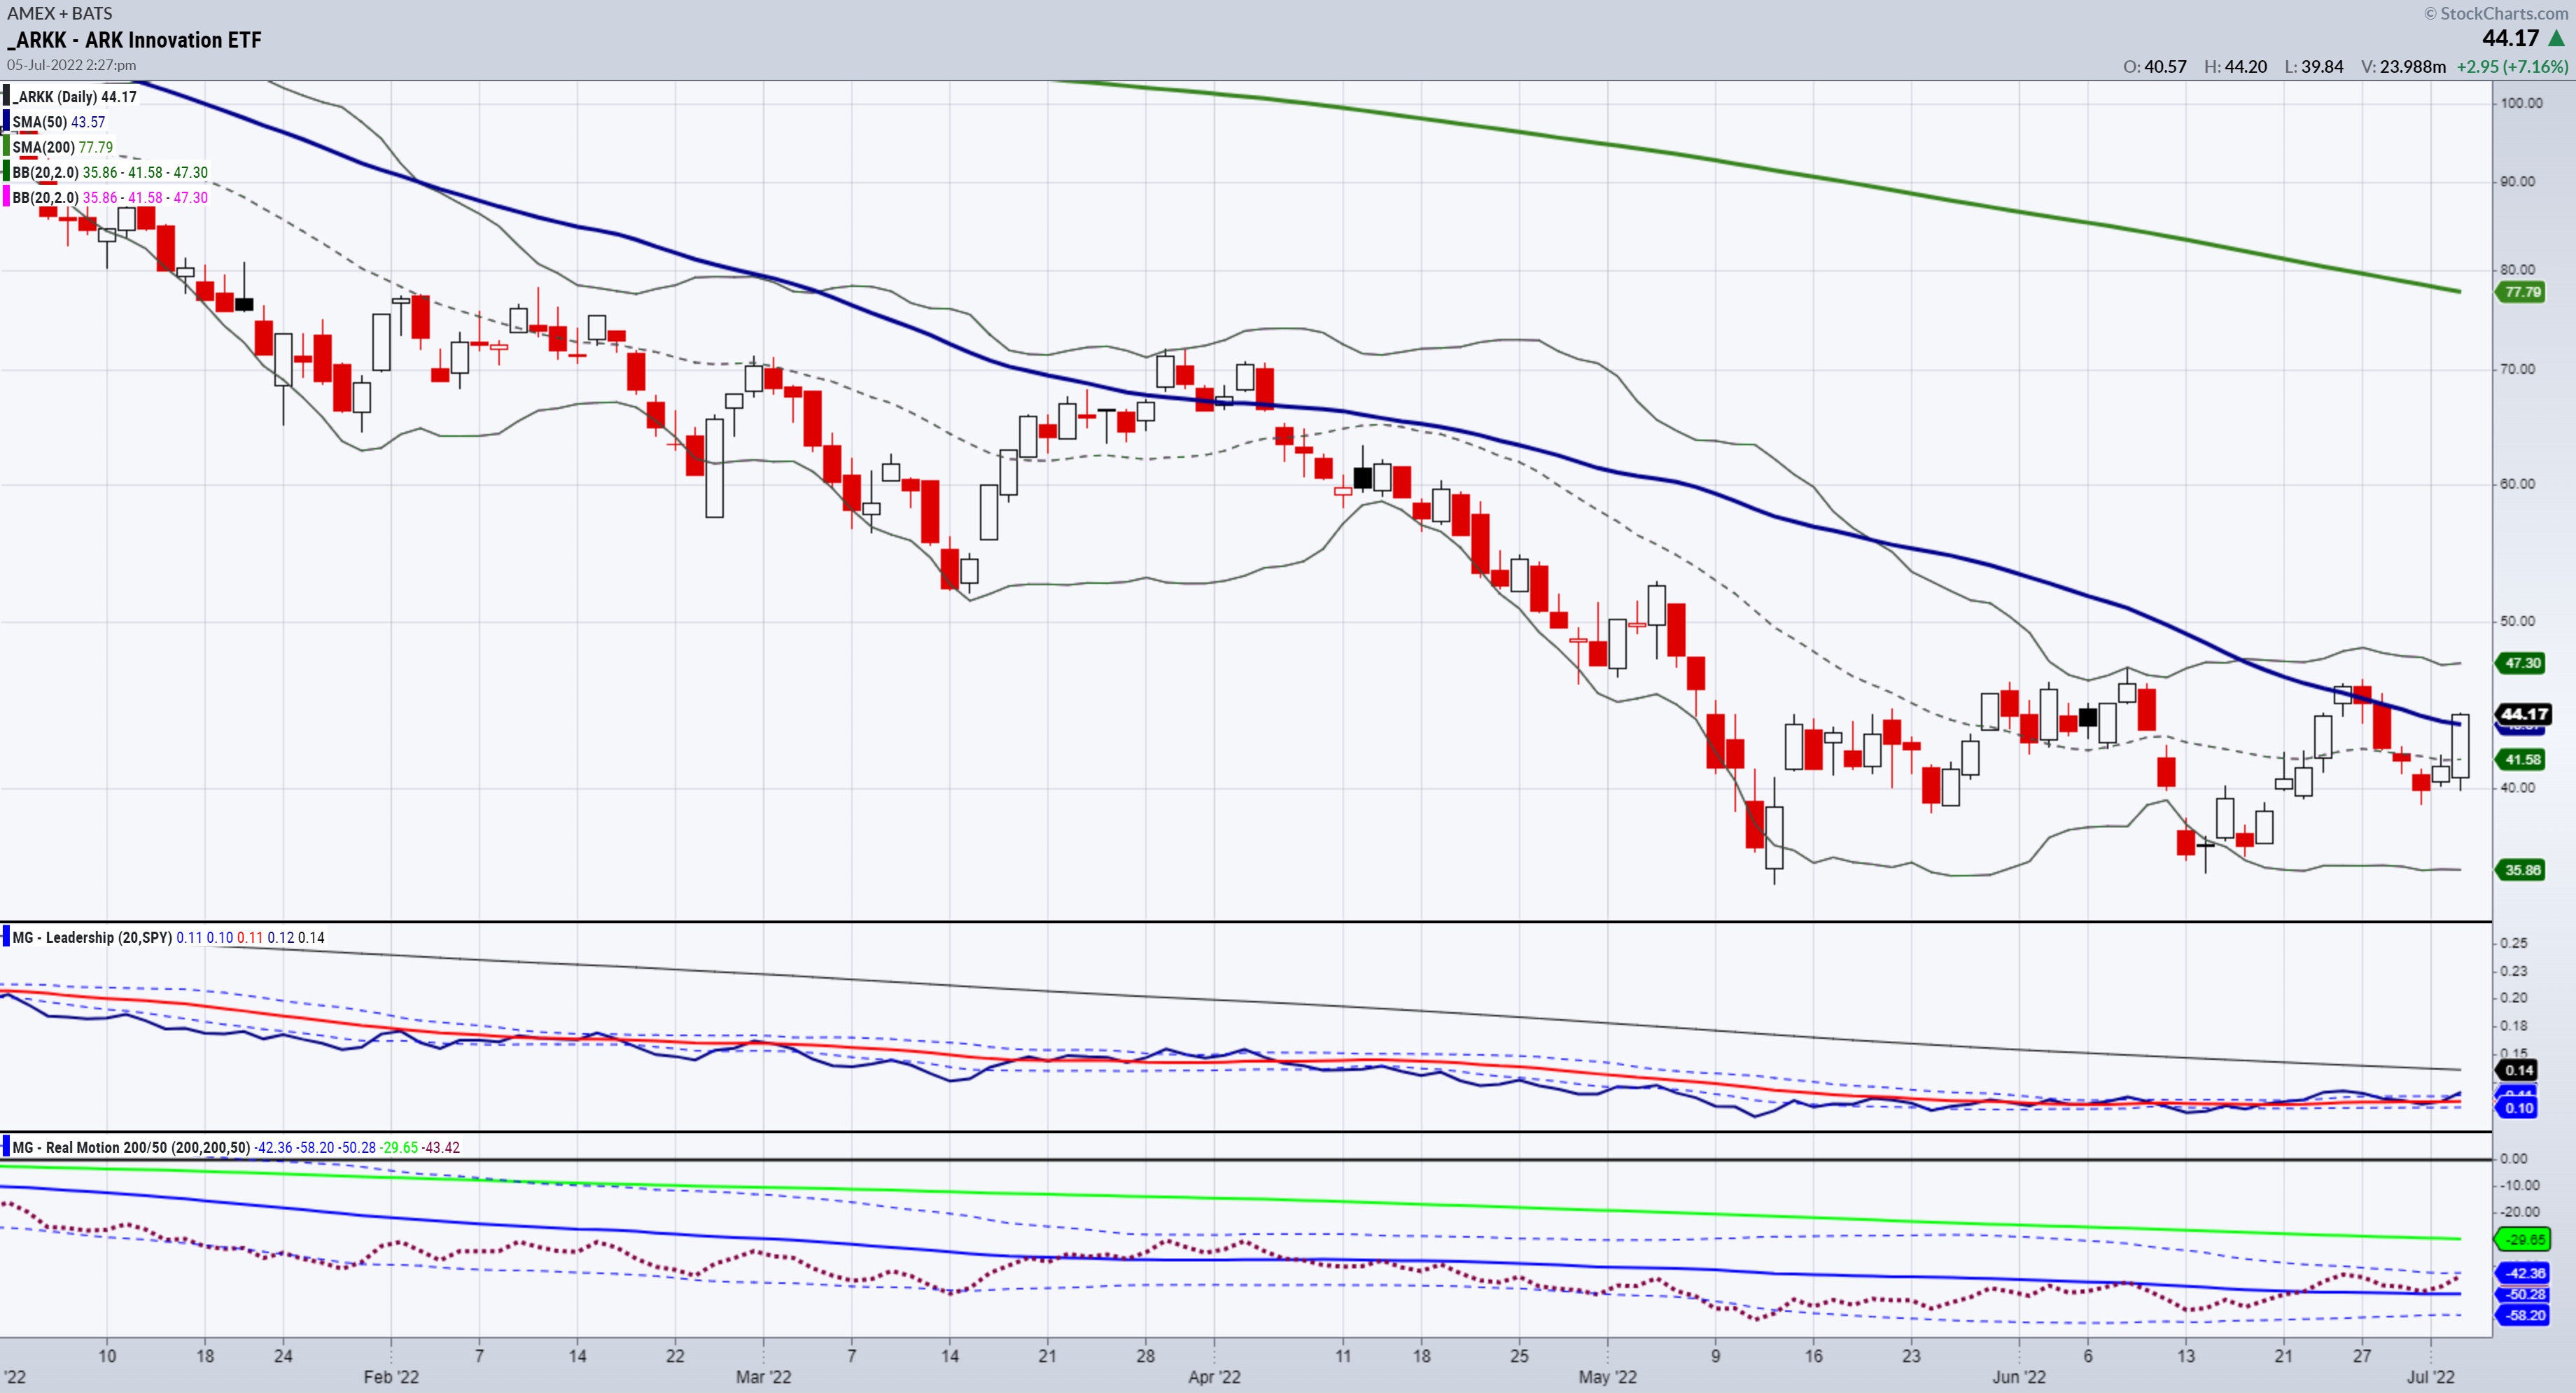
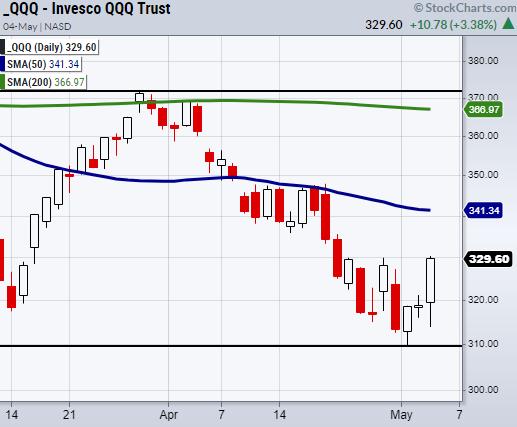
Mish's Daily: Did ARKK Bottom?
ARKK may be the most extraordinary example of sheer brilliance and horrific money management combined.
We all watched ARKK fly to its peak in early 2021. We all watched ARKK tumble to nearly 70% of that peak this year in 2022. And we all listened to Cathie Wood dig herself...
READ MORE
MEMBERS ONLY
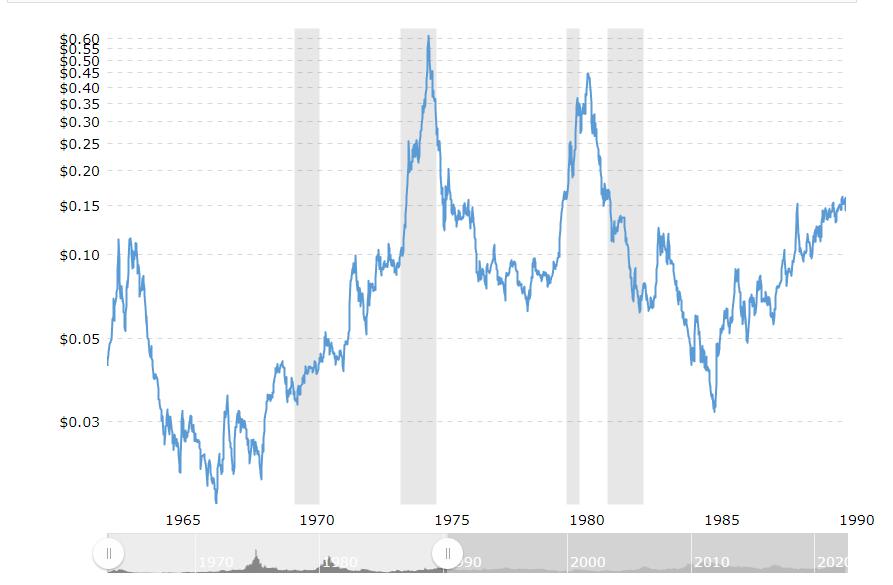
Mish's Daily: Sugar Futures Then and Now -- and Why it Matters
Some History First
In 1972, supply shortfalls, rising demand, unrest in Pakistan and the devaluation of the dollar all contributed to a large increase in the price of sugar. By February of 1974, with rising inflation, rising demand from China, rumors of a large purchase by the USSR on global...
READ MORE
MEMBERS ONLY
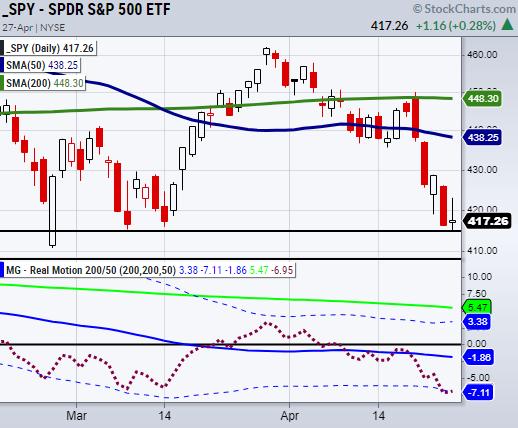
Mish's Daily: Post PCE -- What is the Pre-PCE Market Saying?
Stocks are primarily unchanged or trading slightly higher as pressures from rising food and energy prices persist.
As I reiterate, among the war's immediate external financial implications are disruptions in global supply lines for cereals, fertilizers, metals and energy, all of which are passed on to global consumers...
READ MORE
MEMBERS ONLY
Mish's Daily: The Textbook Definition of Recession
Although GDP growth is a crucial measure of economic activity, it is not the most significant factor to consider when predicting future stock market returns, since it is a lagging economic indicator. Yet it seems like everyone I talk to is discussing whether we are already in a recession this...
READ MORE
MEMBERS ONLY
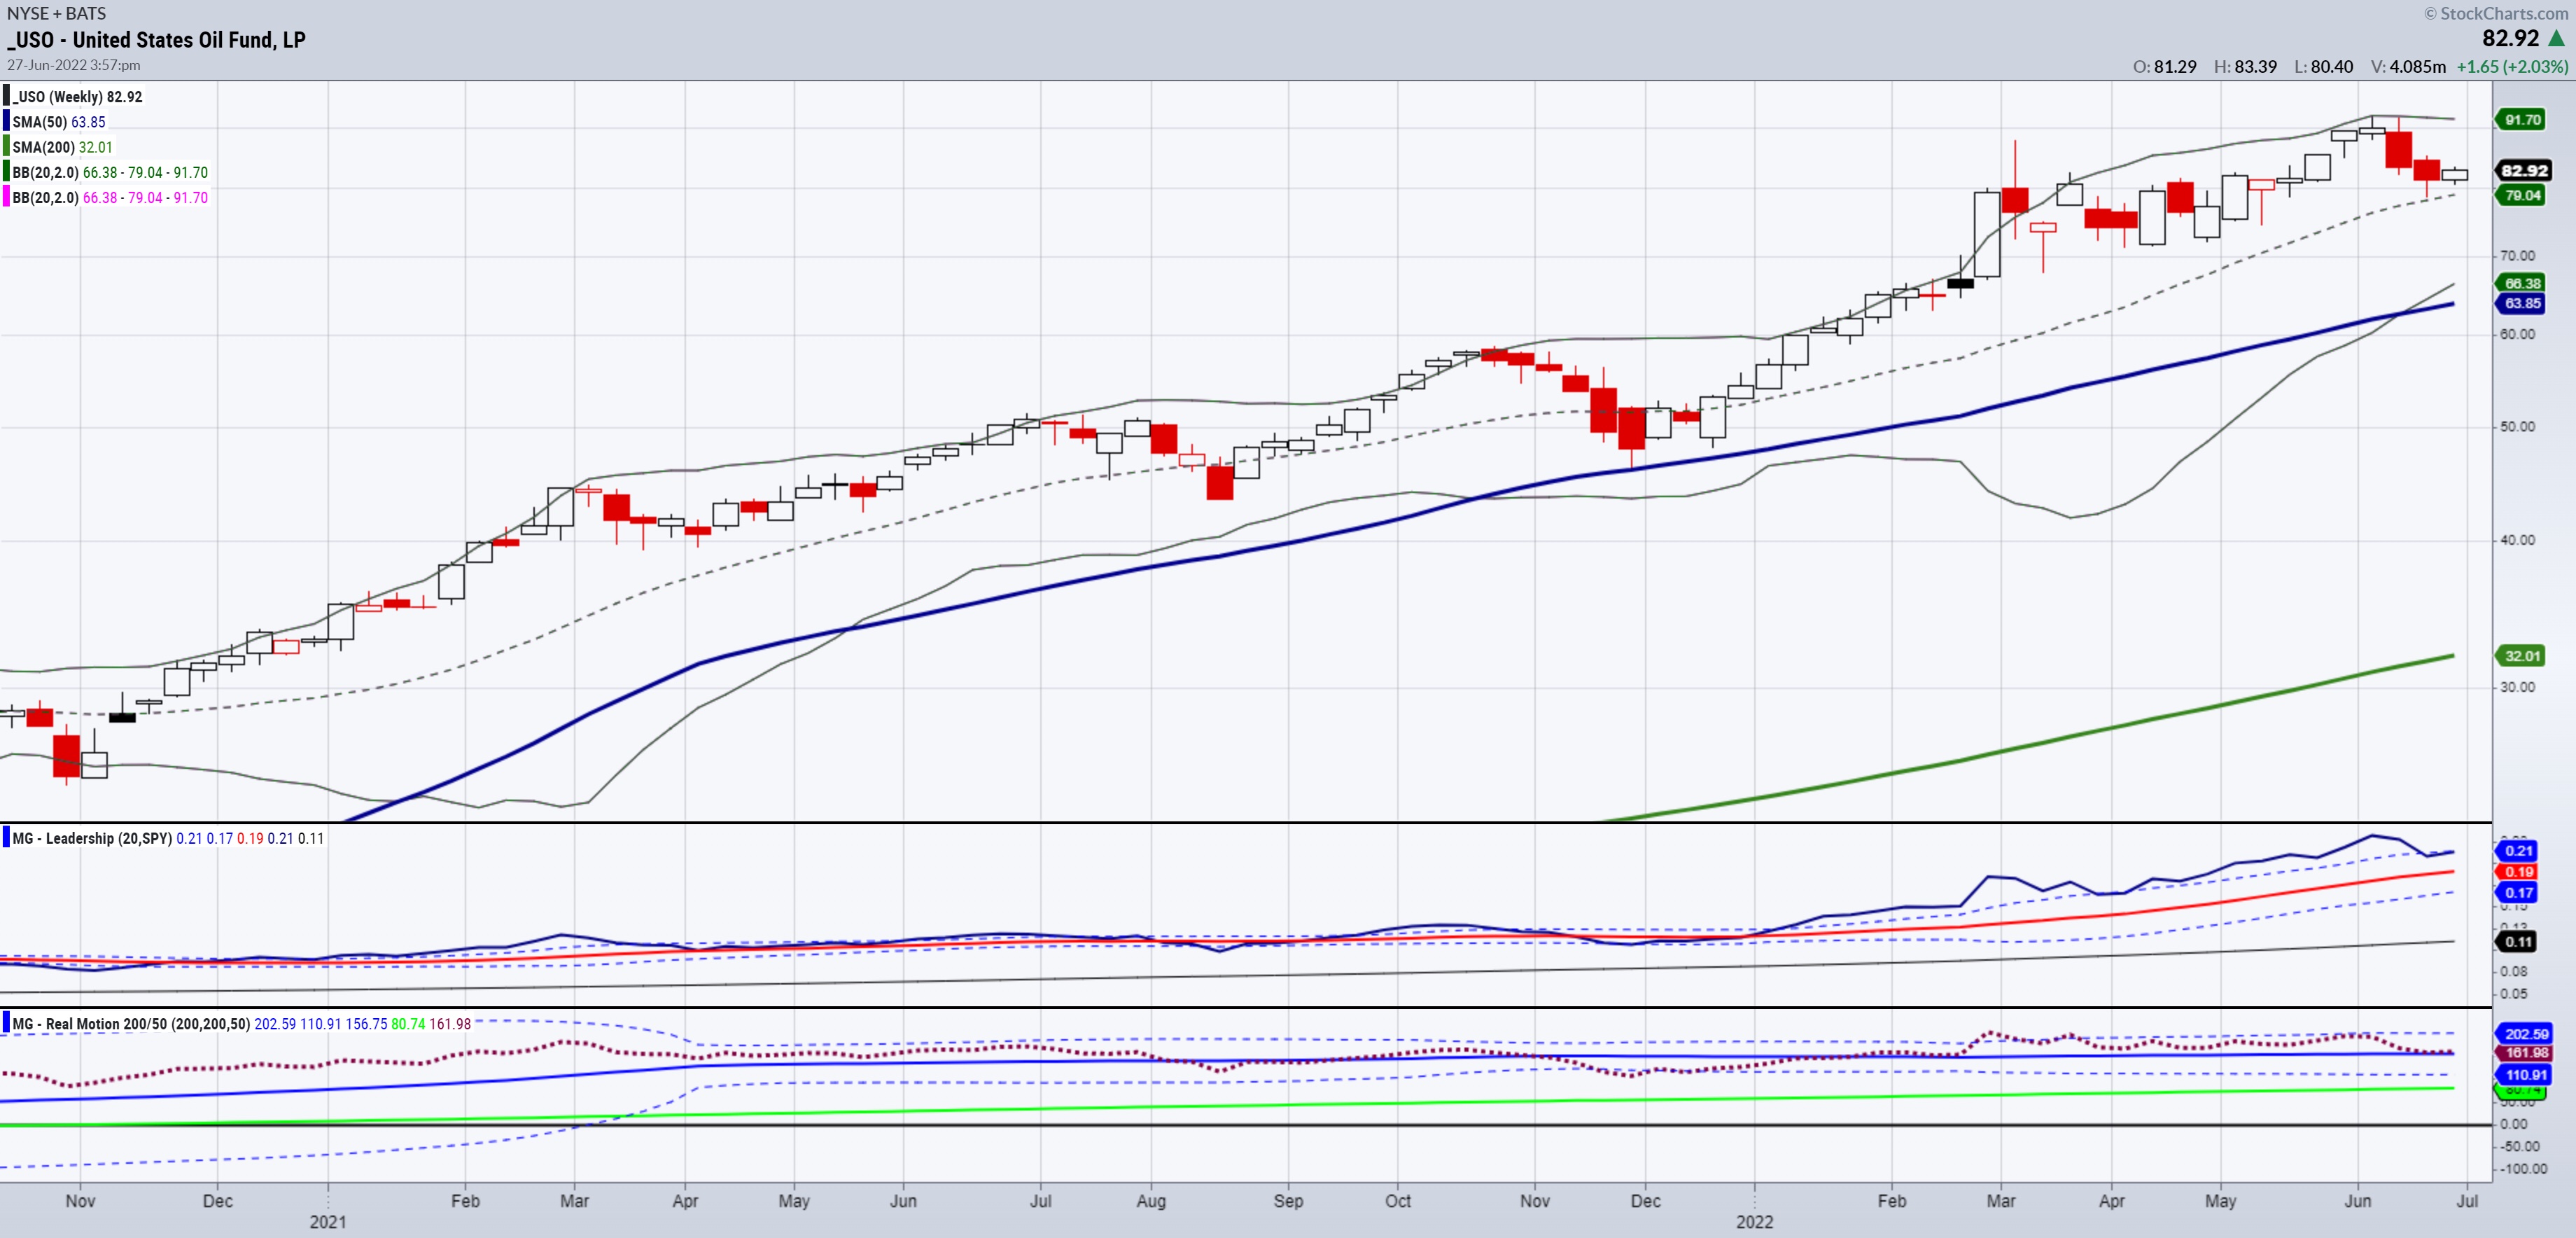
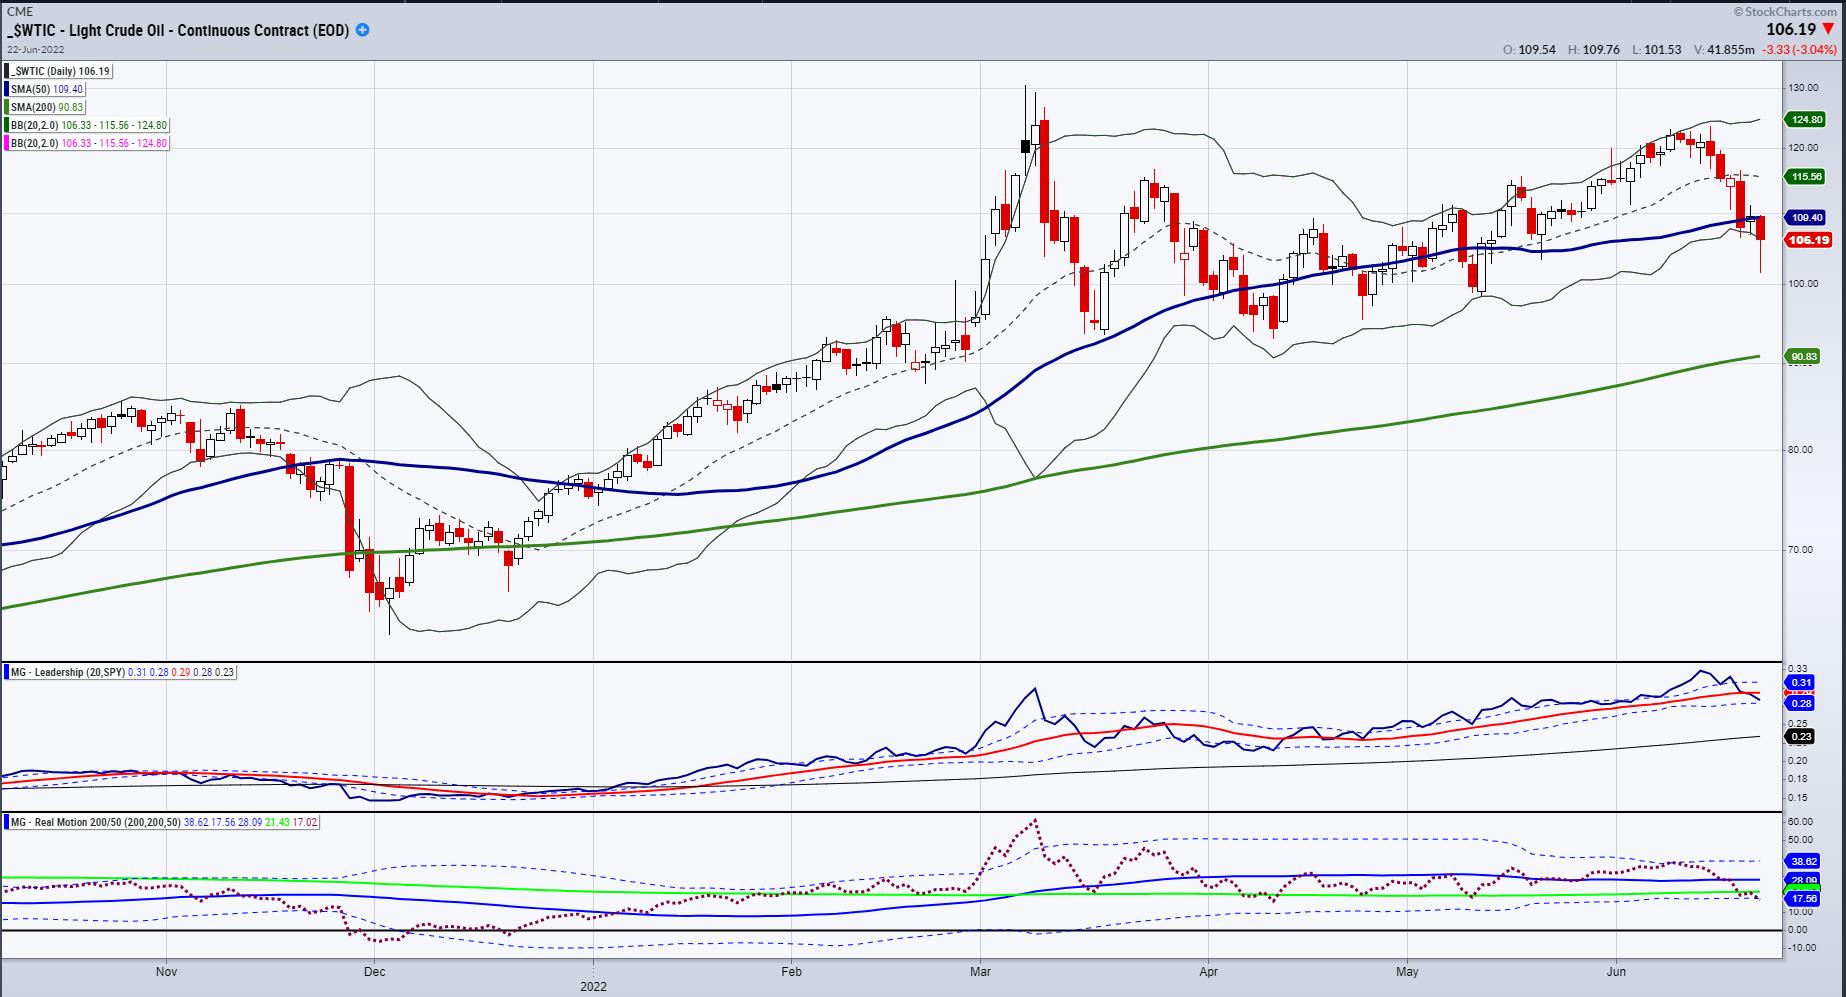
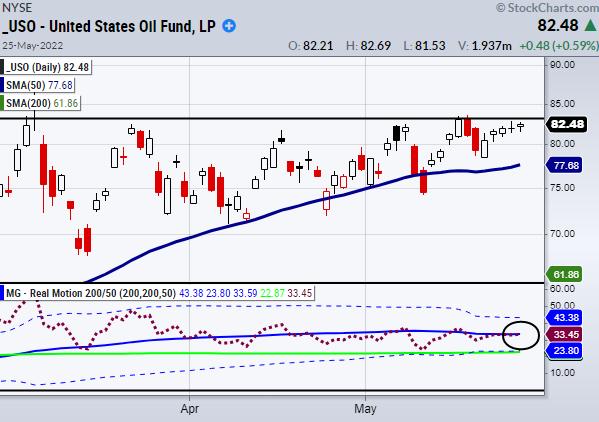
Mish's Daily: What Can We Expect from Oil Prices?
U.S. crude oil continues to rise after a pullback late last week to around the mid-$90s per barrel. However, the price is hitting short-term resistance around $109-$110 for the time being.
Over the last four days, the USO oil ETF also rebounded strongly after the correction late...
READ MORE
MEMBERS ONLY
Mish's Daily: Technical Bounce or New Bullish Breakout?
I woke up these headlines on my Twitter feed Friday morning: "POWELL: US HAS A VERY STRONG, WELL RECOVERED ECONOMY."
Jerome Powell said a soft landing is still "possible," but conceded recession was also a possibility in his congressional testimony last week. He noted that it...
READ MORE
MEMBERS ONLY
Mish's Daily: Are We Heading Towards Recession?
To be clear, the economy is not currently in recession. There remains roughly $2.5 trillion in excess savings and a robust labor market, although that might be changing. Furthermore, fixed business investment is still strong and continues to bolster the economy.
But rising retail inventories and soaring domestic costs...
READ MORE
MEMBERS ONLY
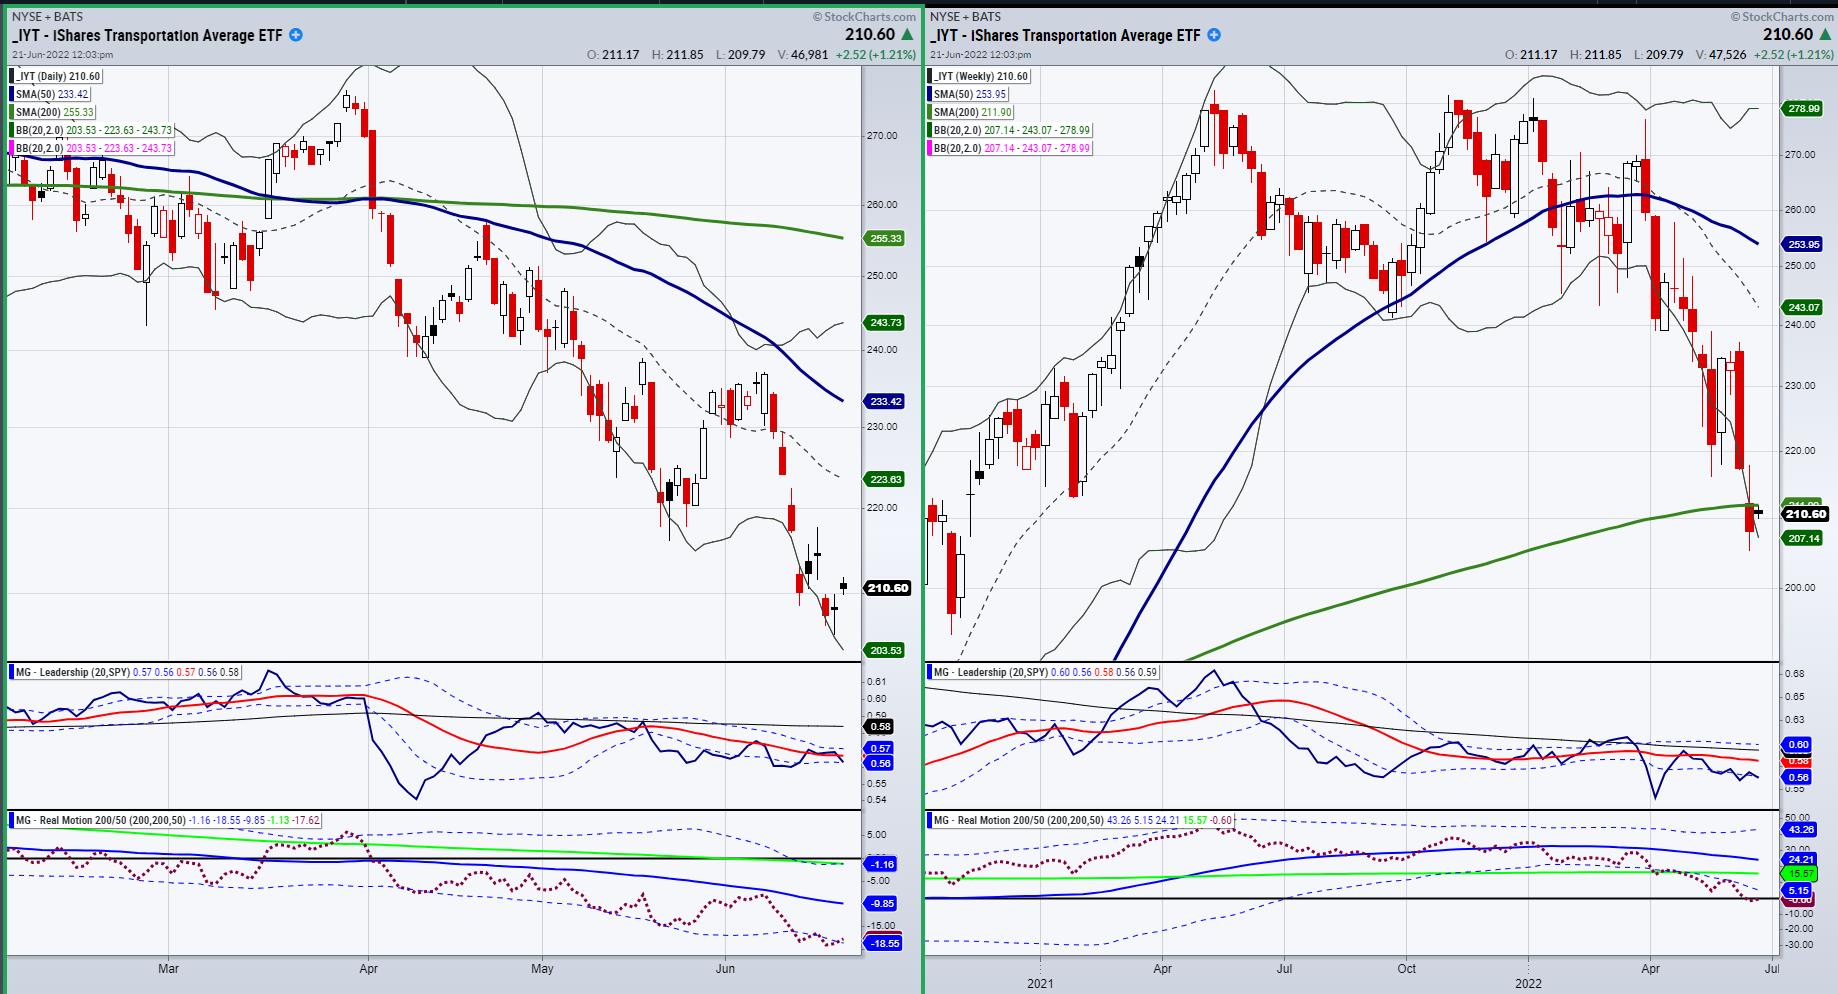
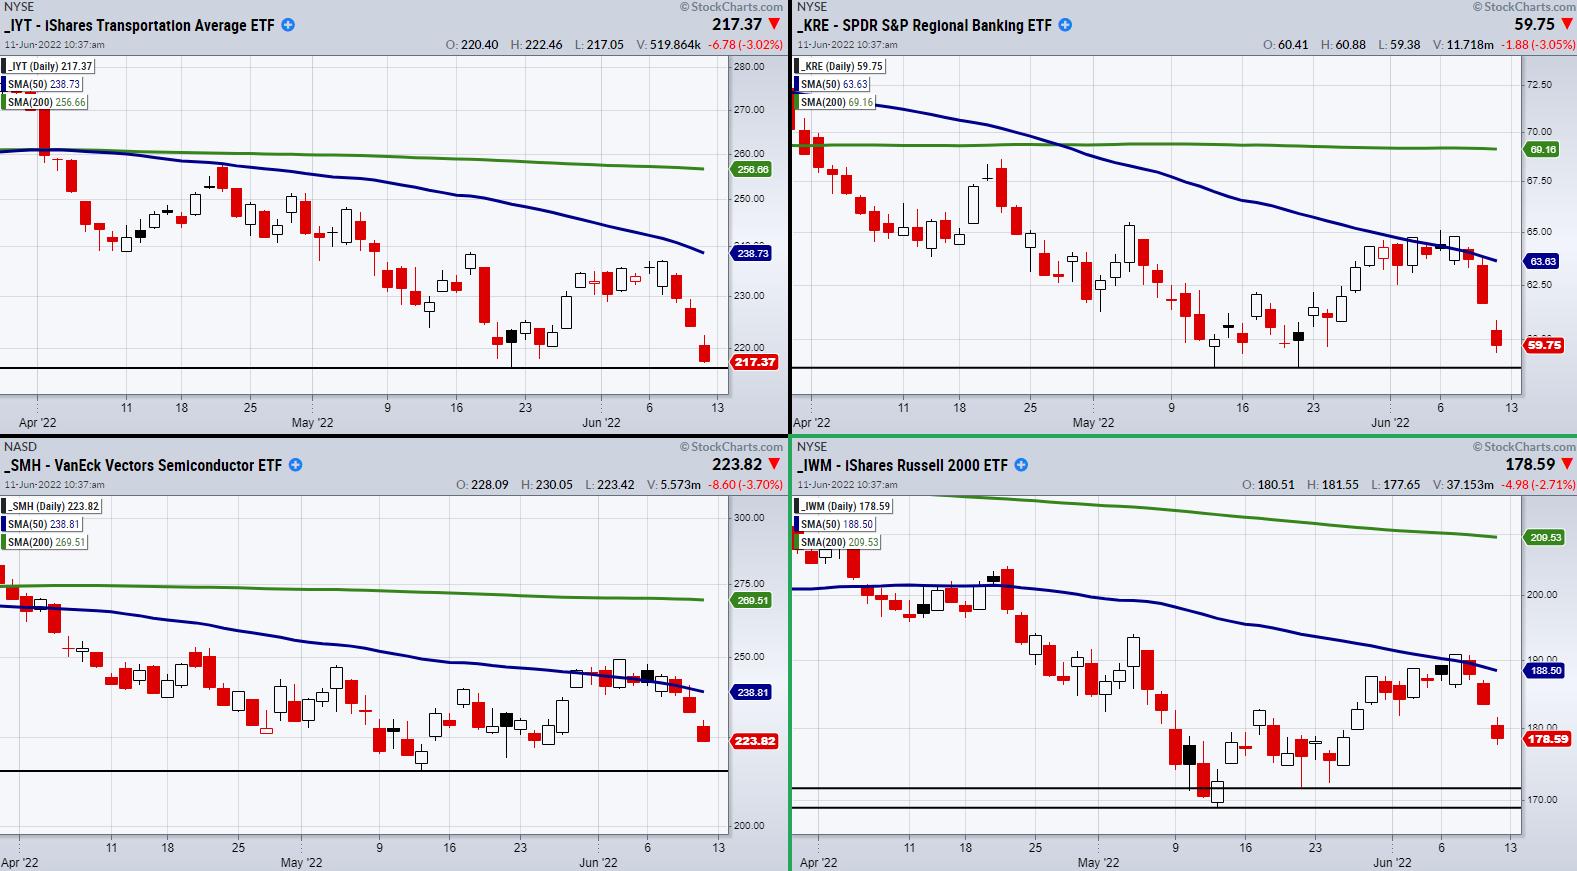
Mish's Daily: Demand Destruction as Seen in the Transportation Sector
Over the weekend, I wrote that "Looking at the SPY chart, we could be setting up for a mean reversion trade (bear market bounce that takes SPY back to 380)." I went on to write, "Granny Retail (XRT), also in a downtrend, has some good bottoming action,...
READ MORE
MEMBERS ONLY
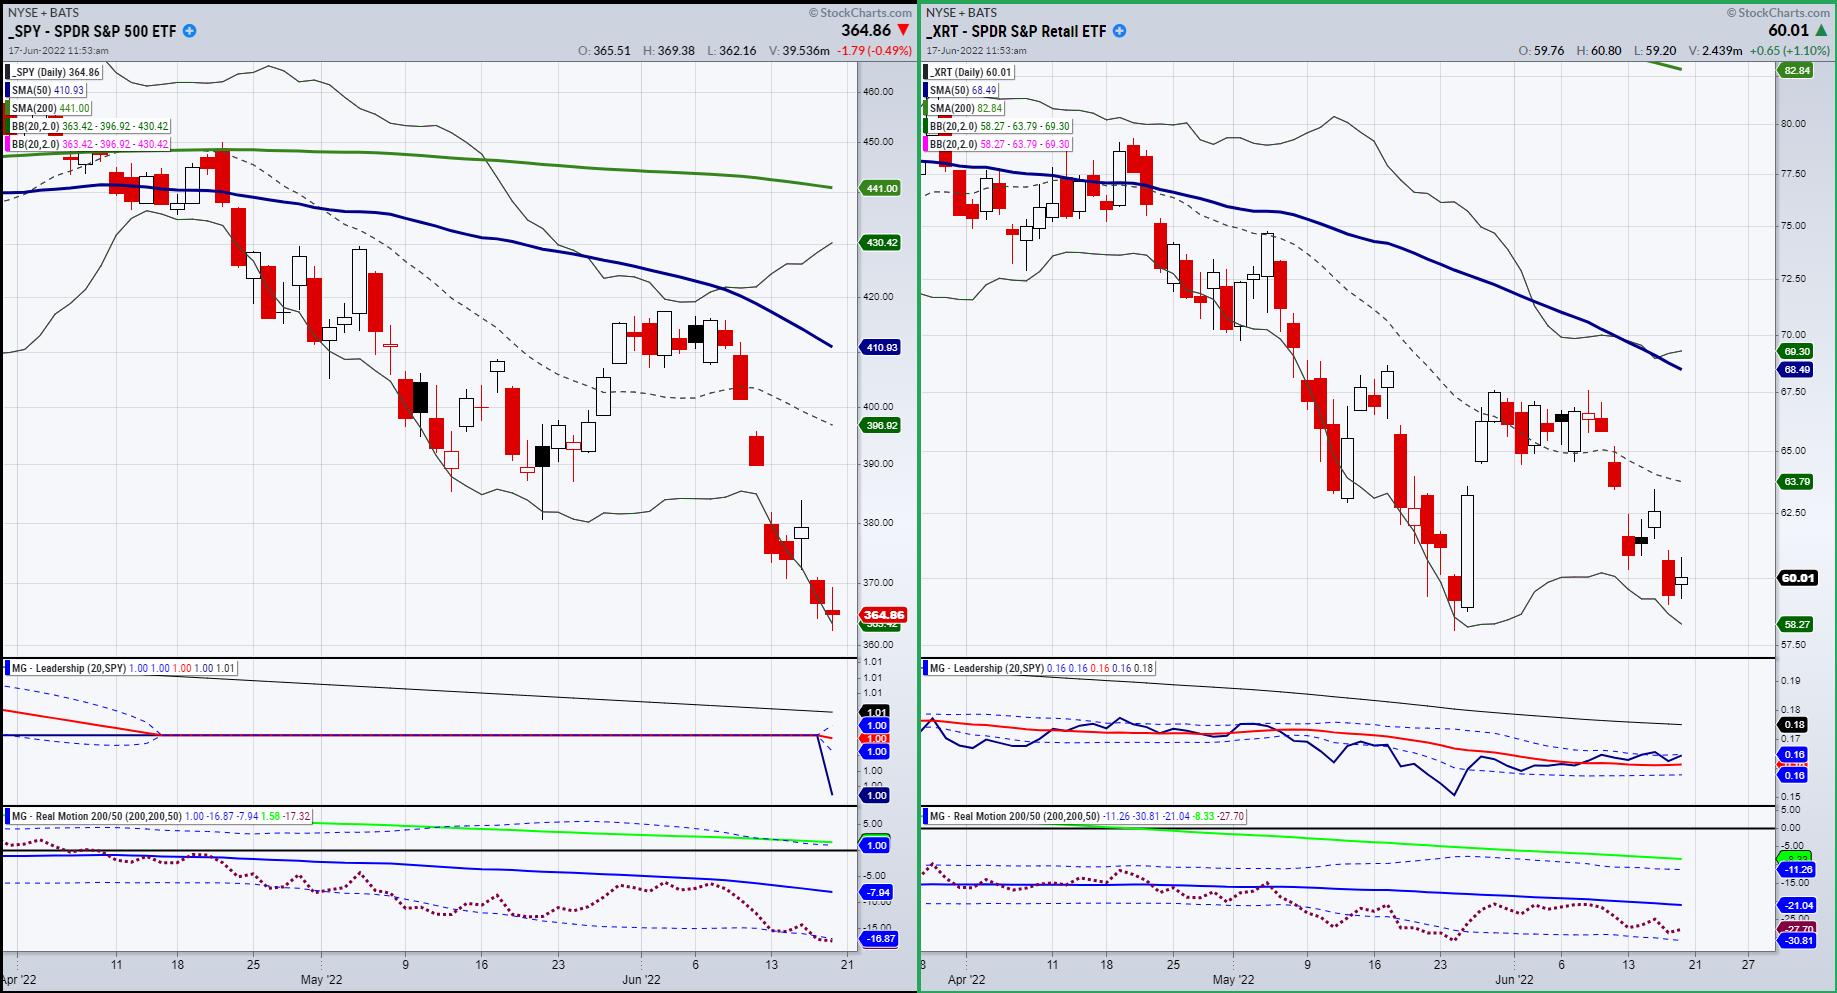
Mish's Daily: When the Trend is Not Your Friend -- A Trading Plan
Currently, if we look at the S&P 500 and the Retail Sector through XRT, our foregone conclusion is that, for the most part, equities are a huge distraction. The obvious trend is down, but is it that obvious at current levels?
Looking at the SPY chart, we could...
READ MORE
MEMBERS ONLY
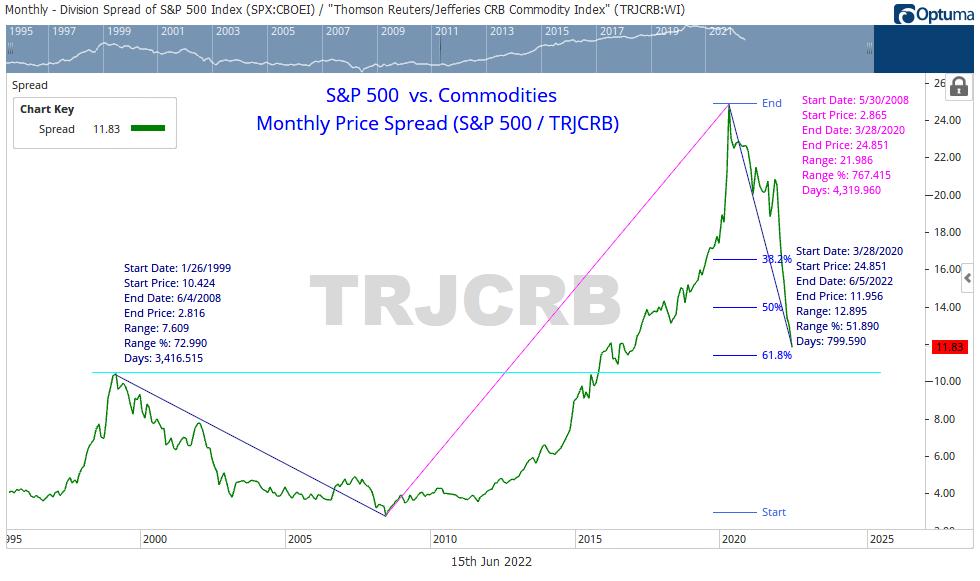
Mish's Daily: Can the Fed Control Inflation with Higher Rates?
So, the whole U.S. watched the Fed raise rates by .75 bps today. And, with all the news coverage and analysis, yours truly has tried to warn you all that, whether the Fed raised by 50 or 75 bps, it does not matter.
Equities underperformed commodities from 1999 to...
READ MORE
MEMBERS ONLY
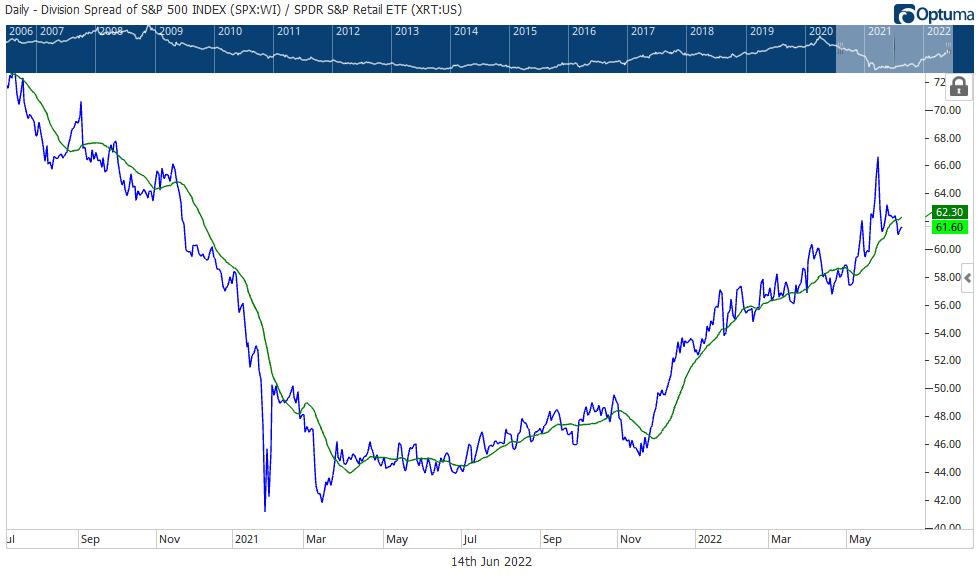
Mish's Daily: For Signs of a Relief Rally, Watch the S&P 500 v. Retail
Pretty much everyone has turned into a bear. And no surprise, really. Personally, I think the bears are a bit late to the party. Nonetheless, the inflation concerns are real. The QT concerns are real. Yet the worries about recession, although real, may not necessarily come to pass as most...
READ MORE
MEMBERS ONLY
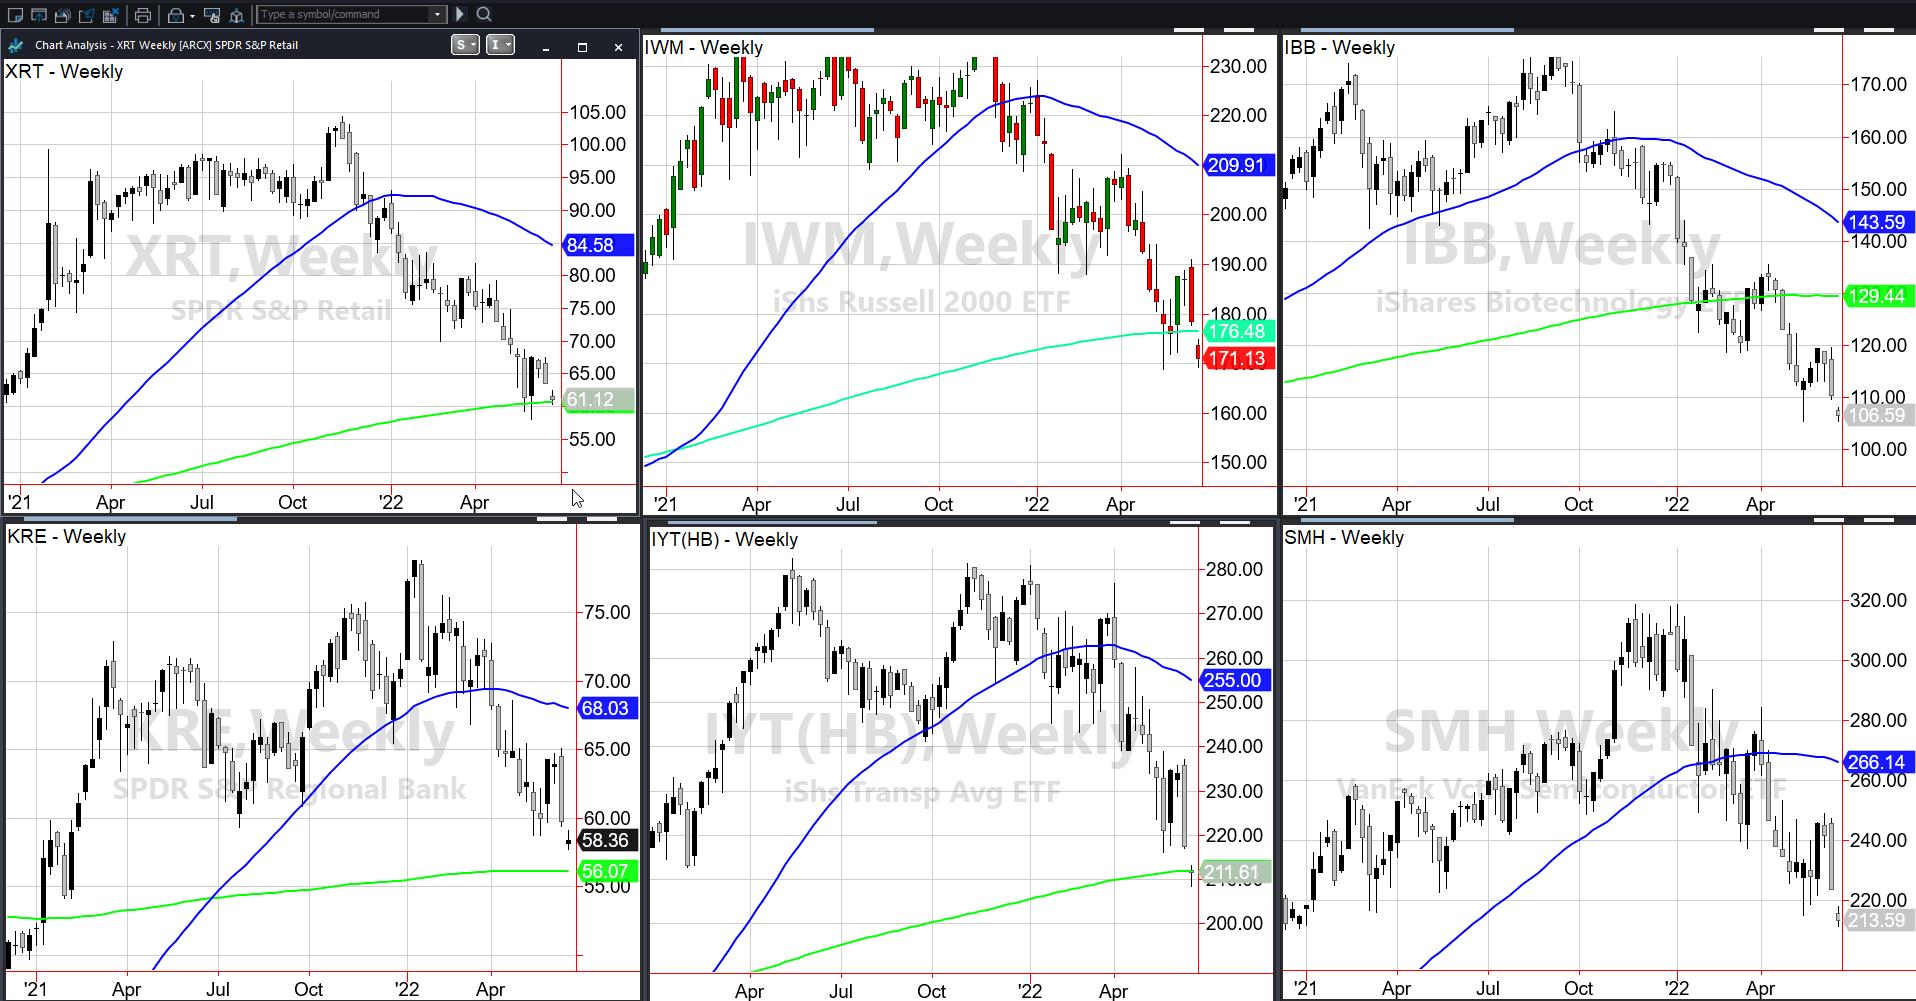
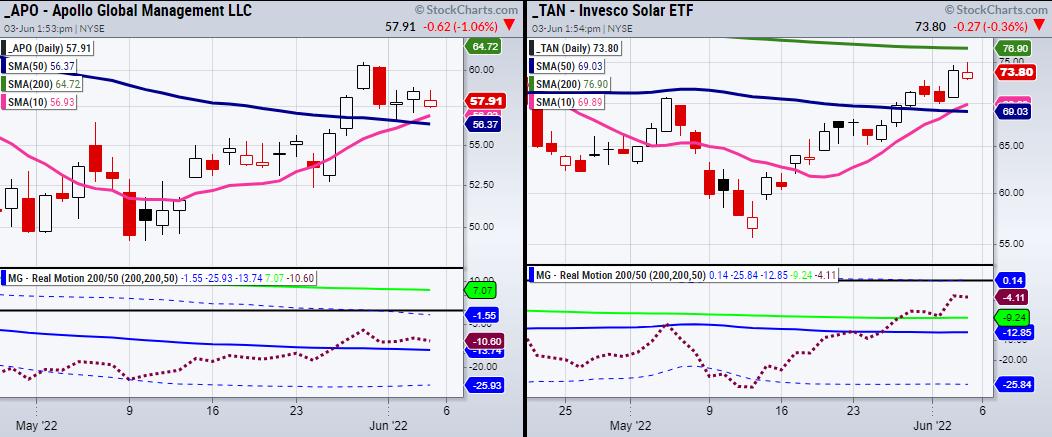
Mish's Daily: Can the Consumer Save the Economy?
Last week, I did a part-educational, part-actionable webinar for the virtual money show (link below). My theme was and always is, the Economic Modern Family.
On the weekly charts, some of the members have broken down under their 200-week moving average, while others tested and held it and others have...
READ MORE
MEMBERS ONLY
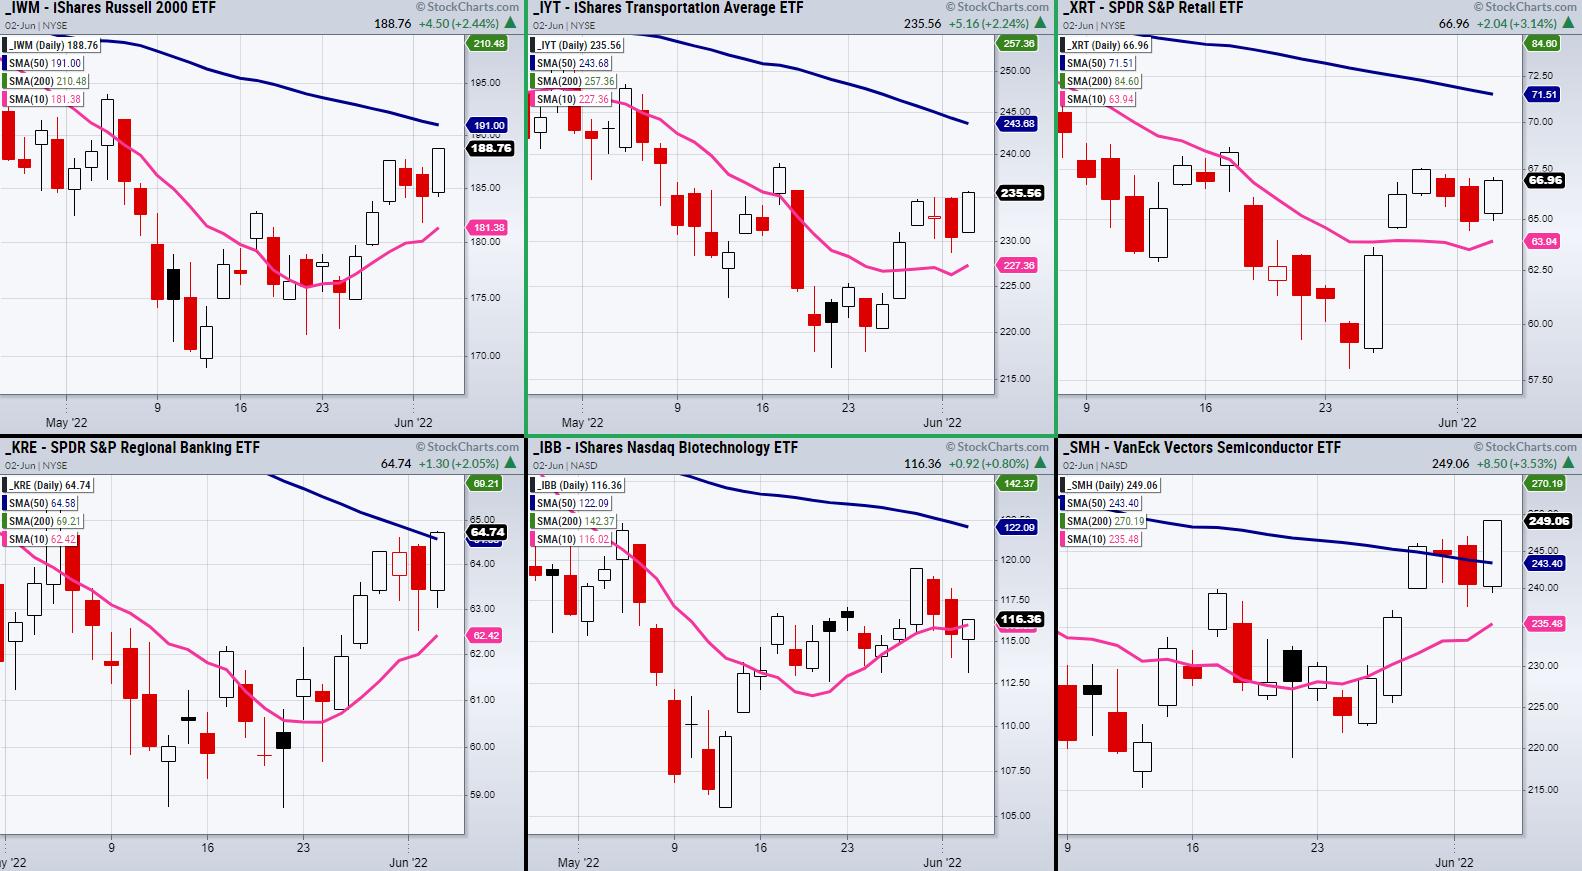
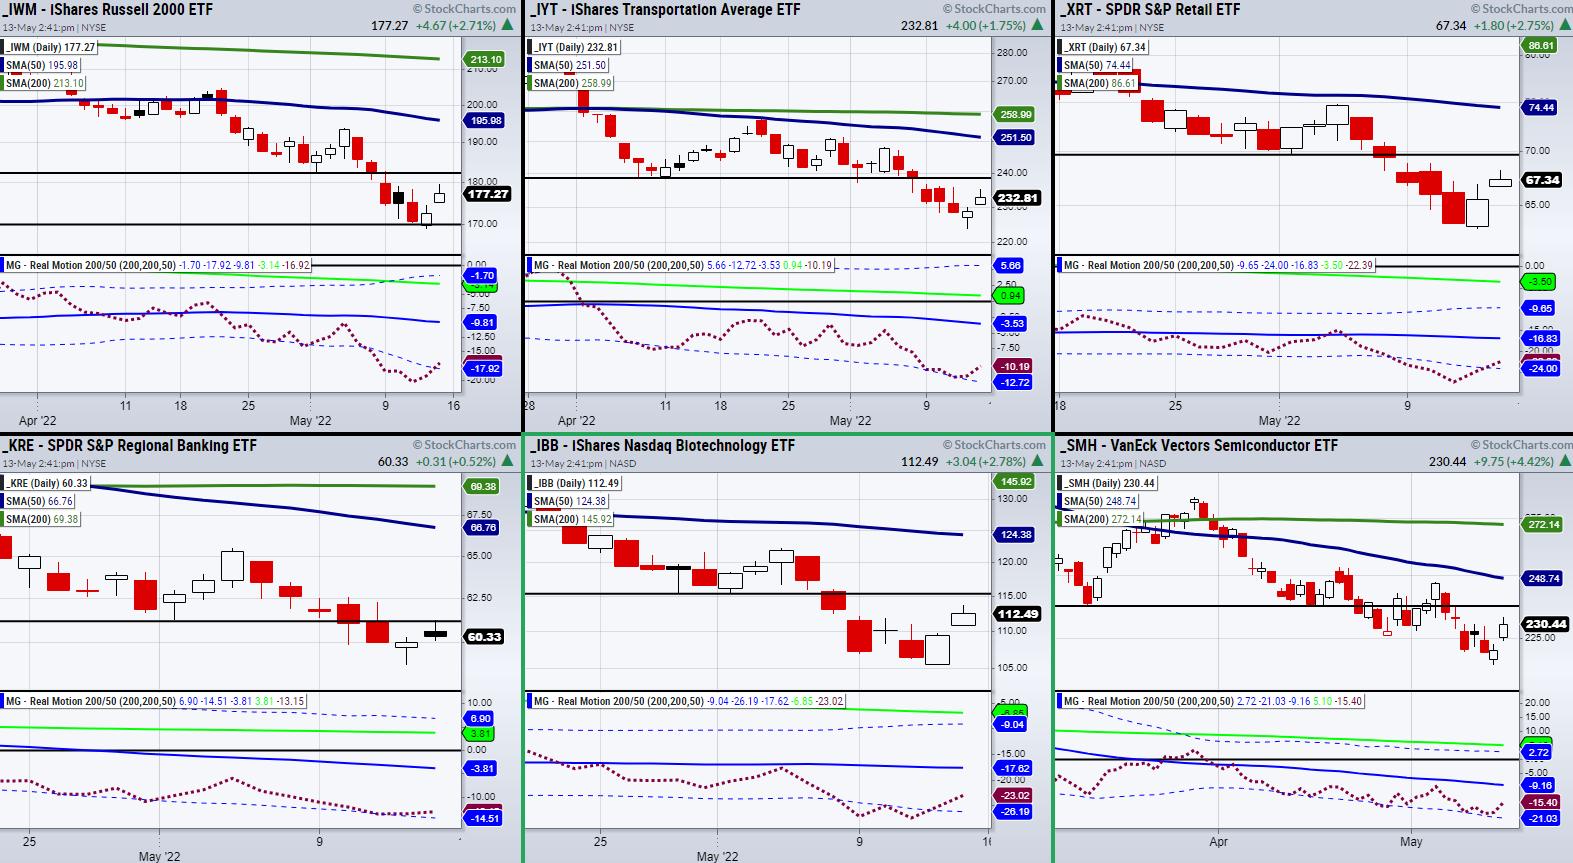
Sectors Investors Need to Focus on After Friday's Large Breakdown
On Friday, the CPI numbers were reported, showing that, while the Fed has continued to increase rates, inflation has again pushed higher. This worsens investor sentiment and increases fears that a recession is inbound. This was reflected in the stock market as the major indices broke down.
However, increased inflation,...
READ MORE
MEMBERS ONLY
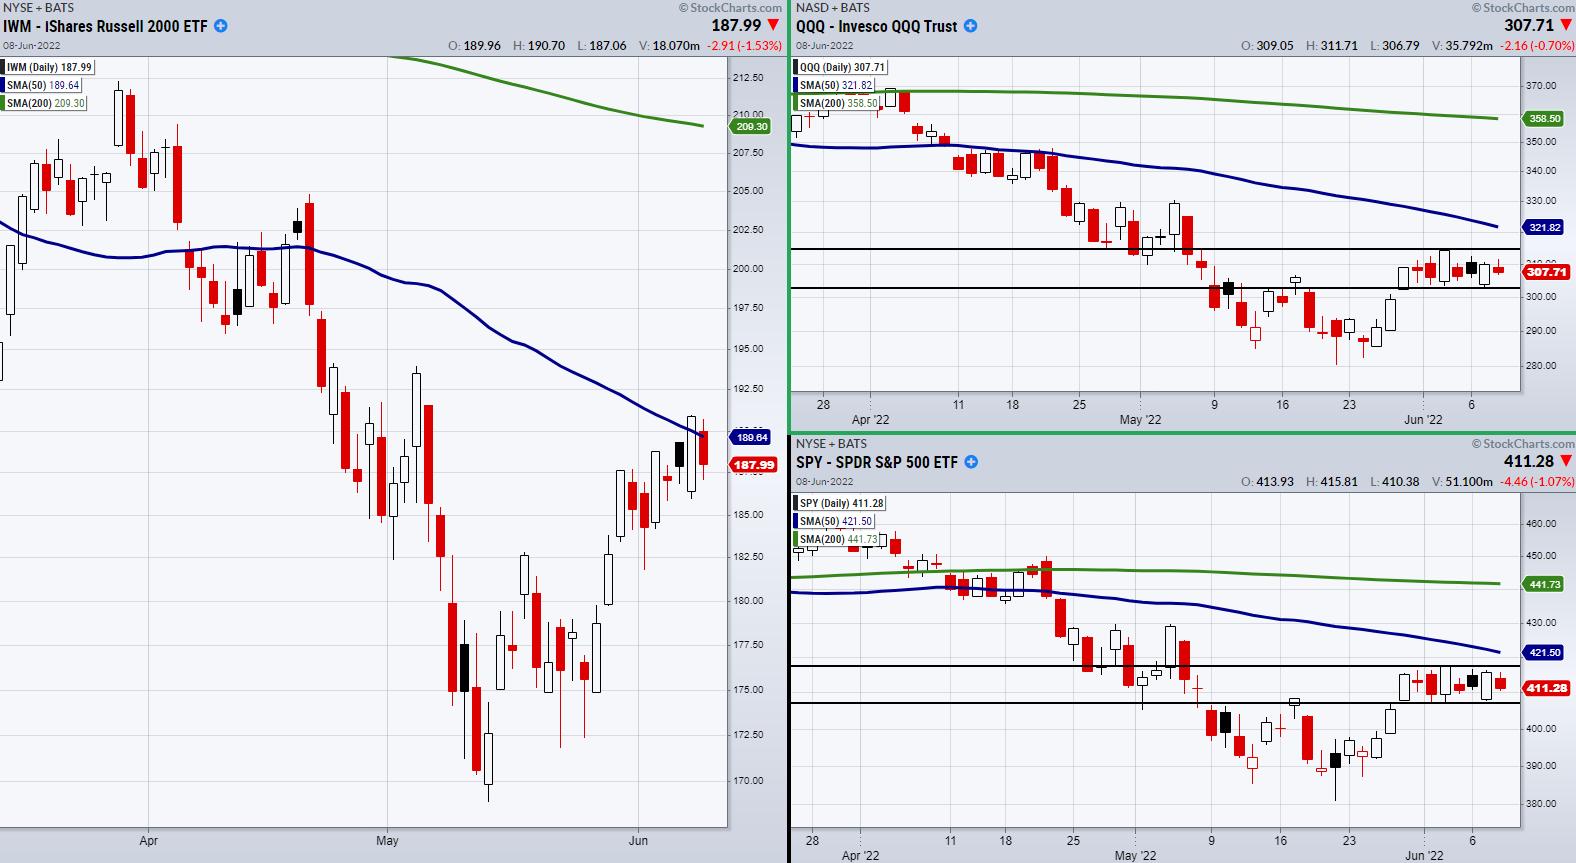
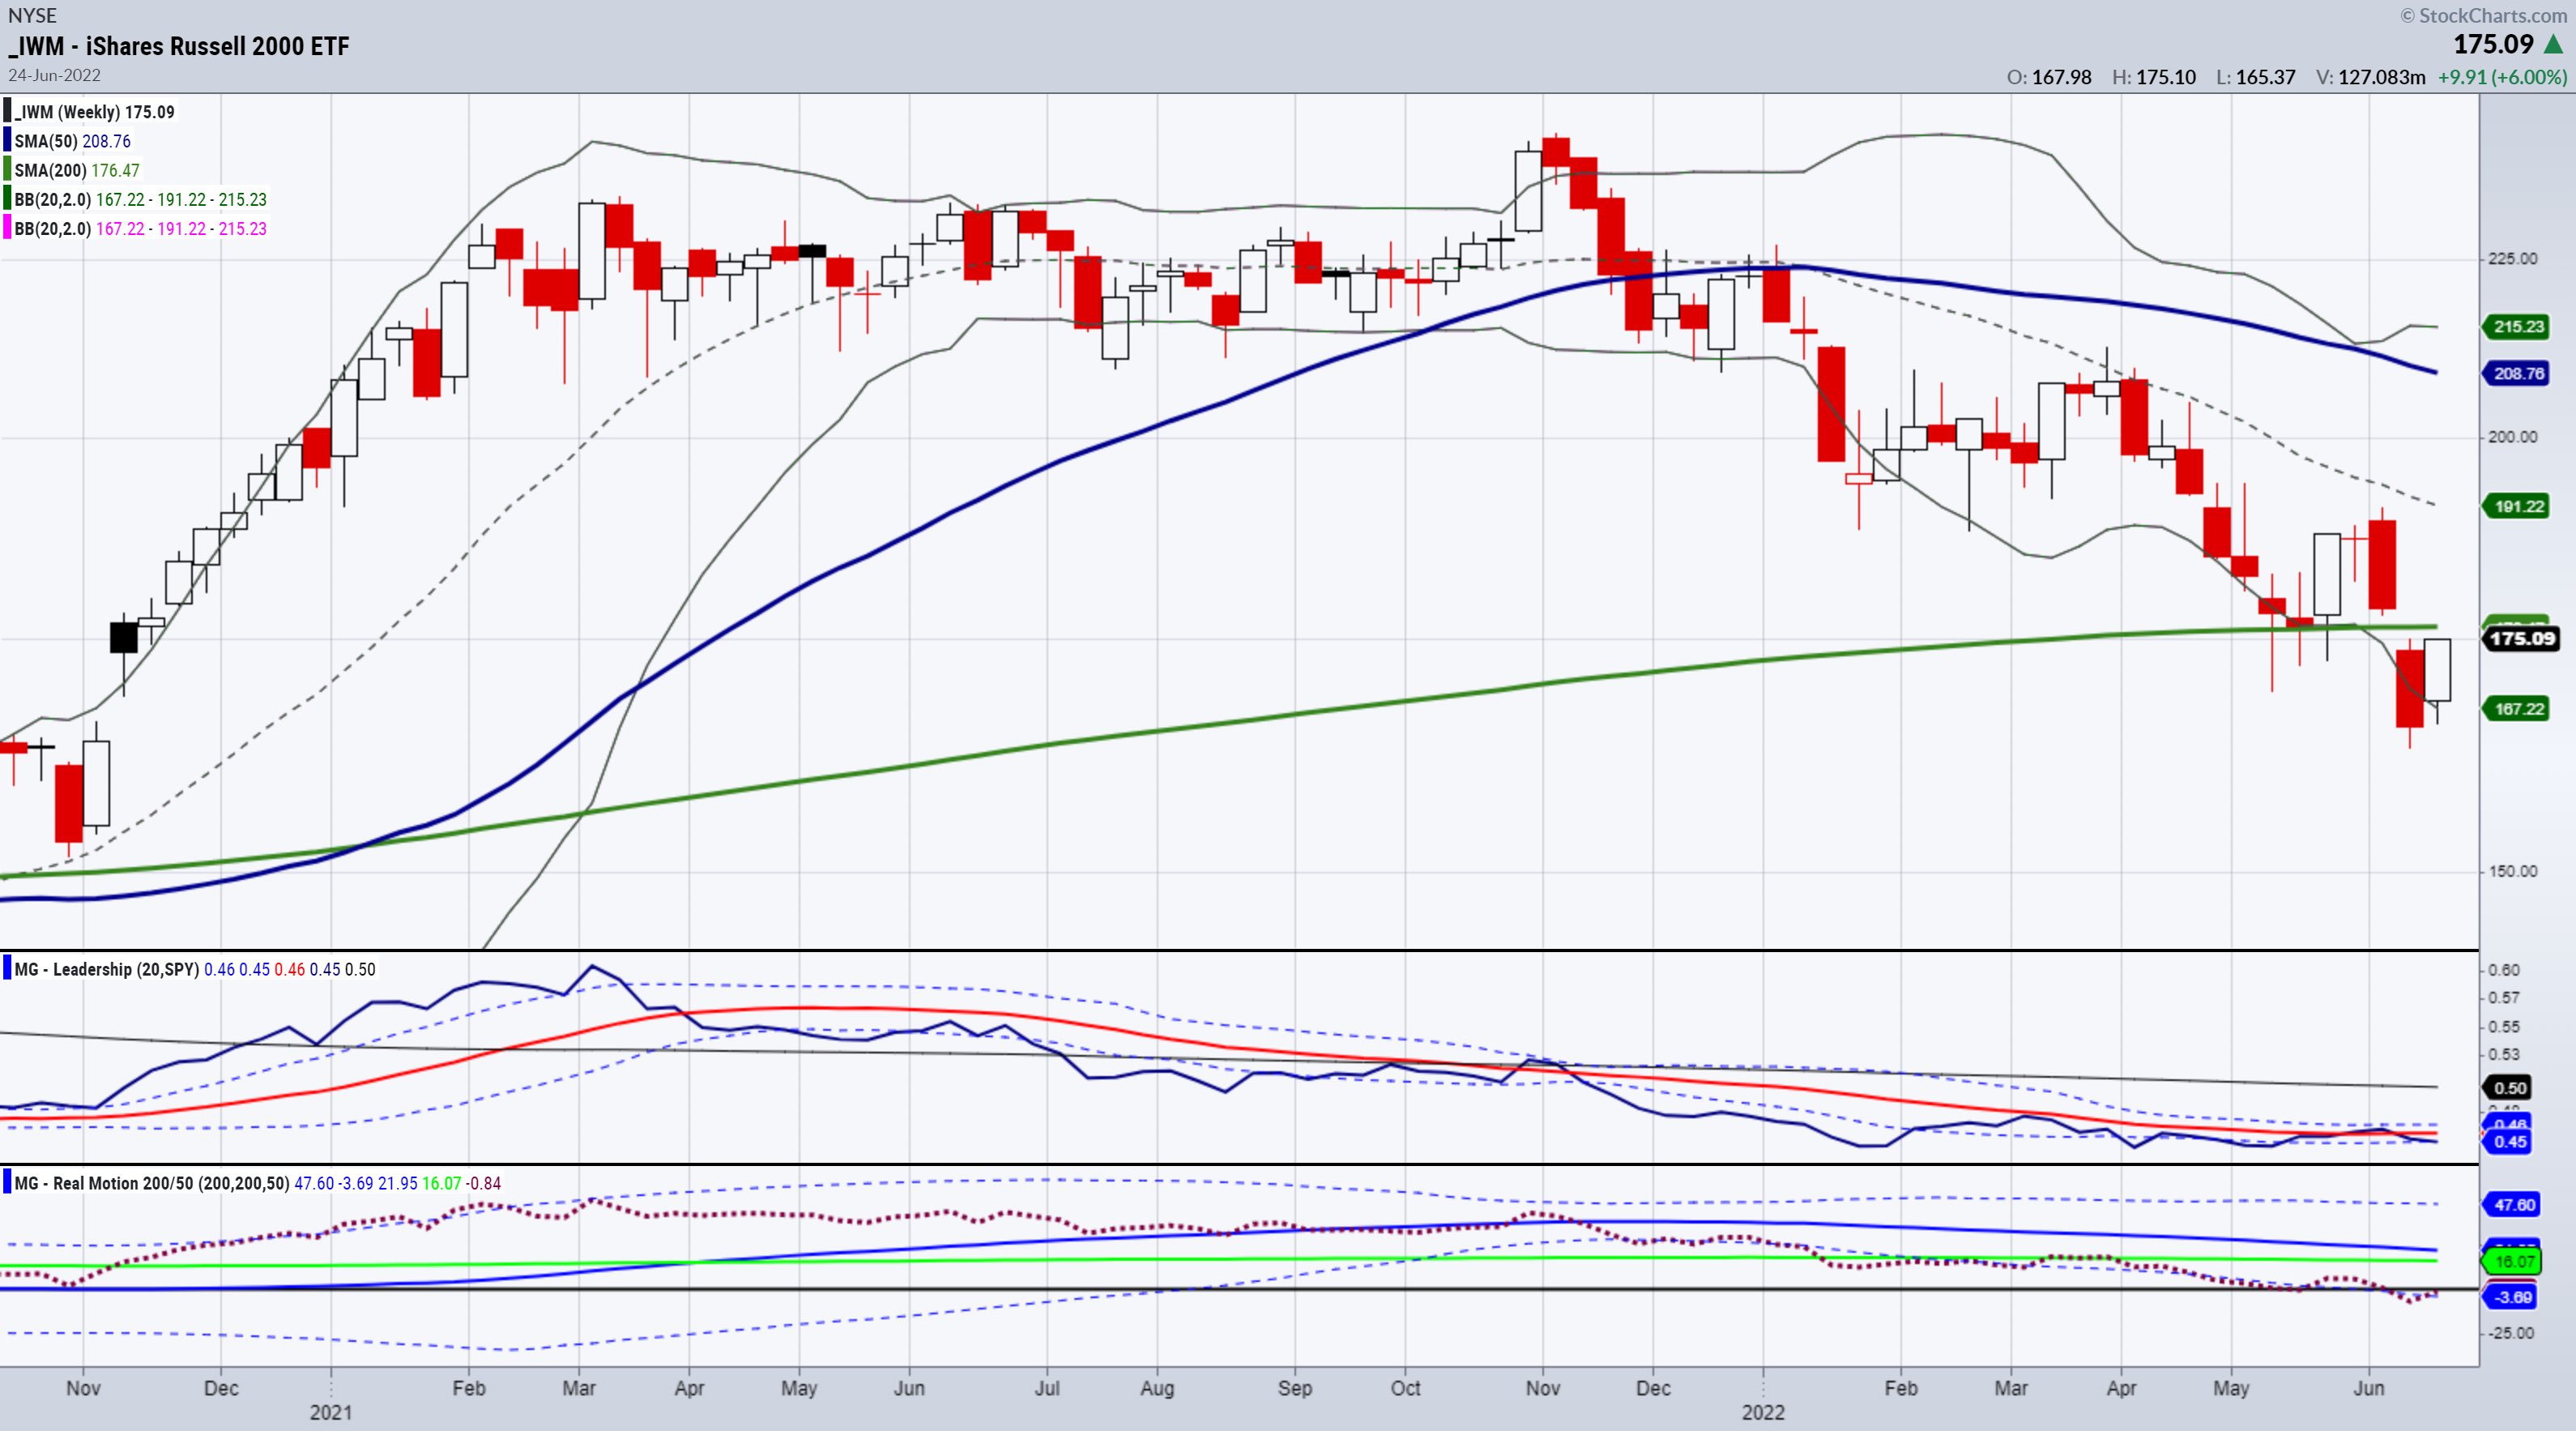
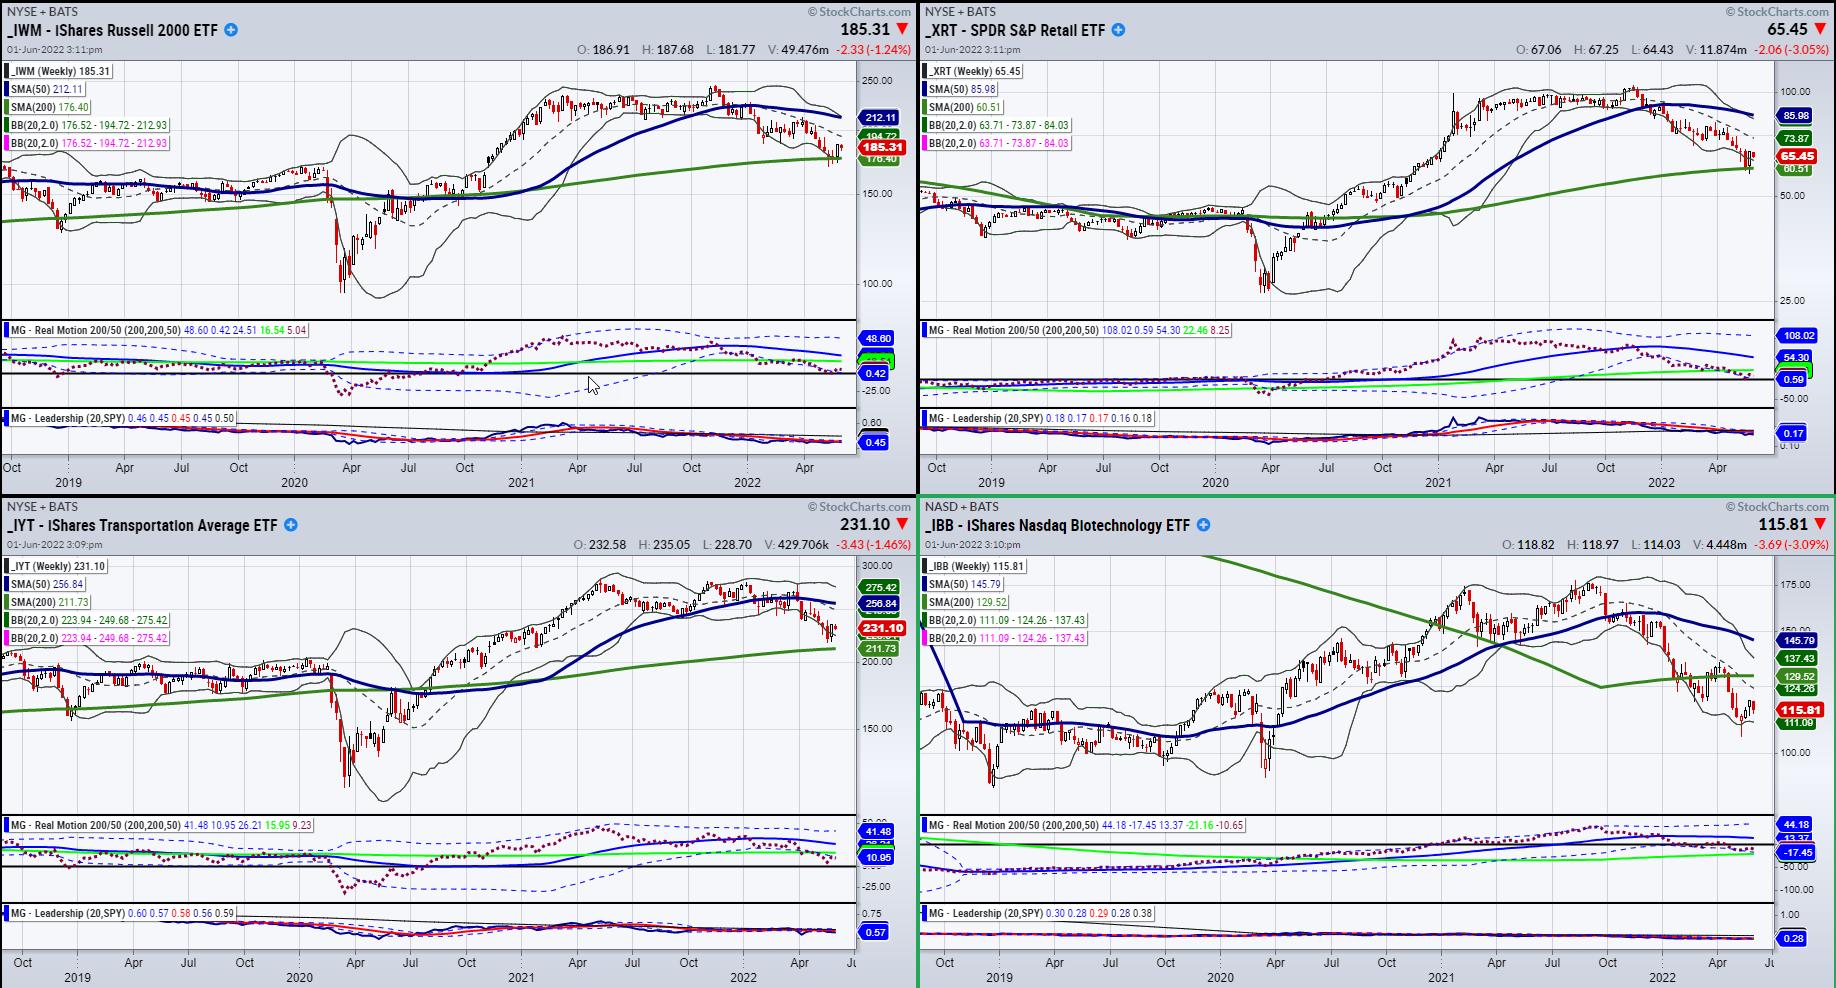
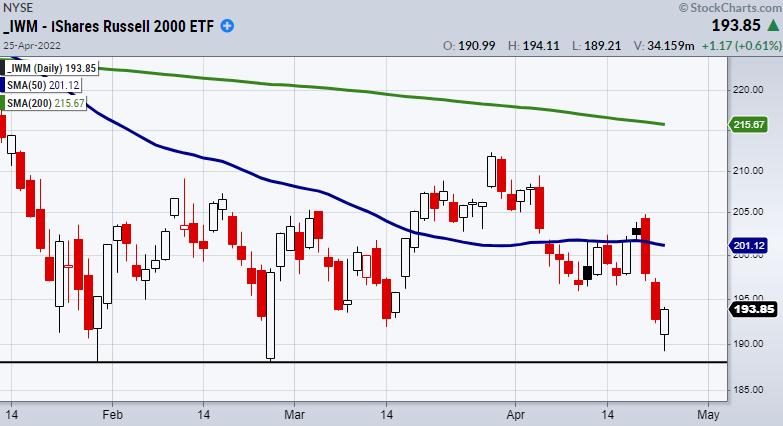
Watch for The Nasdaq 100 and S&P 500 to Clear Their Mini-Ranges
On Wednesday, the Russell 2000 (IWM) failed to make a second close over its 50-day moving average.
As the current leader of the major indices, IWM has been playing a very important role in the overall market direction. While Tuesday's strength in IWM hasn't carried over,...
READ MORE
MEMBERS ONLY
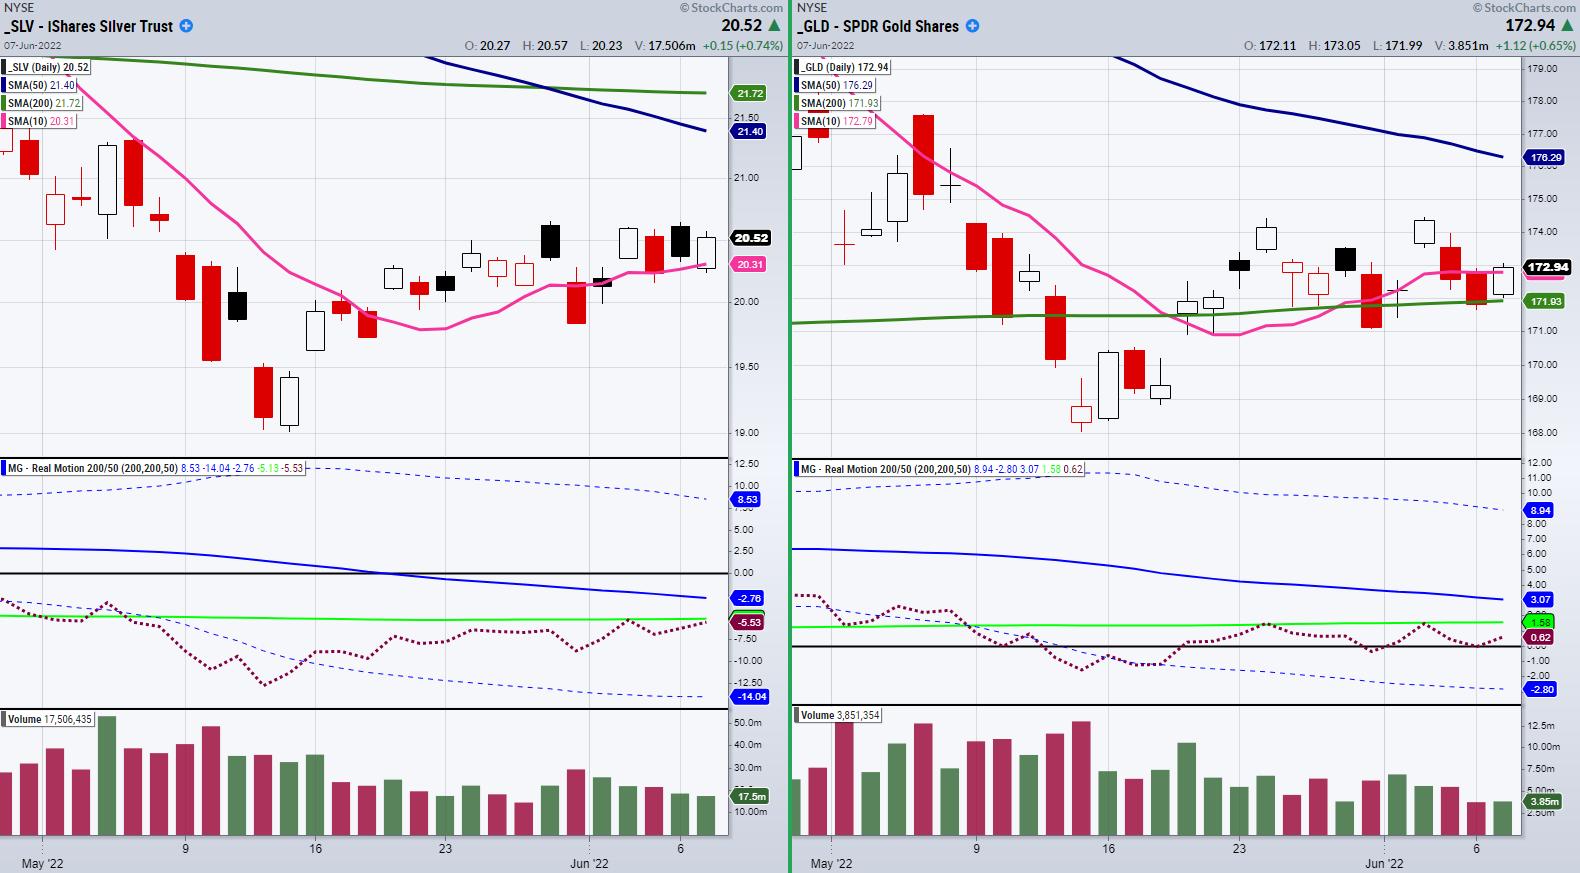
Are Gold and Silver Ready for a Momentum Breakout?
Although we are watching for another step up in the major indices, we are also looking at safety plays in commodities. Specifically, analyzing precious metals such as gold (GLD) and Silver (SLV), one thing stands out when using our Real Motion indicator. While both symbols have similar price action, one...
READ MORE
MEMBERS ONLY
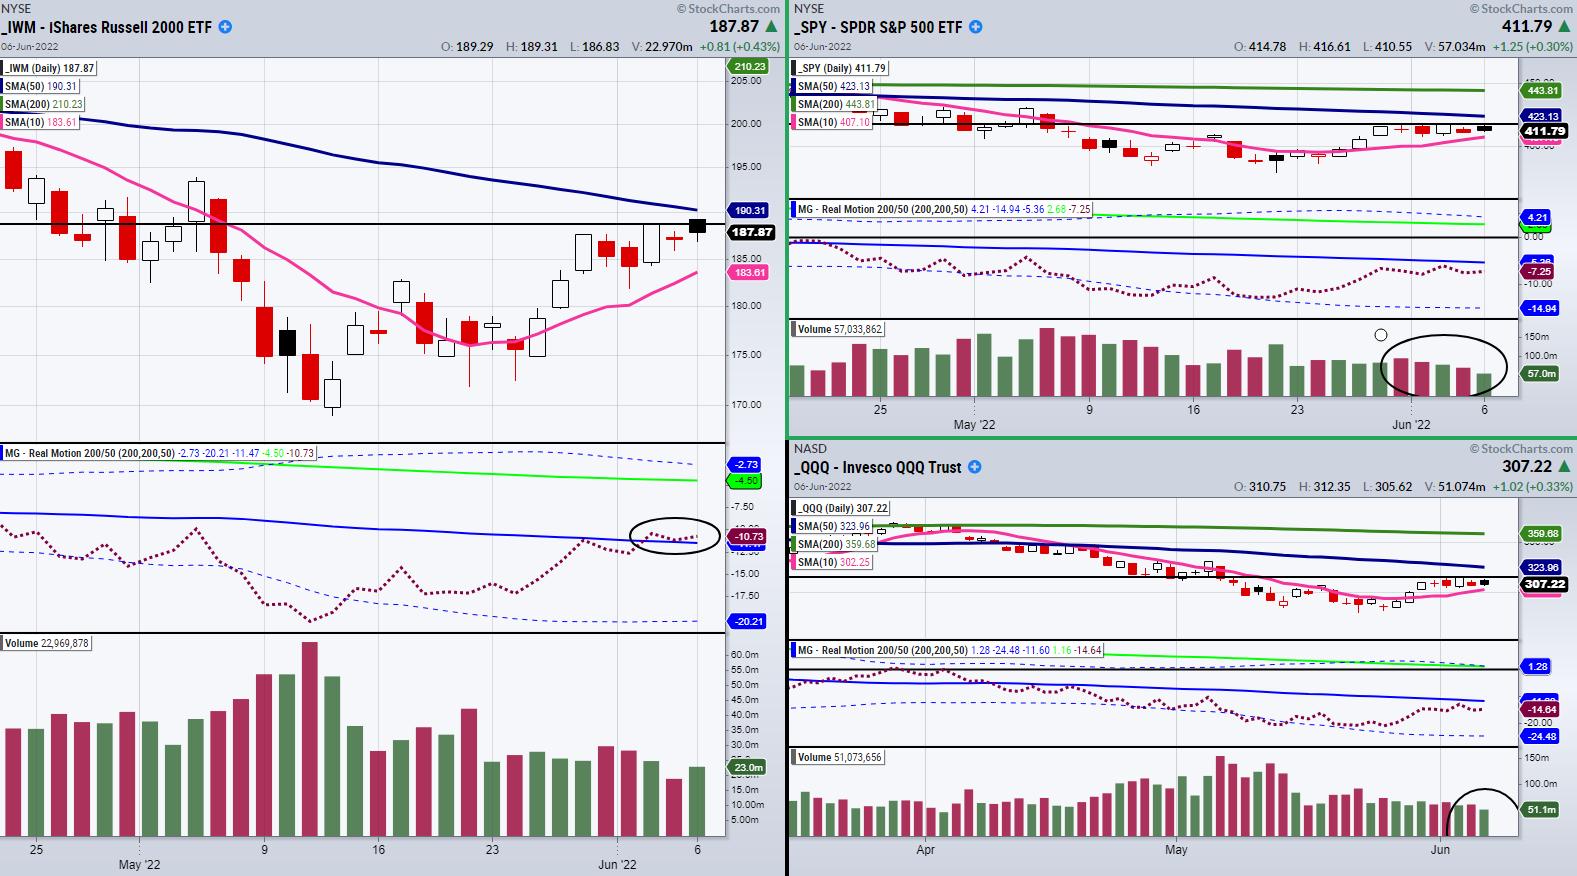
3 Things Need to Align for The Next Big Market Move
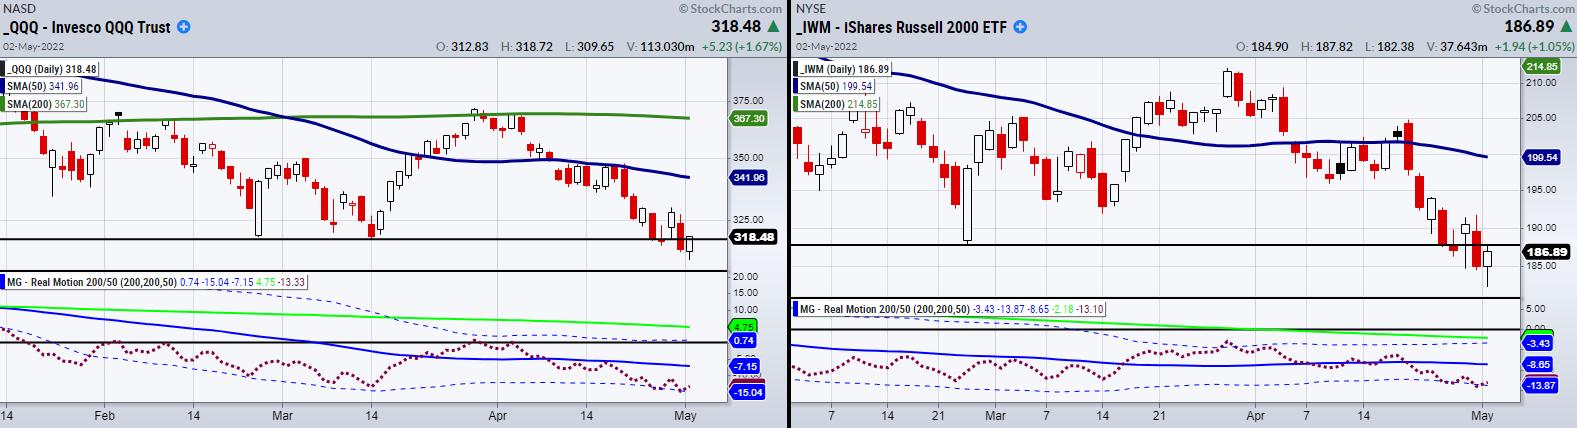
Currently, the small-cap index Russell 2000 (IWM) is leading in momentum compared to the S&P 500 (SPY) and the Nasdaq 100 (QQQ). Looking at our Real Motion momentum (RM) indicator found in the above charts, we can see that RM is barely leading over the 50-DMA, while the...
READ MORE
MEMBERS ONLY
Why We are Focusing on Alternative Energy Symbols
It has been a tough year to pick winning stocks, and, with more uncertainty ahead, now is not the time to be heavily invested in tech and big names that have broken down in price over the recent months. Currently, oil and energy-related plays have been outperforming, and, with that,...
READ MORE
MEMBERS ONLY
Is The Stock Market Looking for Temporary Relief?
The Russell 2000 (IWM) closed over its previous 3 trading days, making a small breakout from a consolidation area that has also held over its 10-Day moving average at $181.38. Additionally, many of Mish's Economic Modern Family members are following the same pattern as seen in the...
READ MORE
MEMBERS ONLY
Mish's Daily: What Does a Trading Range Look Like?
Buying ahead of taking out last week's high was premature. Getting overly negative unless we fail last week's low is equally premature.
I realize how sexy it is to be either very bullish or very bearish. And I realize that given many different reasons, the sentiment...
READ MORE
MEMBERS ONLY
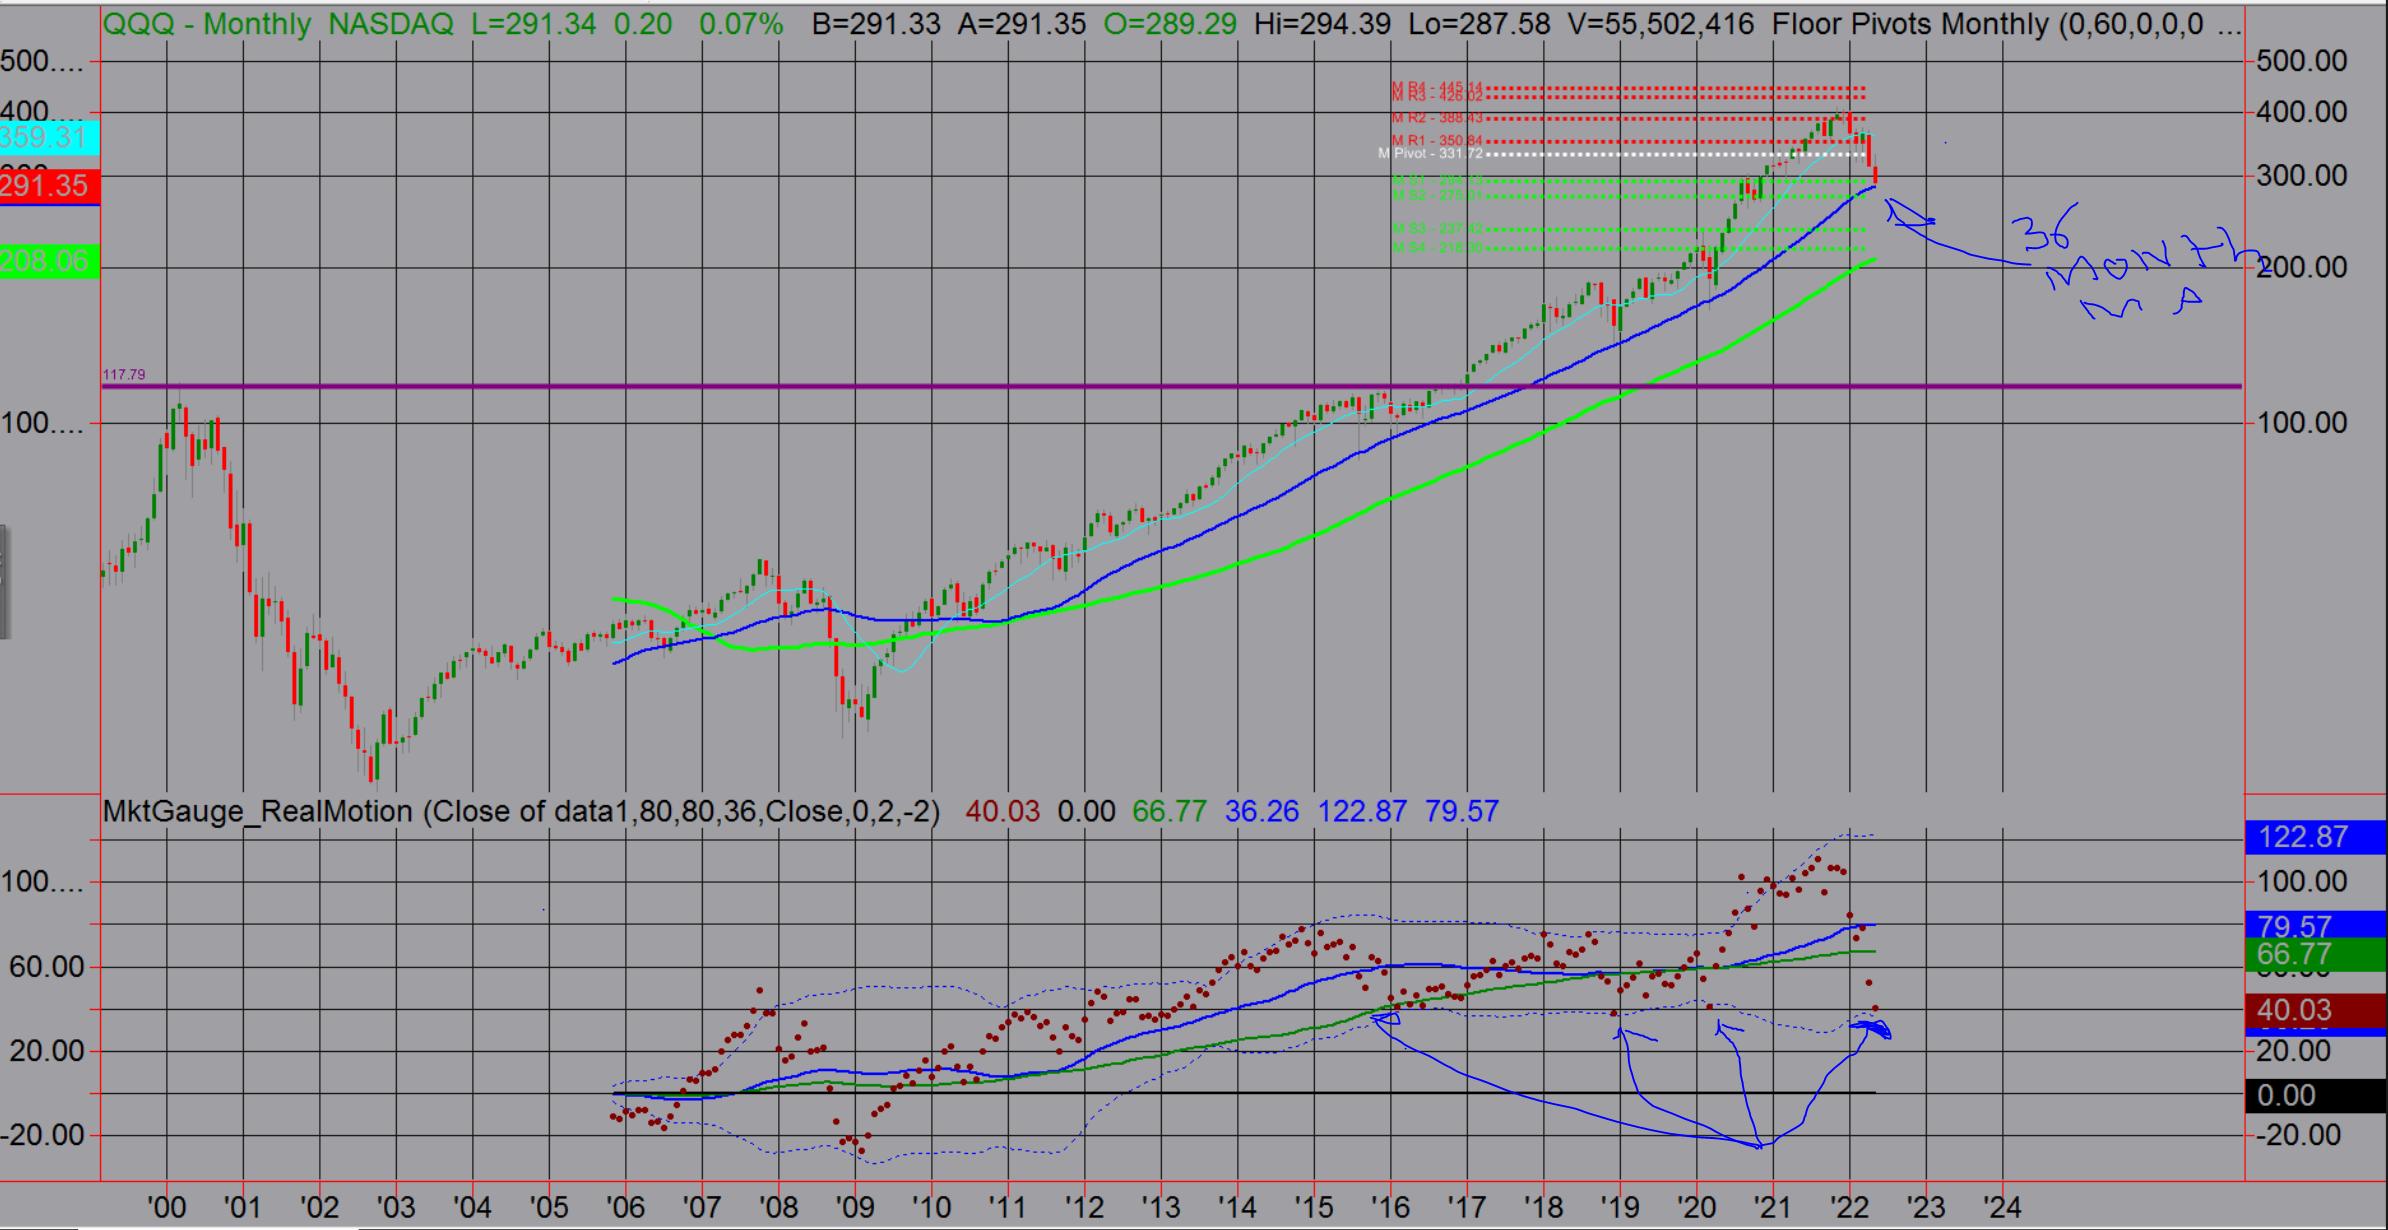
Mish's Daily: Can Big Tech Save the Day Again?
Since 2010, QE saved the markets and the economy, which in turn led to big tech as the 10-year bull market savior. The monthly chart of QQQs, which goes back from the dot com bubble, highlights the run that began in 2010. Yet it also shows that it took another...
READ MORE
MEMBERS ONLY
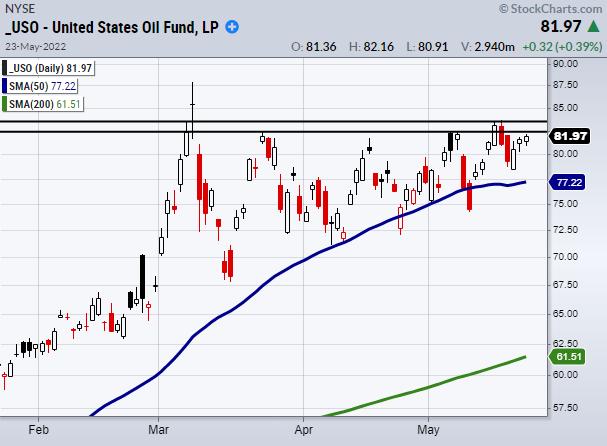
Keep Oil and Energy Companies on Your Watchlist
Energy plays have some of the best chart setups right now, from a momentum breakout standpoint. A perfect example of this can be seen in the above chart of the United States Oil Fund (USO).
Currently, USO has been consolidating within an upward trend near its key resistance area, from...
READ MORE
MEMBERS ONLY
Has Stock Market Selling Become Exhausted?
For the moment, the downward trend remains intact as the market and media embrace more negative news. News of a housing market top, increasing inflation, geopolitical stress and more add a dampener to investor sentiment. However, when everyone becomes bearish and is calling for more decay, this could be a...
READ MORE
MEMBERS ONLY
Is Oil Gearing Up for a Big Move?
The country has been under pressure from rising gas prices for months.Even before the Ukraine war, gas was steadily increasing. While the U.S continues to look for solutions to manage prices, from releasing oil reserves to increasing imports, the oil sector could be looking for another big move...
READ MORE
MEMBERS ONLY
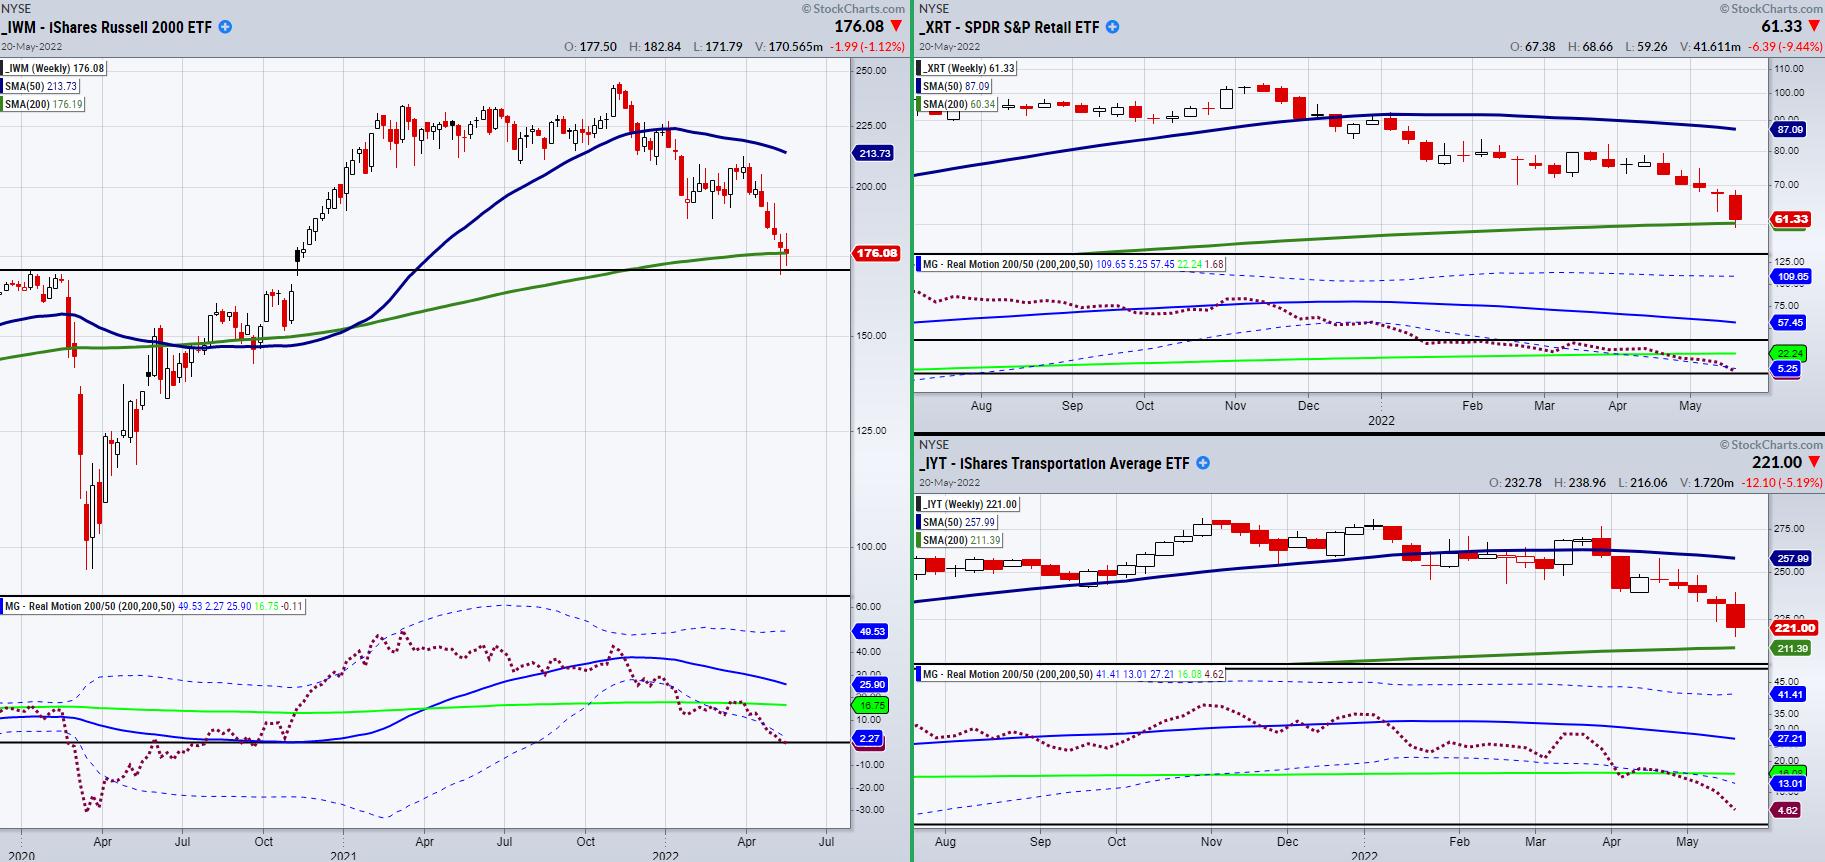
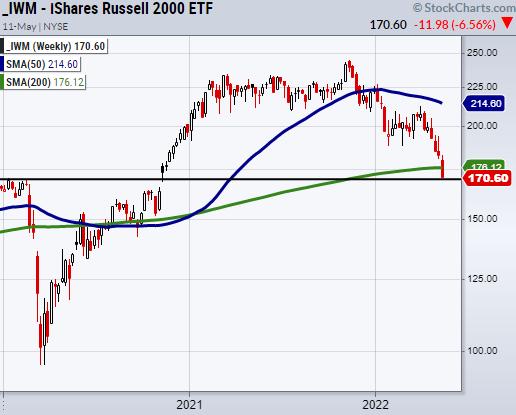
Watch the 200-Week Moving Average on These 3 Symbols
The small cap-index Russell 2000 (IWM) is hanging onto support from the 200-week moving average at $176.19. Last week, it dipped below the moving average with a low of $168.90. With that said, it looks as though IWM is trying to find temporary support in this price area...
READ MORE
MEMBERS ONLY
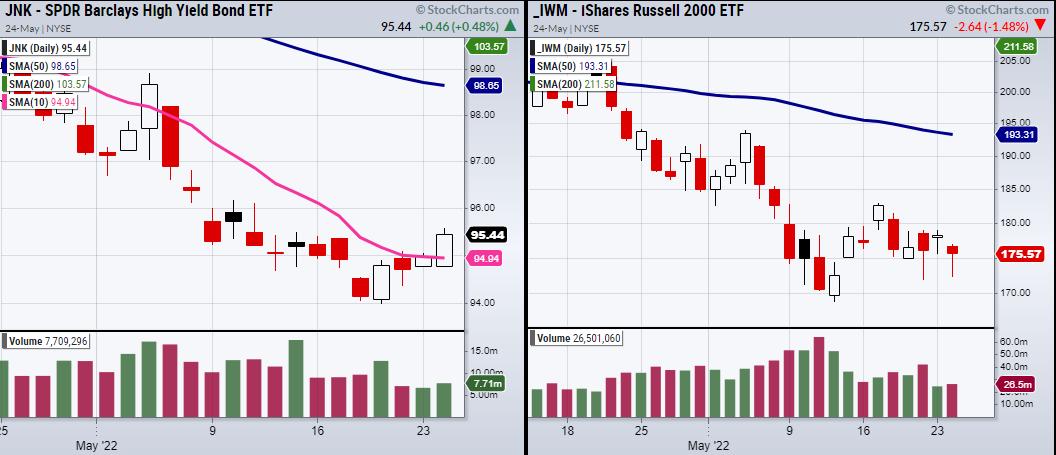
How Junk Bonds Saved Us from Loading Up on Equities
The Rally failed to carry the major indices past key resistance levels. This can be seen in the above chart of the S&P 500 (SPY), Nasdaq 100 (QQQ) and the Russell 2000 (IWM). Lines are drawn for previous support levels that, once broken turned into important resistance points...
READ MORE
MEMBERS ONLY
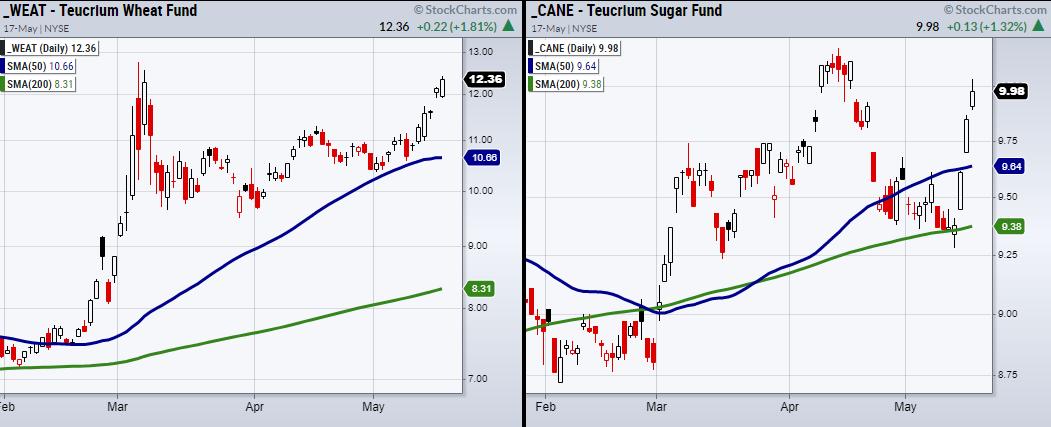
Fertilizer Companies Look to Follow the Recent Jump in Soft Commodities
So far, this week has been huge for wheat (WEAT) and sugar (CANE), with both gapping up on Monday and continuing higher. Soft commodities have been on the move, as supply chain issues involving China's COVID cases spiking and Ukraine cutting its wheat output have rapidly increased prices....
READ MORE
MEMBERS ONLY
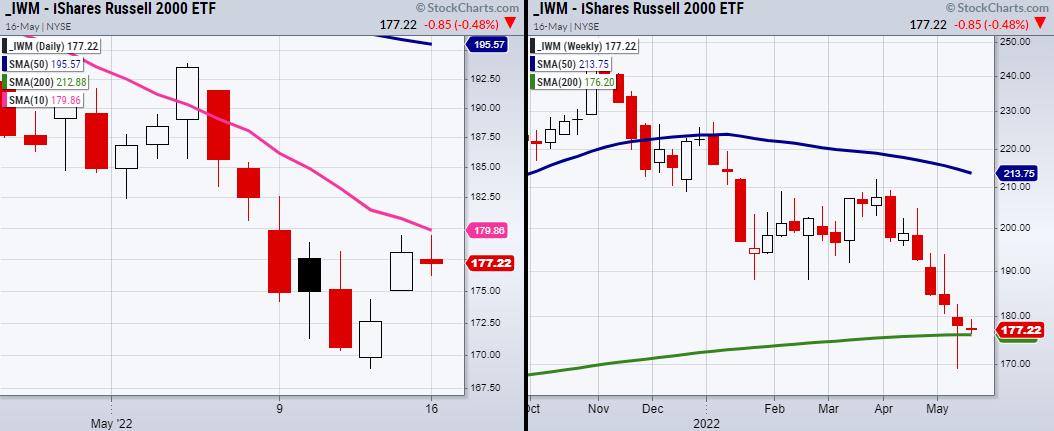
The Small-Cap Index Needs to Clear The 10-DMA and Hold Its 200-WMA
On Monday, the small-cap index Russell 2000 (IWM) tested its past Friday high at $179.41, but ultimately could not hold. Just above this price level stands the 10-day moving average at $179.86; this will be the next pivotal area for IWM to clear if we are going to...
READ MORE
MEMBERS ONLY
3 Key Sectors to Watch with Hidden Momentum
Mish's Economic Modern Family looks to have found temporary support, as each of the members has closed over the prior day's high, providing relief from the downward trend. However, will this last, or is the rally a potential trap before the market breaks lower?
If we...
READ MORE
MEMBERS ONLY
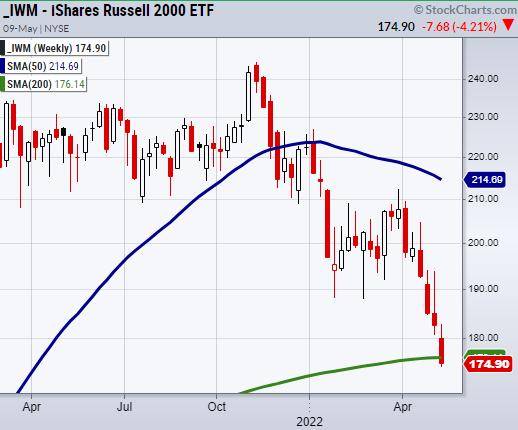
How Much Further Can the Stock Market Break Down?
Taking a step back and looking at important reference points and percentages helps us grasp where the stock market is and where it's potentially going.
Focusing on the small-cap index, the Russell 2000 (IWM) has broken its 200-Week moving average at $176.13. The last time IWM was...
READ MORE
MEMBERS ONLY
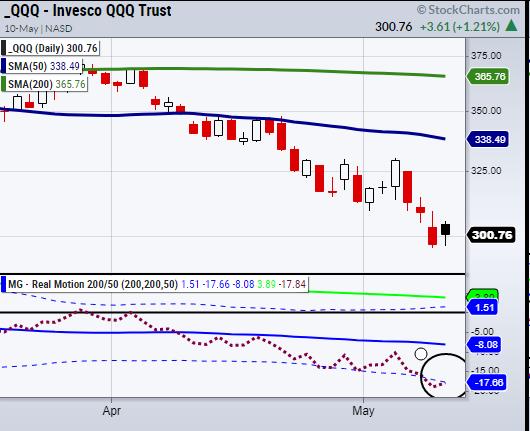
Why We are Focusing on Commodities Over Equities
On Tuesday, the Nasdaq 100 (QQQ) outperformed the other indexes, ending the day +1.20%, while other major indices closed roughly flat on the day.
From the momentum side, our Real Motion (RM) indicator is flirting with the lower band. This can be seen circled in the above chart. If...
READ MORE
MEMBERS ONLY
How to Handle Monday's Major Liquidity Crunch
All the major indices tumbled on Monday, leading to a large liquidation. Even safety plays, such as precious metals like gold (GLD) and silver (SLV), were down on the day. Many are wondering what to do, as most financial planners tell their clients to hold onto positions since the market...
READ MORE
MEMBERS ONLY
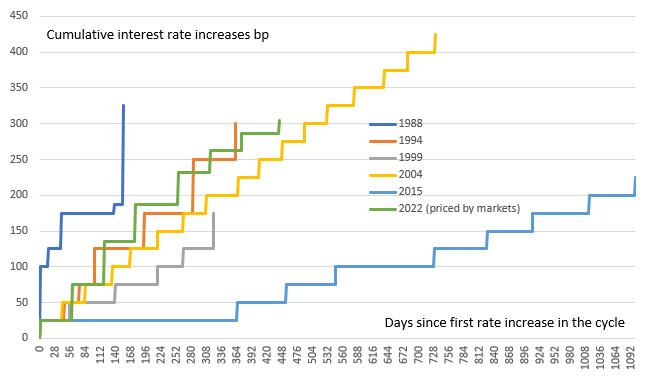
Should the Fed Entertain .75% Interest Rate Hikes Going Forward?
Inflation is a spotlight topic in the media, with more reports and predictions surfacing every day. Since the Fed has been sorely wrong on its inflation predictions, the country is closely monitoring interest rate hikes. As prices increase and potentially look to move higher, people are feeling the pain.
While...
READ MORE
MEMBERS ONLY
Why the Nasdaq 100 (QQQ) Is a Great Trade Example for Thursday
The rate increase came in, as expected, at half a percent, showing that the Fed is going for the safest play instead of pushing for a .075% increase.
With that announcement, the market made a late-day rally. While all the major indices have similar price action, we will focus on...
READ MORE
MEMBERS ONLY
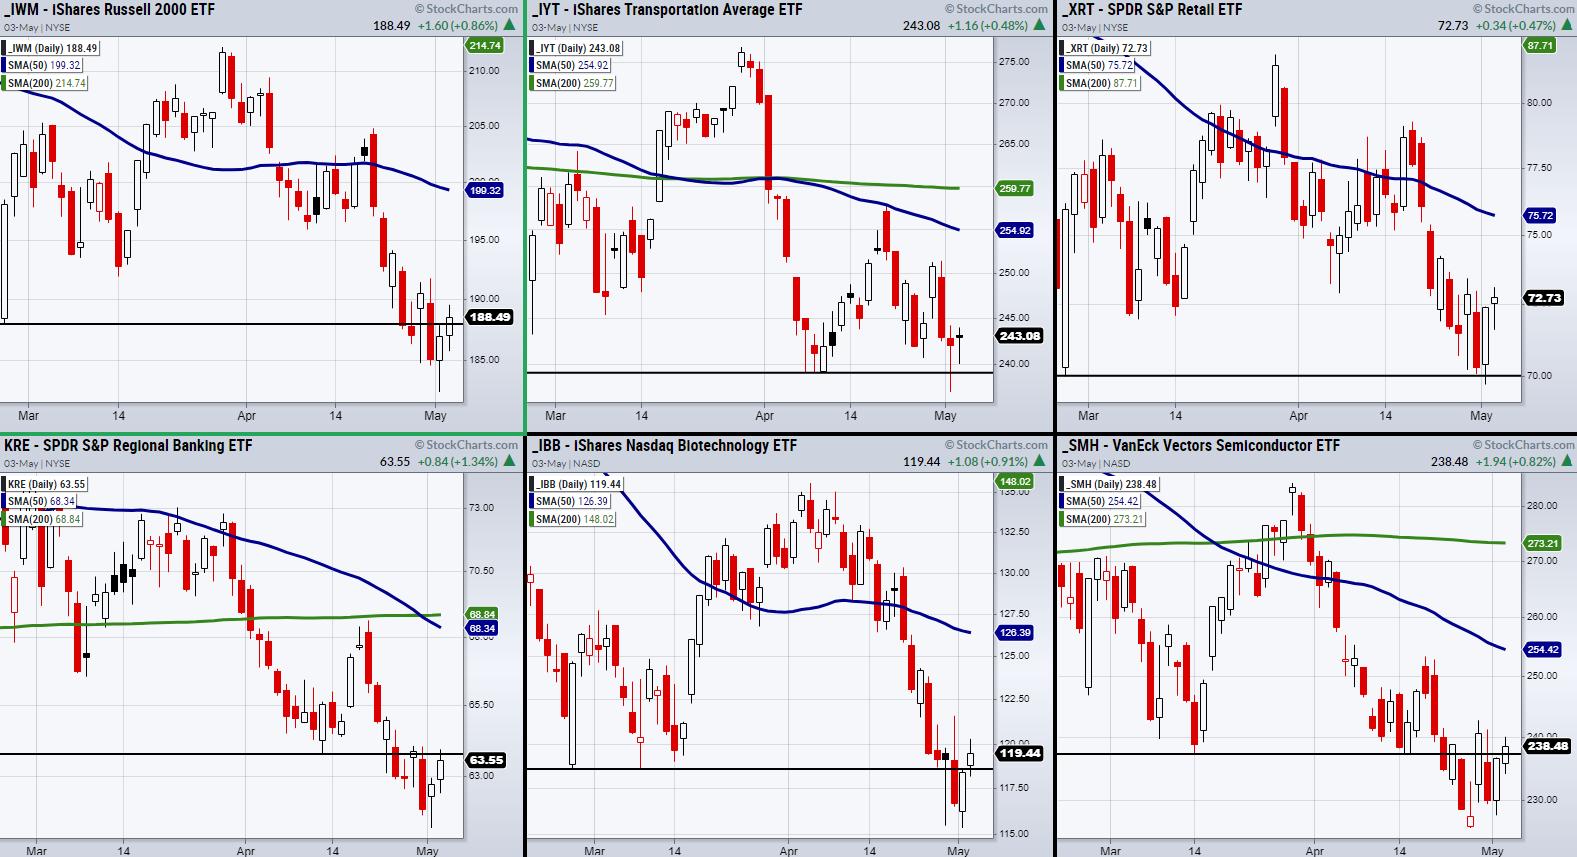
Can Transportation (IYT) and Retail (XRT) Make a Positive Momentum Divergence?
In reference to Monday's article, we are watching for signs of a reversal in the major indices based on price and momentum. As a follow-up, we can also look at Mish's Economic Modern Family to see which areas are holding, with strength going into Wednesday'...
READ MORE
MEMBERS ONLY
Watch for Key Resistance to Clear and Hold Before Wednesday's Fed Announcement
This Wednesday, the Fed will announce an interest rate increase. So far, expectations are for +0.5%. While some believe this is too high, as the market is struggling, others believe the Fed needs to be more aggressive and push rates up by 0.75%.
One reason for a smaller...
READ MORE
MEMBERS ONLY
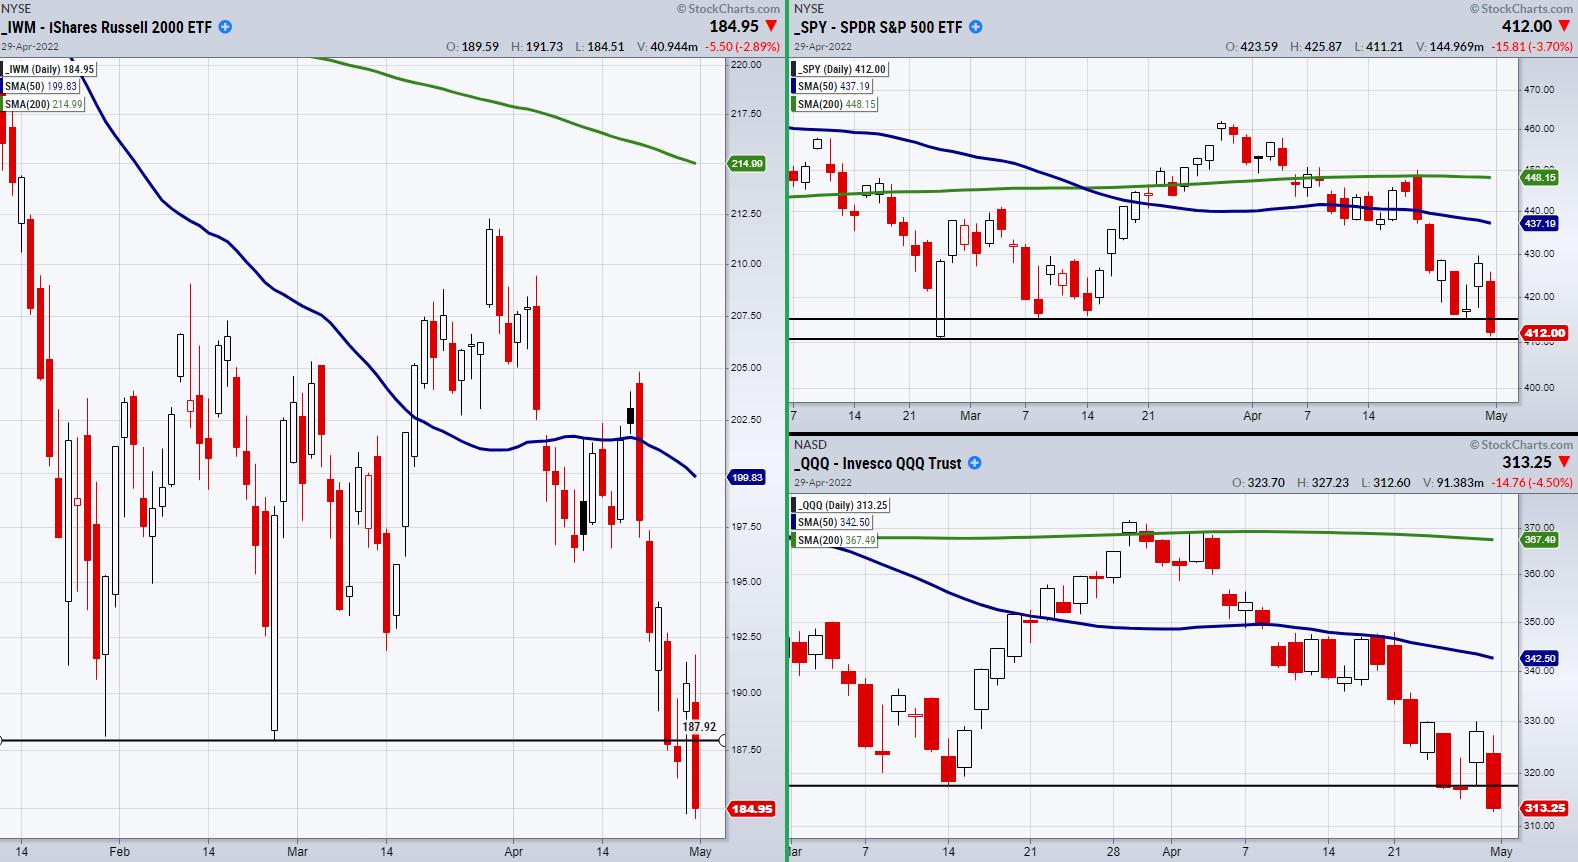
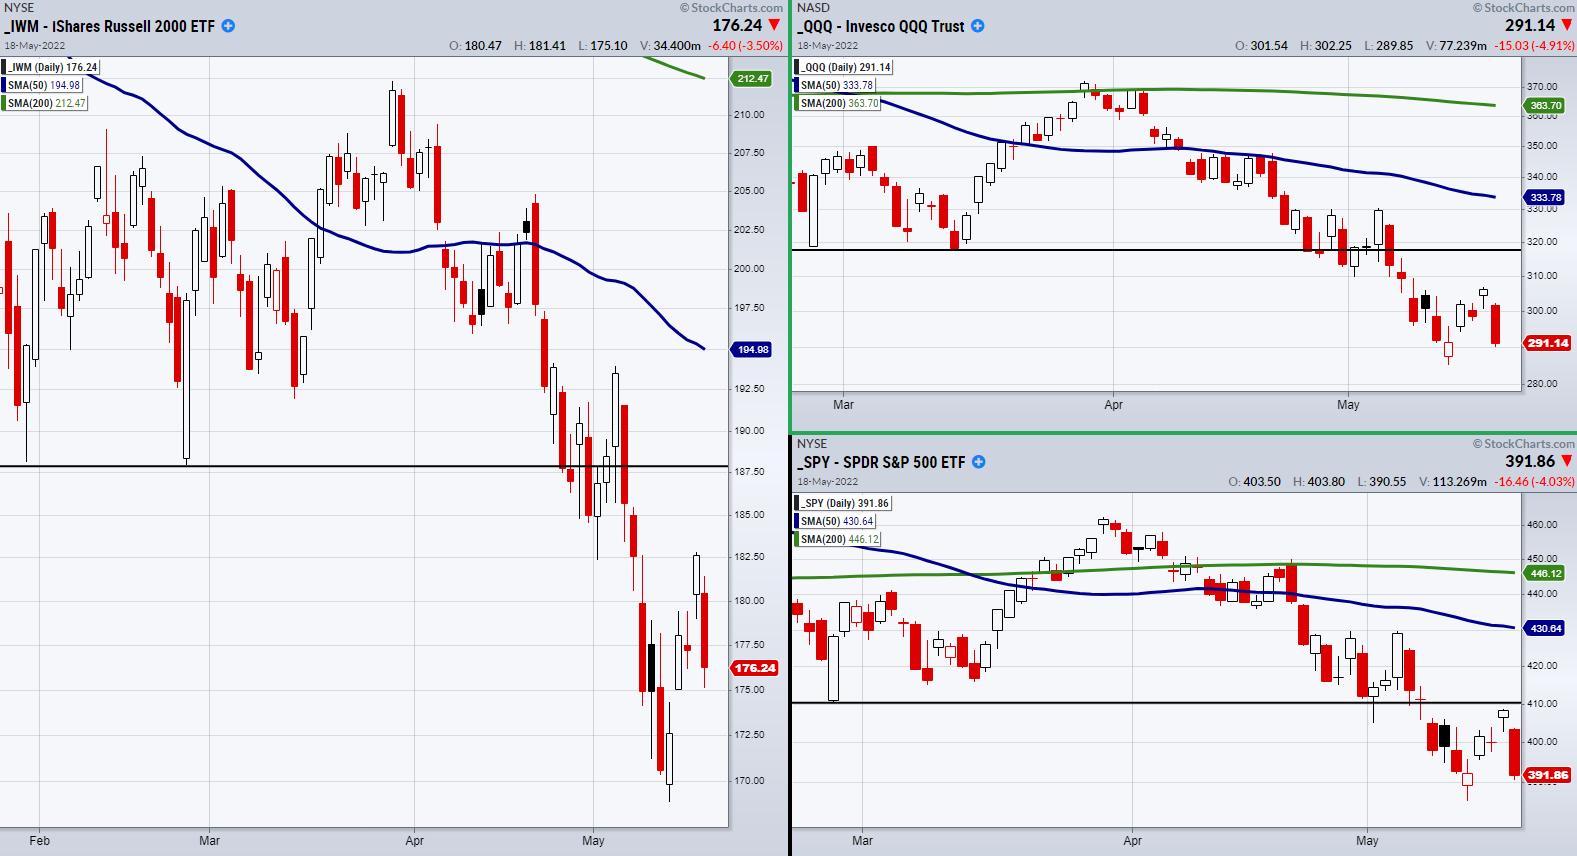
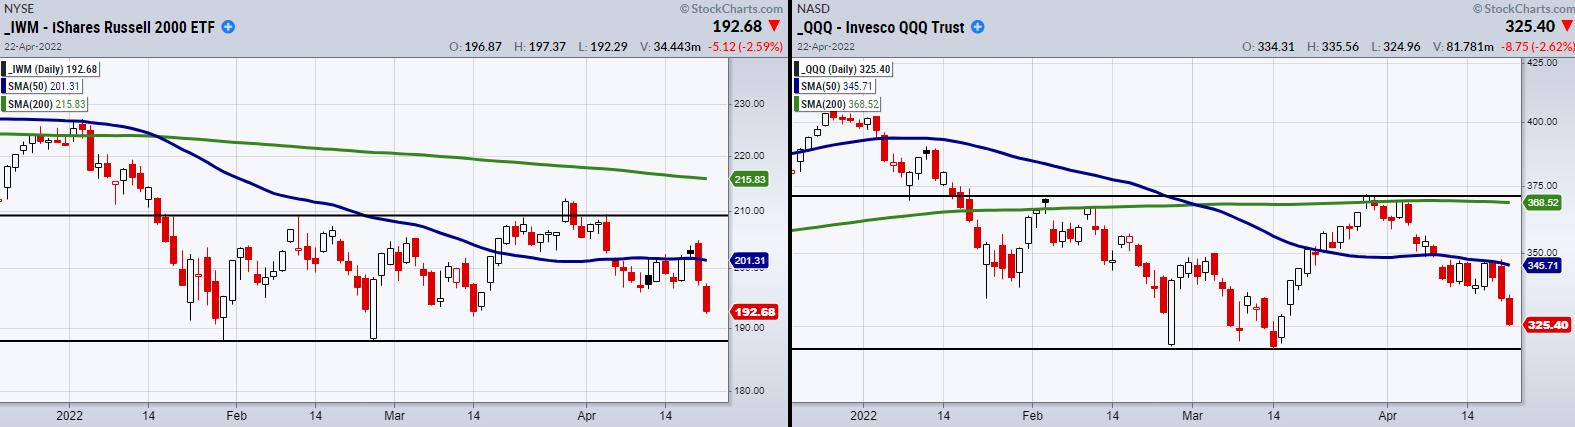
Will The Stock Market Bloodbath Continue?
On Friday, the Nasdaq 100 (QQQ) closed -4.4% on the day. Not far behind came the S&P 500 (SPY) at -3.6%, along with the Russell 2000 (IWM) at -2.8%. This comes after each failed to hold support from previous lows dating back to mid-March.
While...
READ MORE
MEMBERS ONLY
Why Traders Should Be Waiting for Confirmation When Buying Dips
For the past 10 years, dip-buying weakness has worked out very well, as the market has only been under pressure for short periods. However, the economy and world are in a new situation, one that involves geopolitical stress, rising inflation and the continued recovery from the pandemic.
With that said,...
READ MORE
MEMBERS ONLY

The Economic Modern Family Breaks Down
Mish's "Economic Modern Family" is made from 7 keys symbols that act as a guide for the stock market macro picture. The Family consists of the small-cap Russell 2000 index (IWM), Transportation (IYT), Retail (XRT), Regional Banking (KRE), Biotech (IBB), Semiconductors (SMH) and Bitcoin (BTC).
Just...
READ MORE
MEMBERS ONLY
Is the Small-Cap Index Showing a Dip-Buying Opportunity?
On Monday, the small-cap index Russell 2000 (IWM) found support near the bottom of its range. After last week's selling, this could either be a temporary bounce or a fake-out before weakness again sets in.
Because we are looking at the stock market from a rangebound perspective, we...
READ MORE
MEMBERS ONLY
How to Prepare for Monday by Watching Trading Range Lows
After both the Russell 2000 (IWM) and the Nasdaq 100 (QQQ) failed to hold or clear over the 50-day moving average (blue line), the bleeding has not stopped. Now that IWM and many key ETFs are near the bottom of their trading range, how should we prepare for next week?...
READ MORE
