MEMBERS ONLY
Tape and Fed Outweigh Seasonality

by Arthur Hill,
Chief Technical Strategist, TrendInvestorPro.com
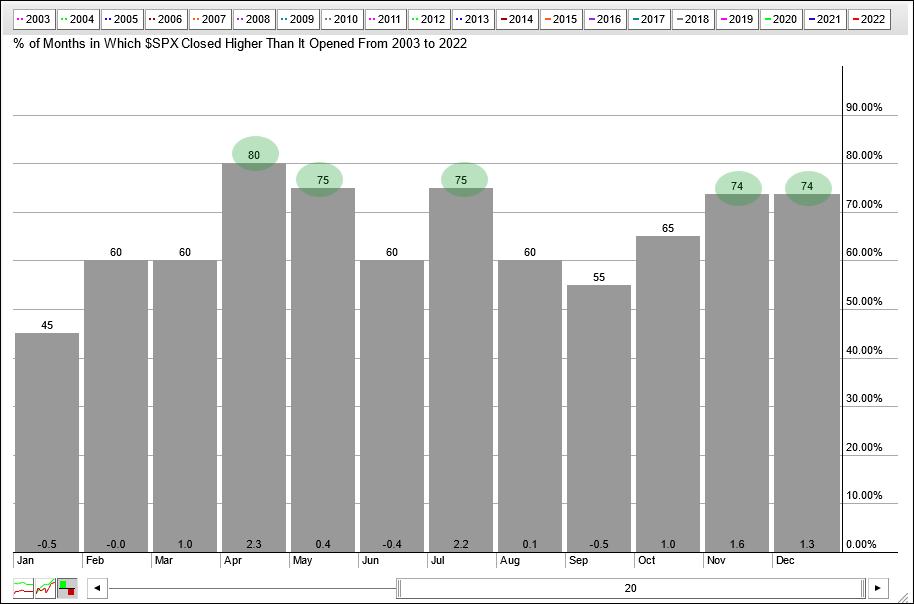
The seasonal patterns for October and yearend are quite positive, but seasonality is just one aspect of broad market analysis and the weight of the evidence remains bearish.
The histogram below shows the seasonal patterns for the S&P 500 over the last twenty years. Five of the twelve...
READ MORE
MEMBERS ONLY

Do We Have A BIG Drop Ahead?

by Tom Bowley,
Chief Market Strategist, EarningsBeats.com
I have a feeling that most of you would say "Yes, there's no way we've reached bottom."
Let me start by saying that calling tops and bottoms is GREAT if you get it right. For me, it's not about calling every stock...
READ MORE
MEMBERS ONLY

GNG TV: Earnings Do Not Equal Trends

by Alex Cole,
Co-founder, GoNoGo Charts®

by Tyler Wood,
Co-founder, GoNoGo Charts®
In this week's edition of the GoNoGo Charts show, Alex and Tyler take a look at some stocks that had big moves around earnings this week, including AT&T and IBM. Alex also runs through an example (Netflix) of using information from traditional technical analysis (in this...
READ MORE
MEMBERS ONLY

Simple Tools to Improve Timing

by Joe Rabil,
President, Rabil Stock Research
On this week's edition of Stock Talk with Joe Rabil, Joe shows how he uses 2 simple MA lines to tell when we should be thinking BUY and when we should be thinking SELL. Employing this technique can dramatically improve your timing on entry and exits. He then...
READ MORE
MEMBERS ONLY

Sectors to Avoid if the Market Declines and Worth Consideration if it Rallies

by Martin Pring,
President, Pring Research
Last week, I suggested that some unusually bullish outside bars, in conjunction with positive short-term momentum and a favorable seasonal going into year-end, could trigger a worthwhile rally. That does not make me wildly bullish, because I still think we are in a bear market. When my long-...
READ MORE
MEMBERS ONLY
Mish's Daily: Russell 2000 -- How Money is Made and Lost in Small Caps
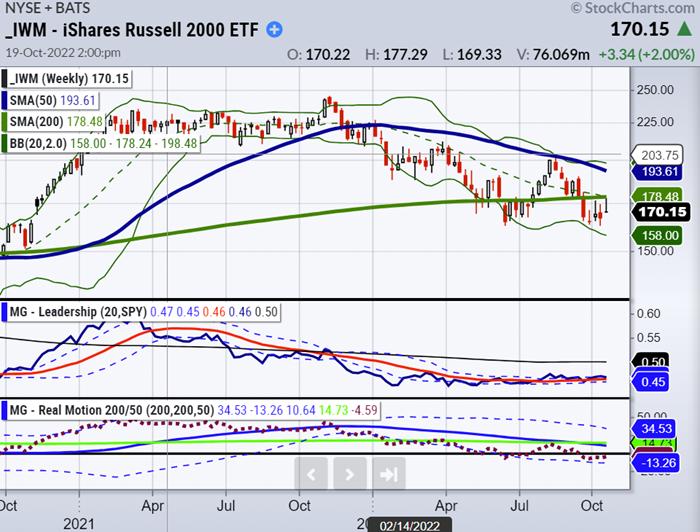
The Grandaddy Russell 2000 rallied close to its 200-week moving average (topic of our previous article) yesterday. On Wednesday, with rising yields once again, Gramps retreated.
In a bullish scenario, IWM continues to consolidate and rally in the coming days and weeks, eventually breaking through the 200-week moving...
READ MORE
MEMBERS ONLY

Market Timing - Where are We Now?

by Dave Landry,
Founder, Sentive Trading, LLC
On this week's edition of Trading Simplified, Dave discusses where we are based on market timing and shorter-term signals to watch for--signals that that would suggest the beginning of a bottom. He also presents his methodology in action by revealing a mystery chart and showing a...
READ MORE
MEMBERS ONLY

Power Charting TV: Stocks on the Edge

by Bruce Fraser,
Industry-leading "Wyckoffian"
On rare occasions stock indexes become delicately balanced between two profoundly differing scenarios. This currently seems to be one of those junctures. The most recent Power Charting TV episode explores this existential moment.
Stock indexes have been in a mega-bullish upward stride since 2009. The pace of this advance...
READ MORE
MEMBERS ONLY
Mish's Daily: The Four Indices -- Where Each Are in a 4-Year Cycle
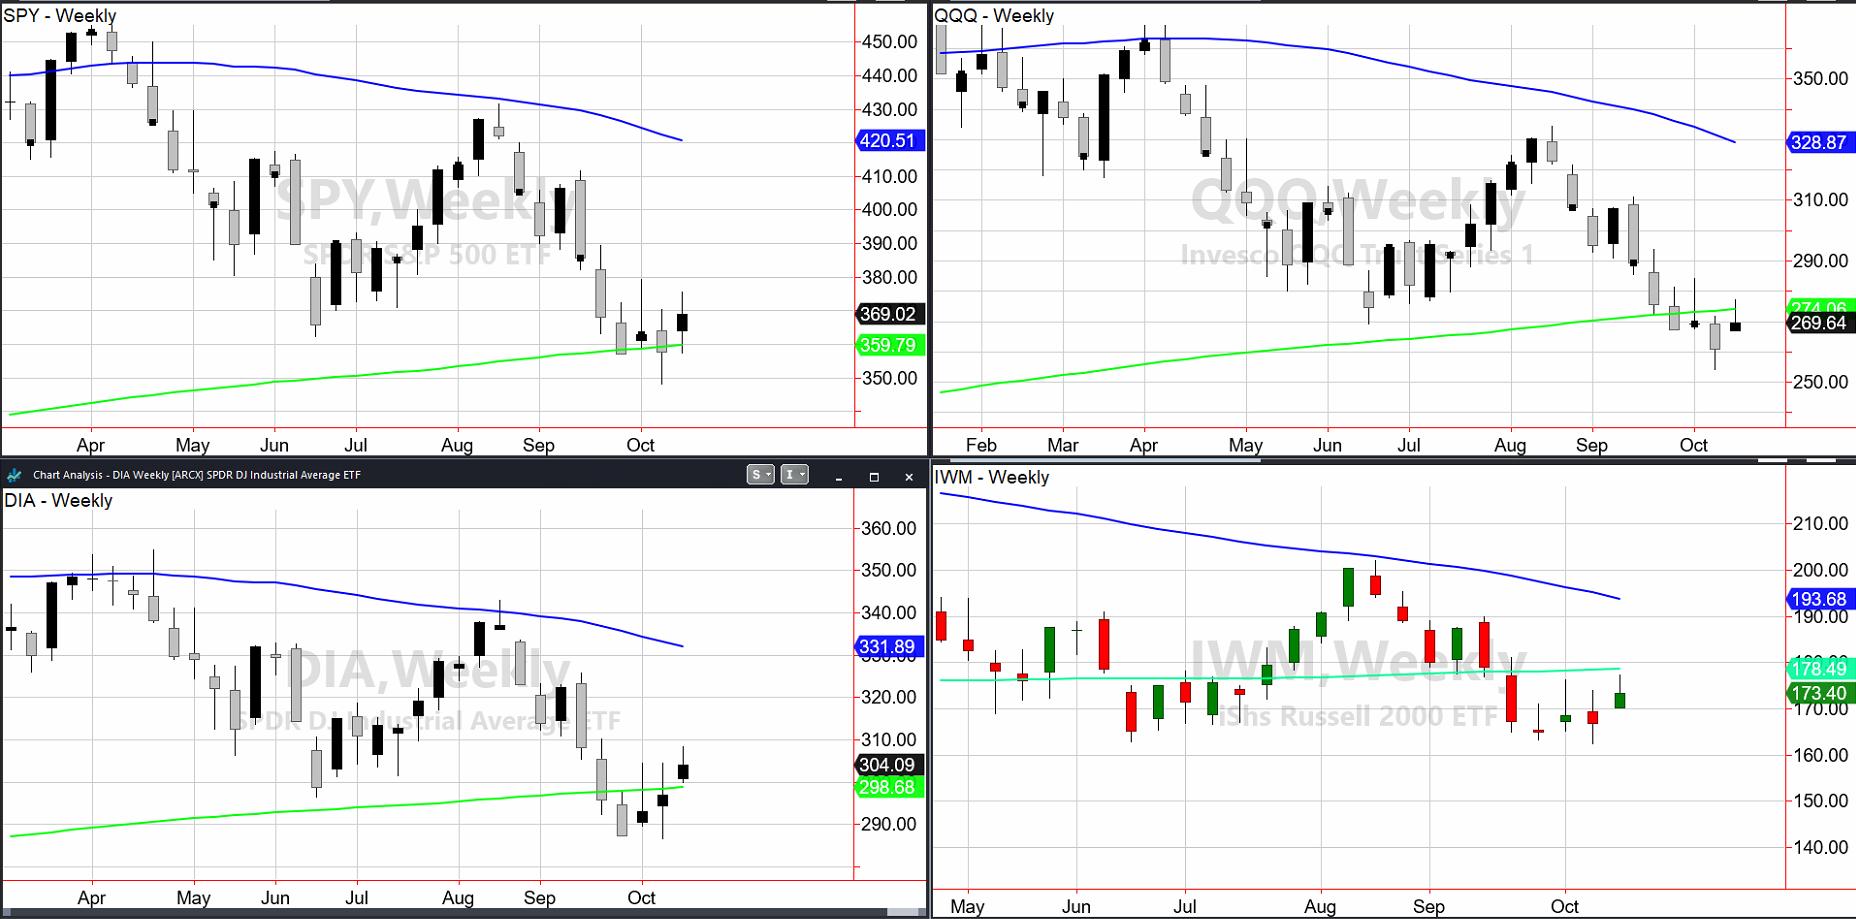
The 200-week moving average (about 4 years), represented on the charts as a green line, is starting to look like one of the more important and pivotal chart points.
There is very little written about the 200-WMA. But only once, in 2007, did the SPY break its 200-...
READ MORE
MEMBERS ONLY

Sector Spotlight: Inverted Yield Curve Looms Over Stock Market

by Julius de Kempenaer,
Senior Technical Analyst, StockCharts.com
After one week of hiatus, I'm back with a new episode of StockCharts TV's Sector Spotlight. I'll be catching up with a refresher on asset class rotation, as well as sector rotation. In the AC segment, I point to the still-inverted yield curve...
READ MORE
MEMBERS ONLY
About That Yield Curve Inversion
by Julius de Kempenaer,
Senior Technical Analyst, StockCharts.com
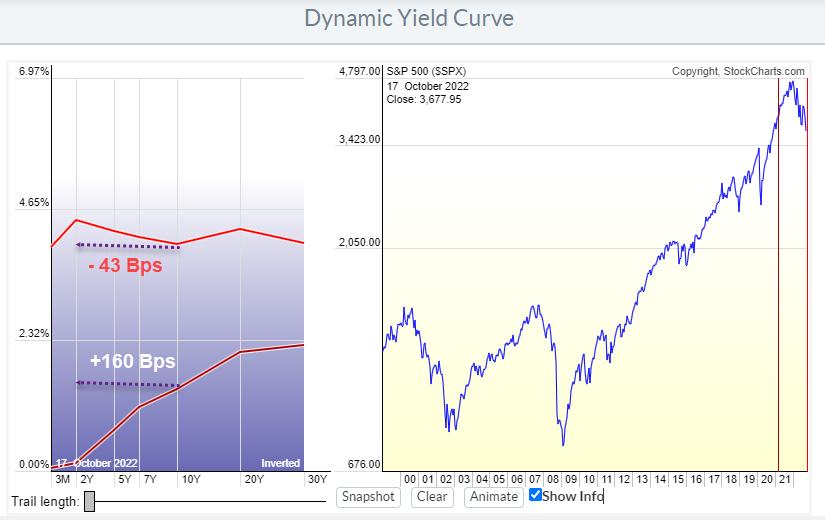
In March 2021, lending money to the US Government for ten years would give you a return of around 1.7%/ann over the next 10 years. Lending money to the government for 2 years at the same time would give you roughly 0.1%/ann for the next 2...
READ MORE
MEMBERS ONLY

Mish's Daily: 4 Indicators and The "Bear Market" Rally
The 200-week moving average or about 4-years, represented on the charts as a green line, is starting to look like one of the more important and pivotal chart points.
Although there is very little written about the 200-WMA, only in 2007 did the SPY break its 200-...
READ MORE
MEMBERS ONLY

DP Trading Room: Walk Through the Dow

by Erin Swenlin,
Vice President, DecisionPoint.com

by Carl Swenlin,
President and Founder, DecisionPoint.com
On this week's edition of The DecisionPoint Trading Room, after looking closely at the market and new positive divergences on DecisionPoint indicators, Carl opens a CandleGlance of the Dow 30 and discusses which stocks look the most encouraging. Erin dives into four sectors and their industry groups to...
READ MORE
MEMBERS ONLY
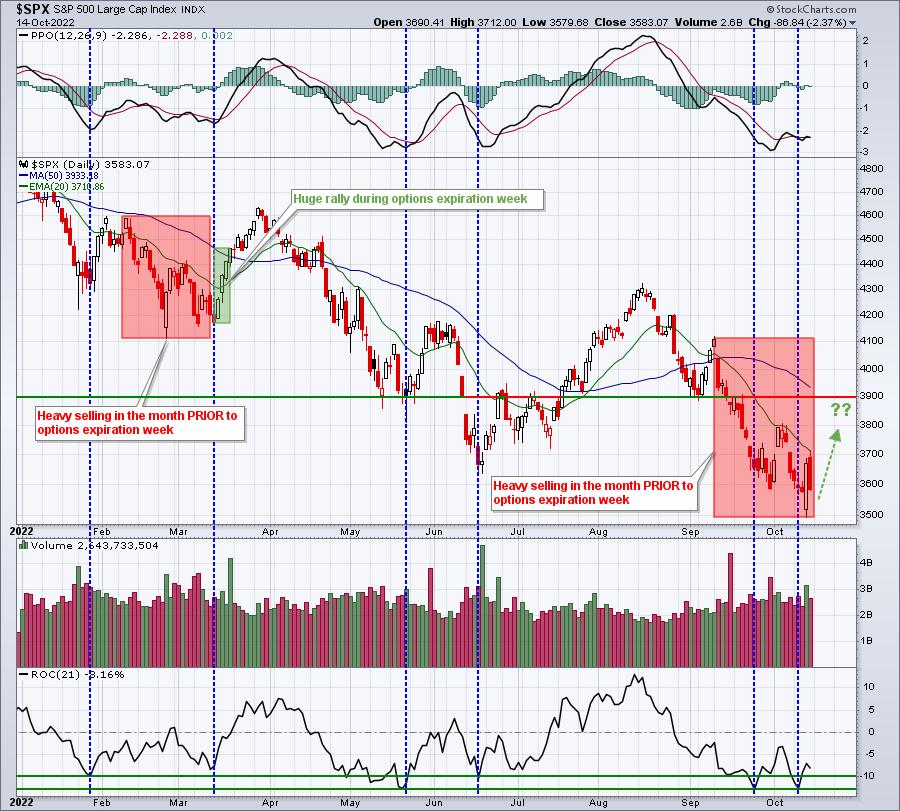
Net Put Premium And Options Expiration Week Suggest A Huge Rally Ahead
by Tom Bowley,
Chief Market Strategist, EarningsBeats.com
I love trading during options expiration week. It's the one time when I have a pretty good idea of which market direction would likely benefit market makers. It doesn't provide us a guarantee, but, in my opinion, does tilt the odds heavily in our favor. I...
READ MORE
MEMBERS ONLY
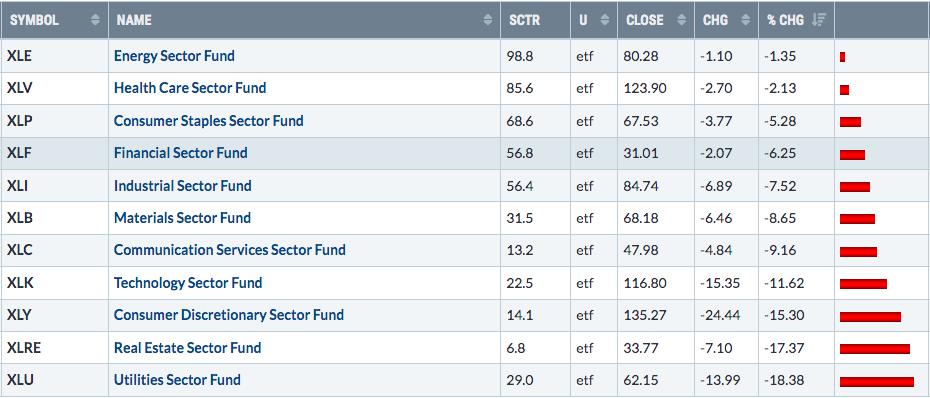
It's Homework Time: Improving Stocks In Improving Industry Groups
by Tom Bowley,
Chief Market Strategist, EarningsBeats.com
By all accounts, it's been a very difficult year. There were plenty of stock market warning shots fired in December 2021 and we're now paying seeing the carnage. While the current environment is dangerous, it's no time to rest on our laurels. There'...
READ MORE
MEMBERS ONLY
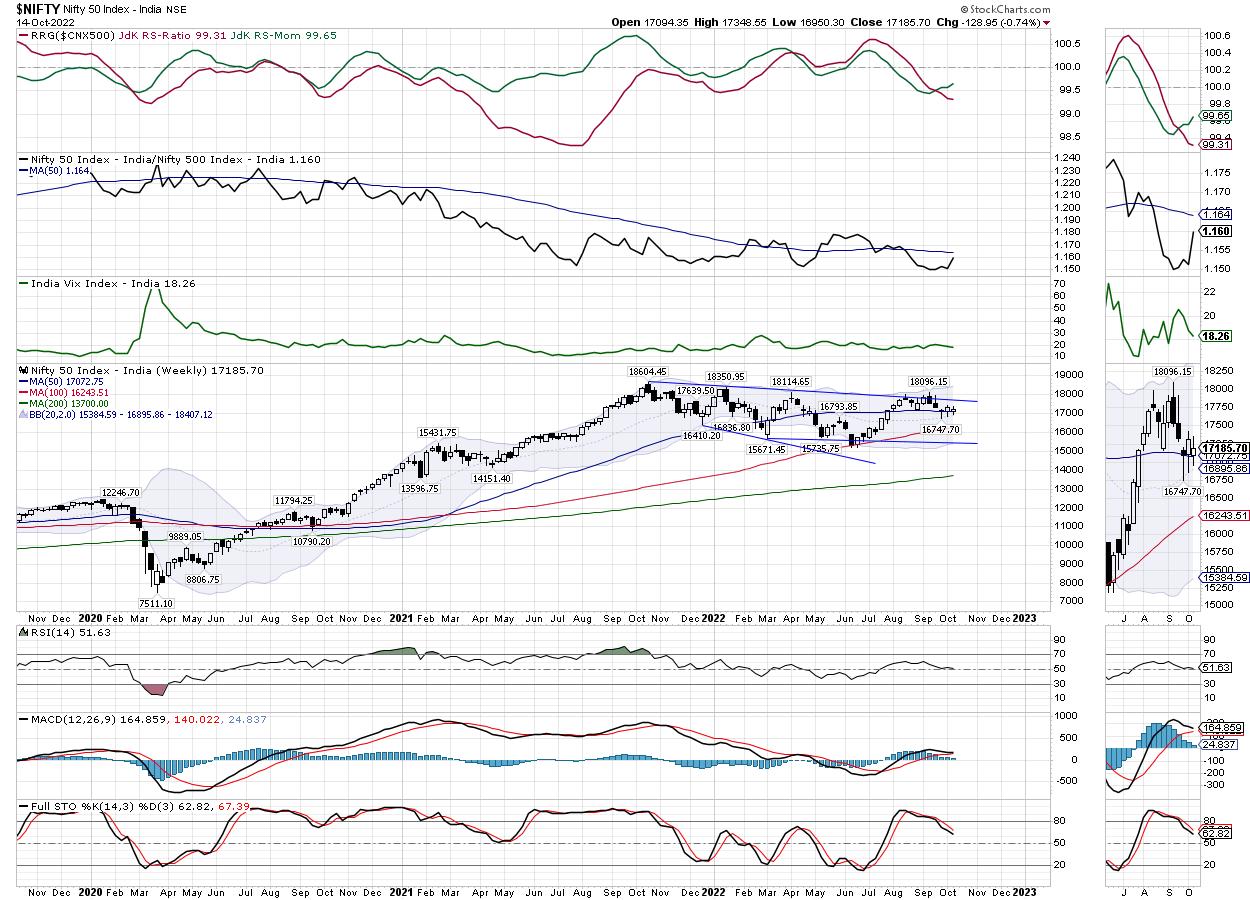
Week Ahead: Stability In Global Equity Markets A Must For A Technical Pullback; NIFTY Continues To Defend Key Support Levels

by Milan Vaishnav,
Founder and Technical Analyst, EquityResearch.asia and ChartWizard.ae
Despite the scale of volatility represented by gaps over the previous days, the NIFTY has by and large maintained its crucial support levels on the weekly charts. The previous technical note mentioned how the Index has created and maintained its crucial support; it managed to keep its head above these...
READ MORE
MEMBERS ONLY

Weekend Daily: Precarious Action in the Bonds and Stock Market
It was a wild ride on Wall Street this week, with stocks swinging wildly in both directions before closing overall a little lower for the week. The CPI data indicates inflation is entrenched in the economy, squeezing household real income, and is a significant concern for businesses.
This year also...
READ MORE
MEMBERS ONLY
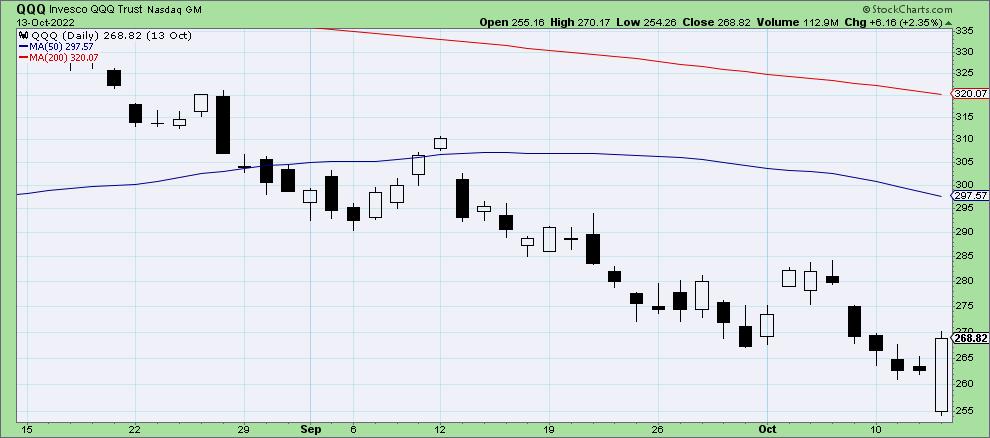
What a Difference a Day Makes

by David Keller,
President and Chief Strategist, Sierra Alpha Research
On Thursday, the S&P 500 index opened around 3500, which is a fairly significant level. That price point represents a 50% retracement of the 2020-2022 bull market phase.
Was I surprised to see a bounce off the 50% retracement level? Absolutely not. As Katie Stockton shared on...
READ MORE
MEMBERS ONLY

MEM TV: How Much Lower Can the Markets Go?

by Mary Ellen McGonagle,
President, MEM Investment Research
In this episode of StockCharts TV'sThe MEM Edge, Mary Ellen shares the next area of possible support for the markets. She also reviews what's driving these markets lower and what we'll need to see to stem the losses. Lastly, she highlights areas of strength...
READ MORE
MEMBERS ONLY

STOCKS ENDING WEEK ON THE DOWNSIDE -- 10-YEAR TREASURY YIELD TRADES ABOVE 4% -- THAT'S HURTING HOMEBUILDERS

by John Murphy,
Chief Technical Analyst, StockCharts.com
NO UPSIDE FOLLOW-THROUGH...Stocks are being sold again on Friday following Thursday's impressive upside reversal. The daily bars in Chart 1 show the S&P 500 reversing upward on Thursday after falling to another bear market low. And it did so on heavy volume. The fact...
READ MORE
MEMBERS ONLY
Sell the Rumor, Buy the News

by TG Watkins,
Director of Stocks, Simpler Trading
On this week's edition of Moxie Indicator Minutes, TG explains that, while the market did gap down on the hot CPI number, that gap sparked a strong short squeeze all day on 10/13/22. That's all well and good, but can it sustain? Was it...
READ MORE
MEMBERS ONLY
Strong Sector Rotation To Financials, But Will It Be Enough to Turn the Market Back Up?
by Julius de Kempenaer,
Senior Technical Analyst, StockCharts.com
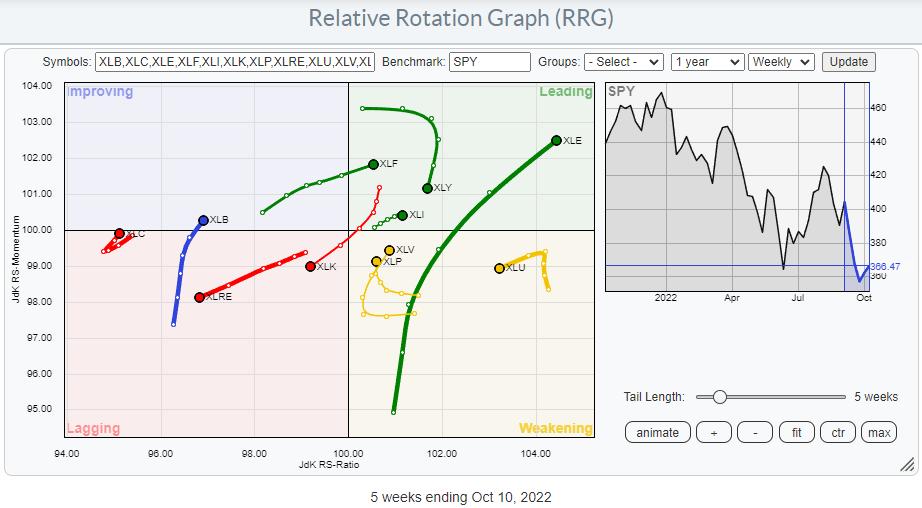
On the weekly Relative Rotation Graph, the tail for XLF has just crossed over into the leading quadrant while keeping up its rising relative momentum. This makes the financials sector one of the leading sectors in the market at the moment.
In the past week, XLF picked up 2.62%...
READ MORE
MEMBERS ONLY

Giant Outside Days Spook the Bears
by Martin Pring,
President, Pring Research
Thursday's price action began bearishly with the probing of recent bear market lows. By the end of the session, the DJIA, along with several other markets, totally encompassed Tuesday's trading range and then some, in a one-day pattern known as an "outside day"...
READ MORE
MEMBERS ONLY
GNG TV: Rally Provides No Relief as "NoGo" Returns
by Alex Cole,
Co-founder, GoNoGo Charts®
by Tyler Wood,
Co-founder, GoNoGo Charts®
In a highly volatile morning, markets reacted to an upside surprise in both PPI and CPI inflation data. Annualized inflation remains at 8.2% in the US and the S&P 500 gapped lower at the open. Despite a magnificent rally back into positive territory by midday, the trend...
READ MORE
MEMBERS ONLY
How to Learn Indicators
by Joe Rabil,
President, Rabil Stock Research
On this week's edition of Stock Talk with Joe Rabil, explains how he learned the indicators he employs. He discusses how the indicators should be learned independent of one another and how they can then form a weight of the evidence. He then covers the stock requests that...
READ MORE
MEMBERS ONLY
2022 Q2 Final: Earnings Have Peaked
by Carl Swenlin,
President and Founder, DecisionPoint.com
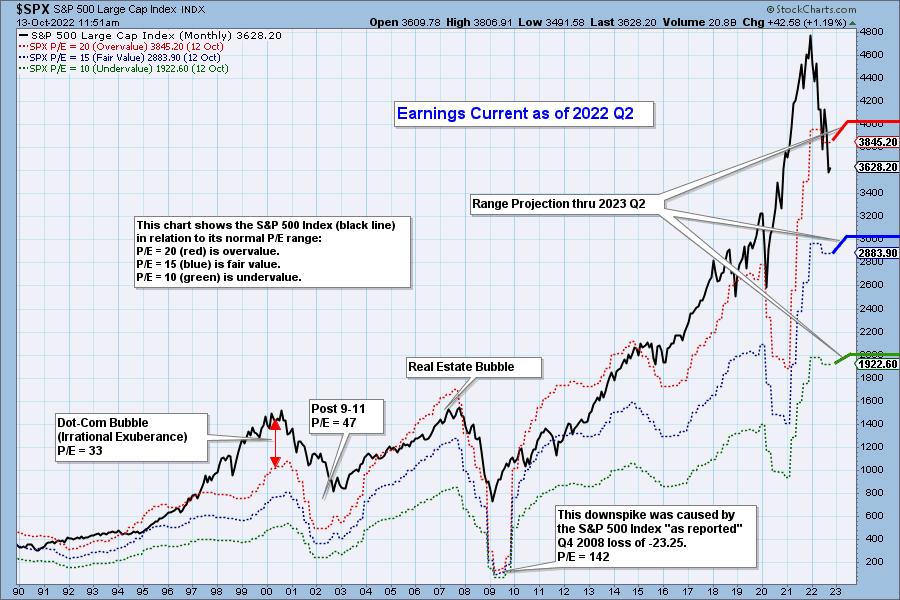
The following chart shows us the normal value range of the S&P 500 Index, indicating where the S&P 500 would have to be in order to have an overvalued P/E of 20 (red line), a fairly valued P/E of 15 (blue line), or an...
READ MORE
MEMBERS ONLY
PepsiCo Inc. (PEP) Starts Earnings Season With a Bang
by Mary Ellen McGonagle,
President, MEM Investment Research
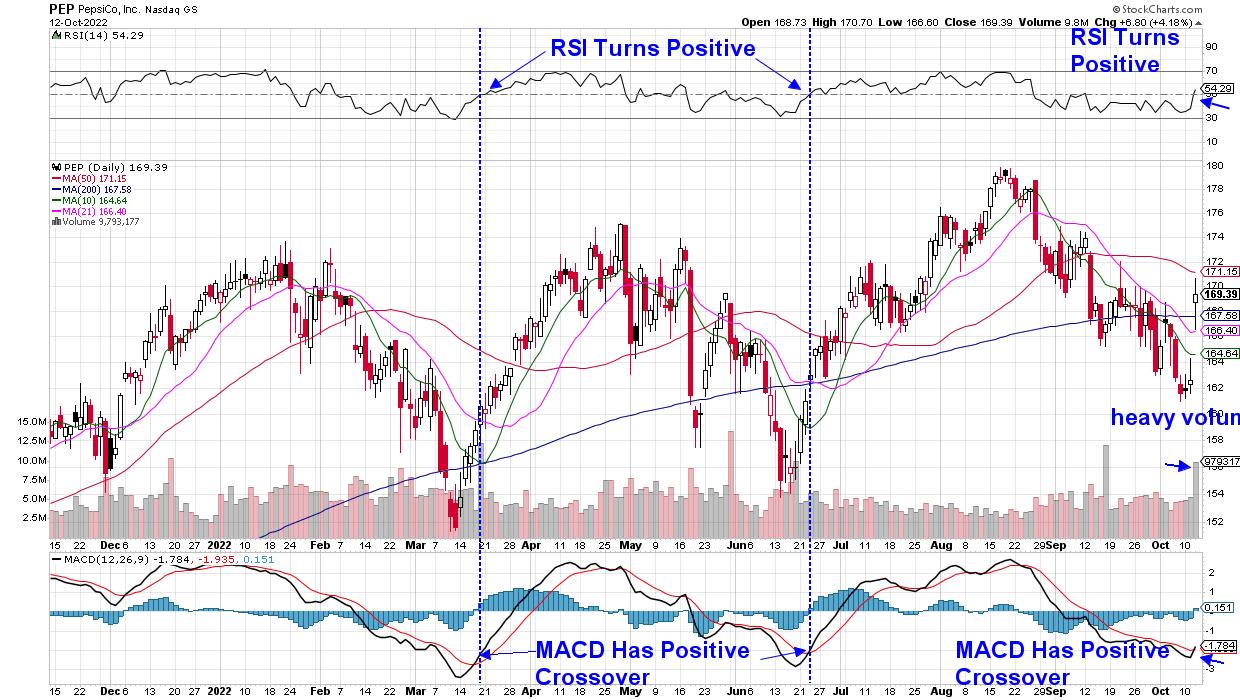
Earnings season for the 3rd quarter has begun, with PepsiCo (PEP) reporting earnings and sales results today that were above estimates, despite recognizing a $1.4B charge related to its withdrawal from Russian markets.
Even more important for investors is the fact that management raised their guidance for organic revenue...
READ MORE
MEMBERS ONLY
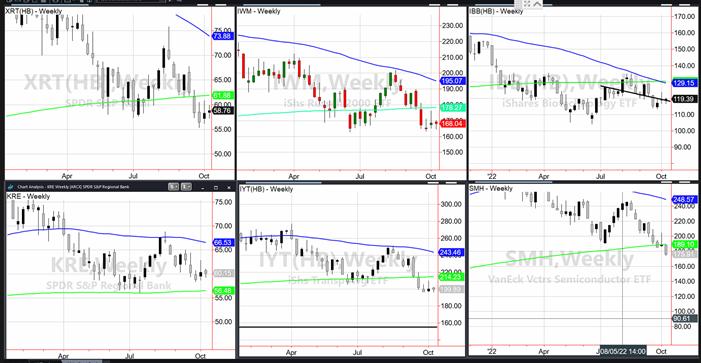
Mish's Daily: Taking the Temperature of the Economic Modern Family
One of the most important first steps towards trading success is to tilt your trading towards trending sectors that display strength and avoid market weakness. A very helpful tool for understanding the underlying forces driving trends is Mish's Modern Economic Family, a simplified economic market model. The Family...
READ MORE
MEMBERS ONLY

Up, Up & Away!

by Larry Williams,
Veteran Investor and Author
In this exclusive StockCharts TV special, Larry talks about how inflation has been the driving force in the markets. Where are we now, and what is about to happen? Larry uses the Cycle Theory, Crude Oil, P/E, the Presidential Cycle and more to determine where the markets are likely...
READ MORE
MEMBERS ONLY
Better Manage Your Expectations
by Dave Landry,
Founder, Sentive Trading, LLC
On this week's edition of Trading Simplified, Dave continues to show his methodology in action with a new mystery chart. In his "Mind the Trade" segment, Dave discusses why you must manage your expectations when trading. He then continued his discussion on "your mind on...
READ MORE
MEMBERS ONLY
Past Performance is no Guarantee of Future Results

by Greg Morris,
Veteran Technical Analyst, Investor, and Author
There is no doubt that investors are attracted by positive performance. Unfortunately, most investors stop there and never accomplish the due diligence to confirm that the returns are meaningful. In most cases they usually place entirely too much emphasis on performance without putting it into the context of the market...
READ MORE
MEMBERS ONLY
Mish's Daily: Analyzing Two Stocks in the Grocery Space
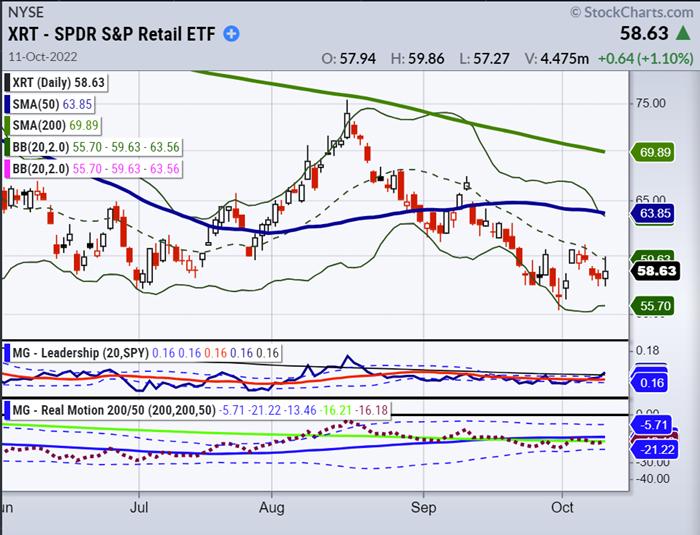
With the potential of a full recession looming in the coming quarters, investors are looking for defensive plays, such as dividend-paying stocks and businesses more resilient in economic downturns.
Looking at Tuesday's market close, XRT, a.k.a. Granny Retail, was up 1.1%, along with Costco...
READ MORE
MEMBERS ONLY
Mish's Daily: The Convergence of Market Headwinds and Mid-Term Elections
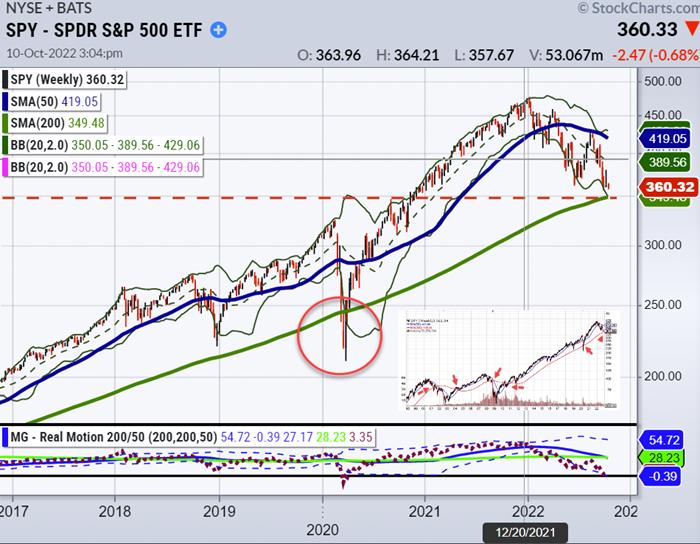
The S&P 500, represented by the SPY, has generally stayed above the 200-week moving average long-term. It is a good line in the sand to use as a guide for potential market crashes. Bear market declines are primarily responsible for the few occasions when the SPY...
READ MORE
MEMBERS ONLY
DP Trading Room: What is a Market Climax?
by Erin Swenlin,
Vice President, DecisionPoint.com
by Carl Swenlin,
President and Founder, DecisionPoint.com
On this week's edition of The DecisionPoint Trading Room, Carl goes into detail on how DecisionPoint Climax Analysis works. Climax identification can give you clues into market behavior for the next few days, but it is more than that. Meanwhile, Erin covers sectors and dives into industry groups...
READ MORE
MEMBERS ONLY
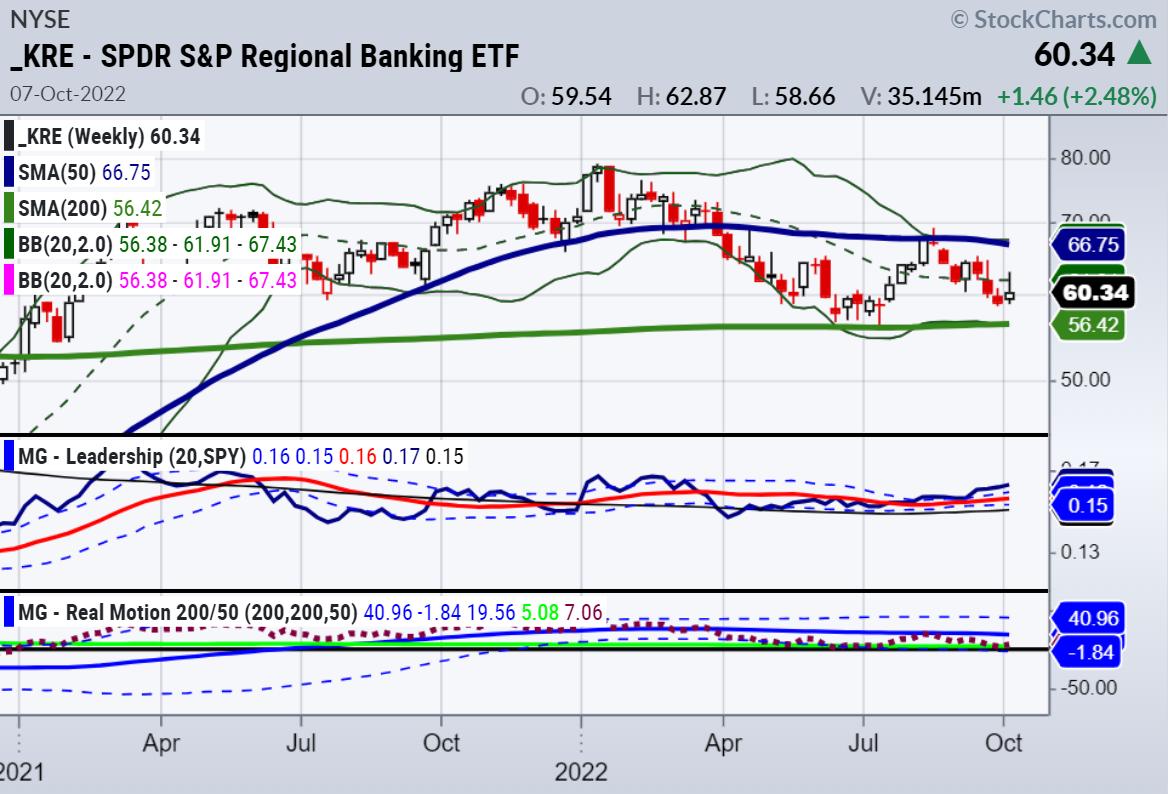
Weekend Daily: Don't Be Afraid of the Fed; The Modern Family Will Guide You
Wall Street sold off dramatically on Friday after the jobs report. While the economy is stagnating, many investors are concerned that the Fed will raise rates too quickly, pushing the U.S. economy into a deep recession.
It is good to stay current on the unemployment rate and Fed policy....
READ MORE
MEMBERS ONLY
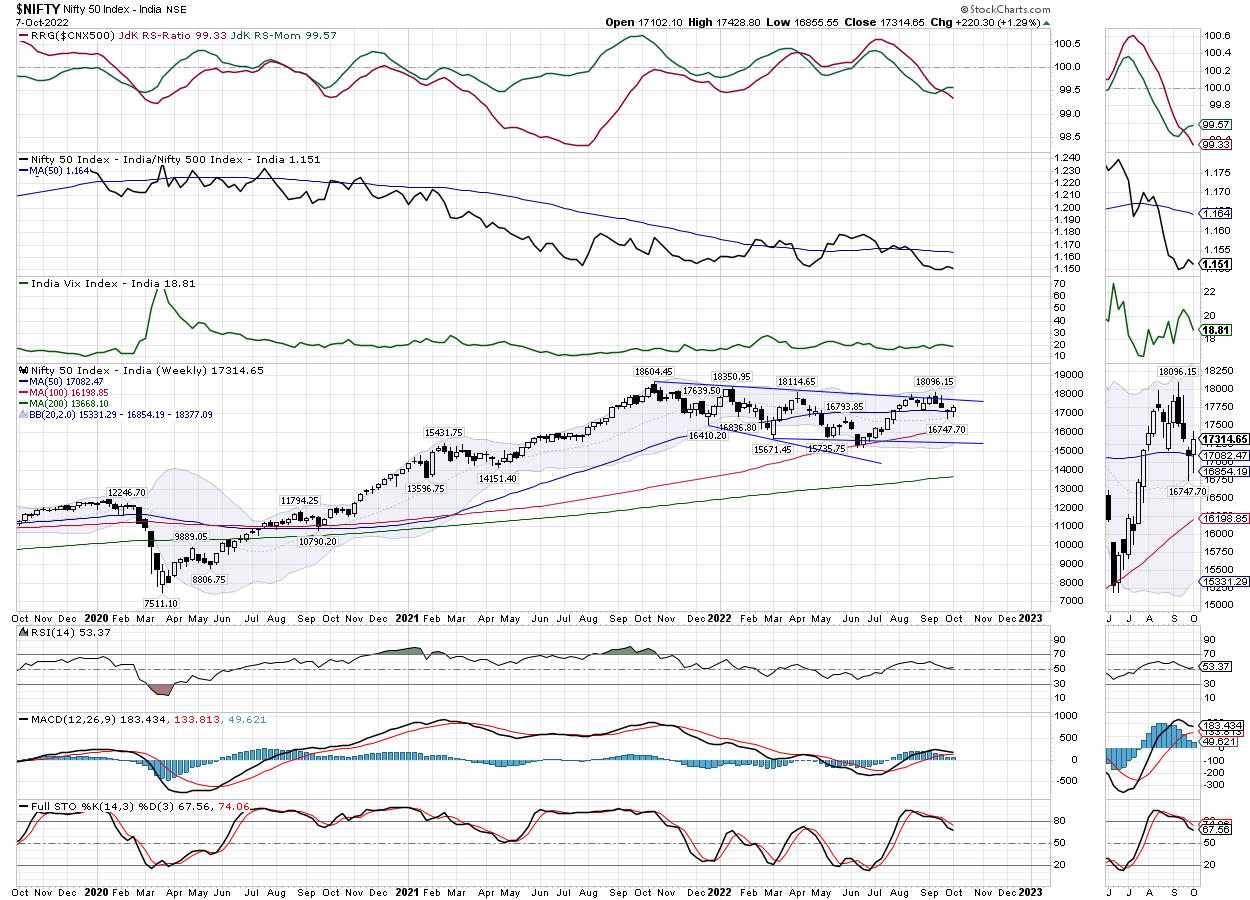
Week Ahead: NIFTY Eyes This Level as the Immediate Target; Staying Above These Two WMAs Crucial
by Milan Vaishnav,
Founder and Technical Analyst, EquityResearch.asia and ChartWizard.ae
In the previous technical note, we mentioned how the Indian equities stayed in a defined range, as they traded within the defined corners while respecting basic technical levels. In the week that has gone by, the NIFTY once again made measured moves, continuing to strongly inherit buoyancy from the US...
READ MORE
MEMBERS ONLY

The Pickings are Slim, but one Metal Stands Out
by Arthur Hill,
Chief Technical Strategist, TrendInvestorPro.com
The pickings are extremely thin in the markets because the vast majority of groups are in downtrends. TrendInvestorPro tracks trend signals in 274 ETFs. This list include 170 stock-based ETFs, 18 fixed income ETFs, 17 commodity ETFs, 9 currency ETFs and 60 non-US ETFs. Only 14 (5.1%...
READ MORE
MEMBERS ONLY

STOCKS SELL OFF ON JOBS REPORT -- RISING RATES AND OIL ARE ALSO WEIGHING ON STOCKS
by John Murphy,
Chief Technical Analyst, StockCharts.com
STOCK INDEXES GAP LOWER... Stocks are selling off sharply following this morning's September job report which came in a bit stronger than expected. That may be a case of good economic news being bad for stocks because it keeps the Fed on its path of higher interest rates....
READ MORE
MEMBERS ONLY
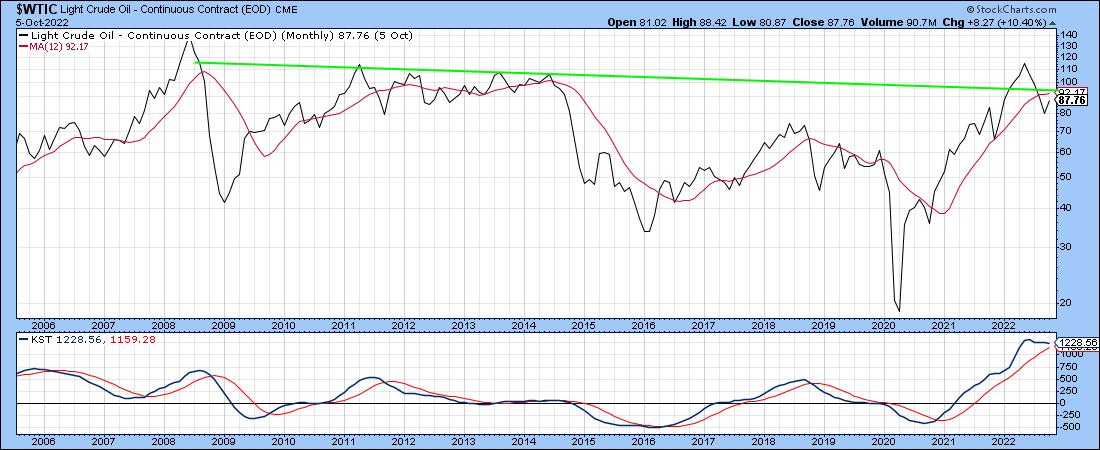
The Oil Price Gets Resuscitated: Is it Enough to Keep the Bull Market Alive?
by Martin Pring,
President, Pring Research
Just when it seemed that oil was peaking, OPEC breathed new life into the commodity this week by threatening a sizeable production cut. That does not change the overextended nature of the longer-term indicators. Nevertheless, it does hint that oil prices and their related stocks may be on the...
READ MORE
MEMBERS ONLY
GNG TV: It's Just a Lower High Until it Isn't!
by Alex Cole,
Co-founder, GoNoGo Charts®
In this week's edition of the GoNoGo Charts show, Alex Cole runs through the markets, discussing the major asset trends and macro drivers that affect equity prices, such as Treasury rates, Oil prices and the dollar. Alex looks at the S&P 500 in some detail to...
READ MORE