MEMBERS ONLY
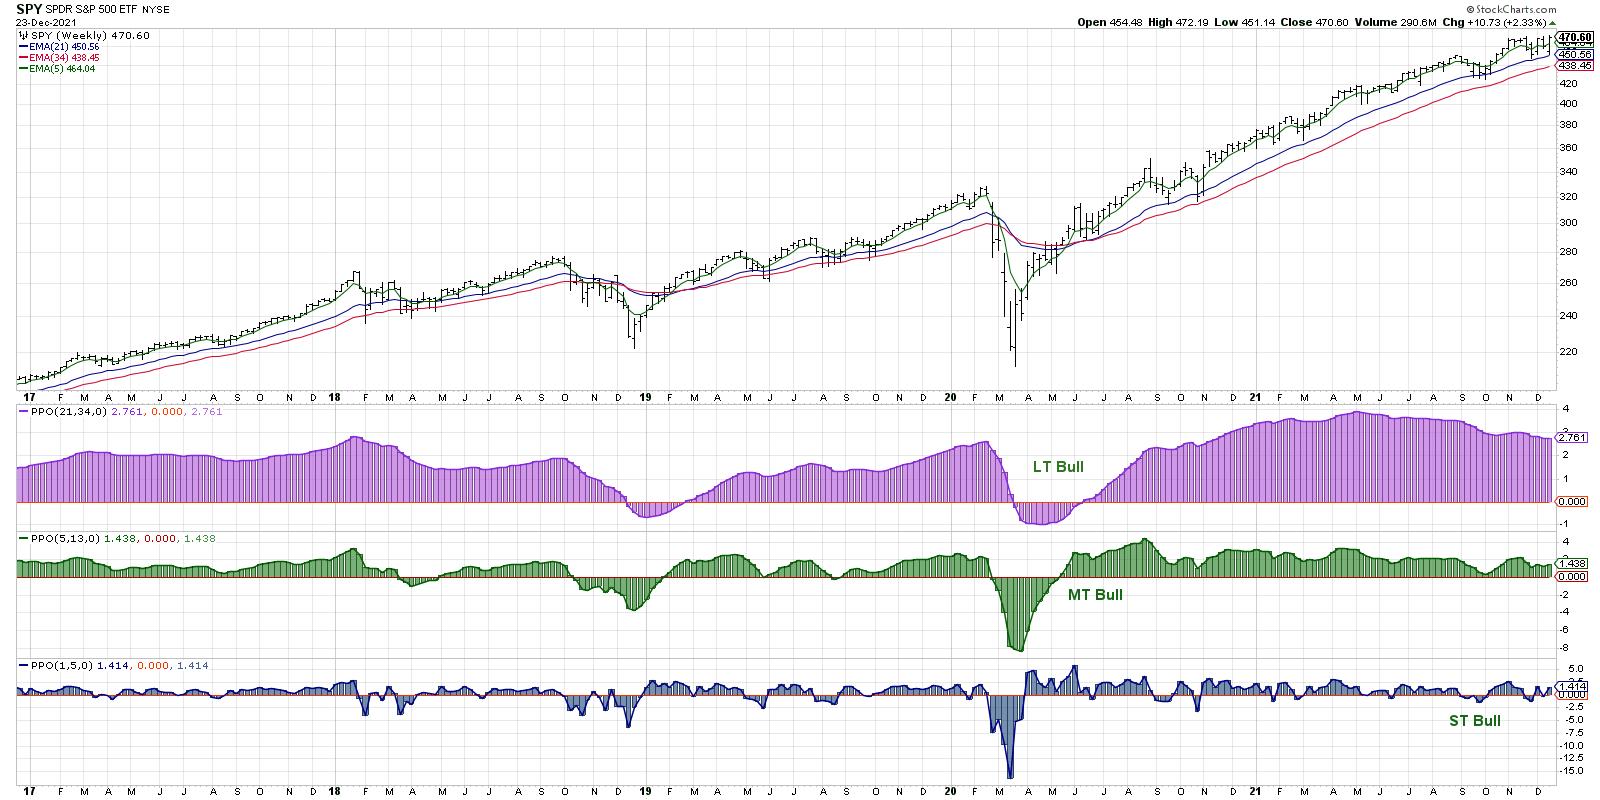
Top Five Charts of 2021

by David Keller,
President and Chief Strategist, Sierra Alpha Research
Try to summarize 2021 in one word.
"Rotational."
"Uncertain."
"Volatile."
Perhaps all of the above?
This year has been all about leadership rotation, with growth names, value stocks and even defensive sectors all spending some time as the strongest performers in a given month....
READ MORE
MEMBERS ONLY
Key Areas to Watch This Weekend and Into the New Year
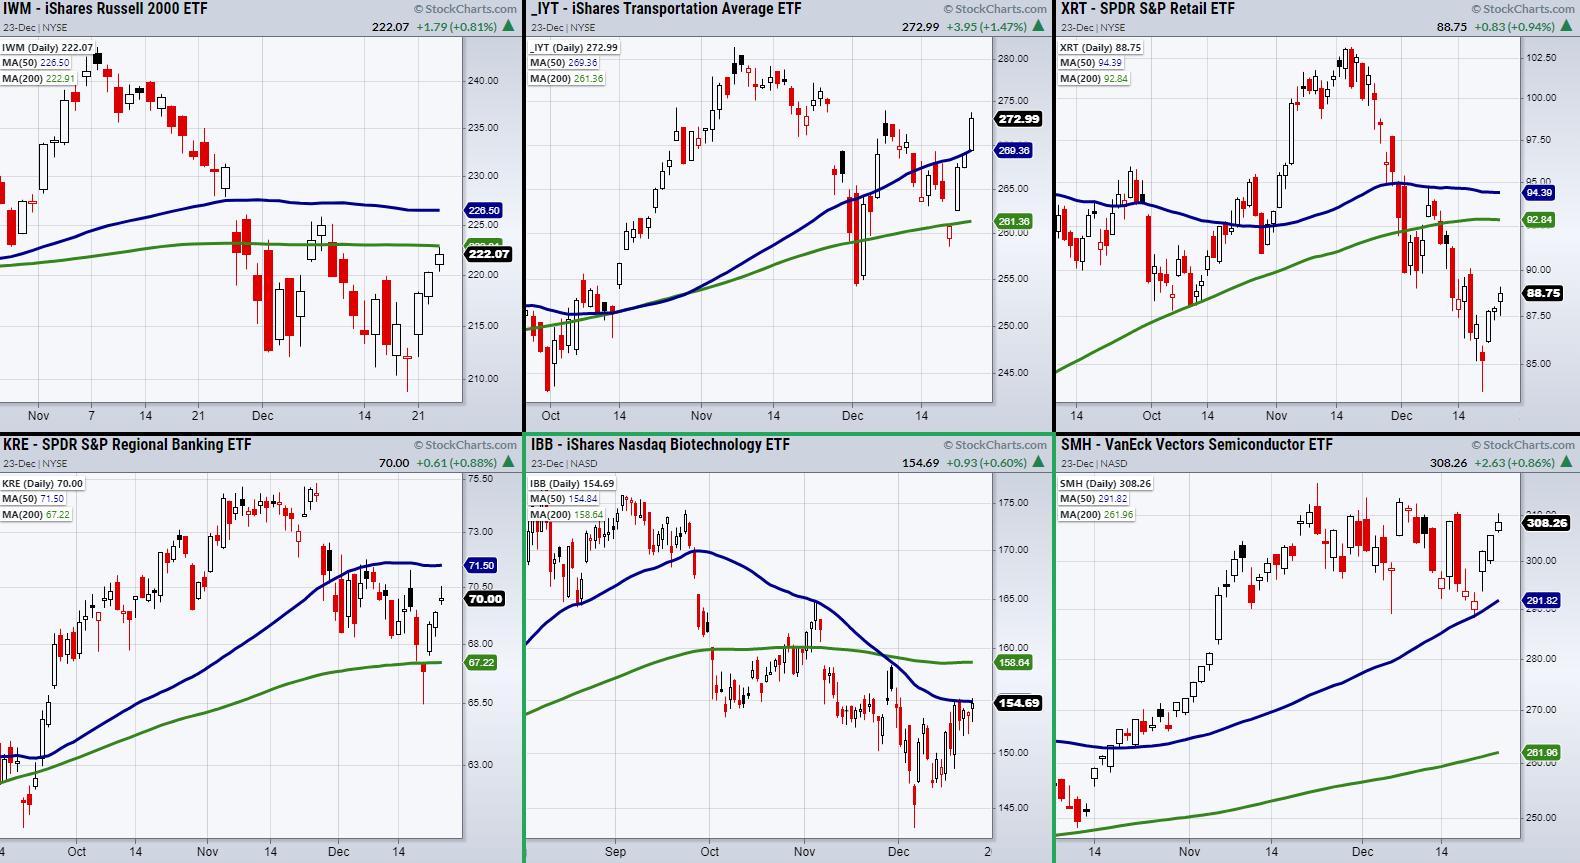
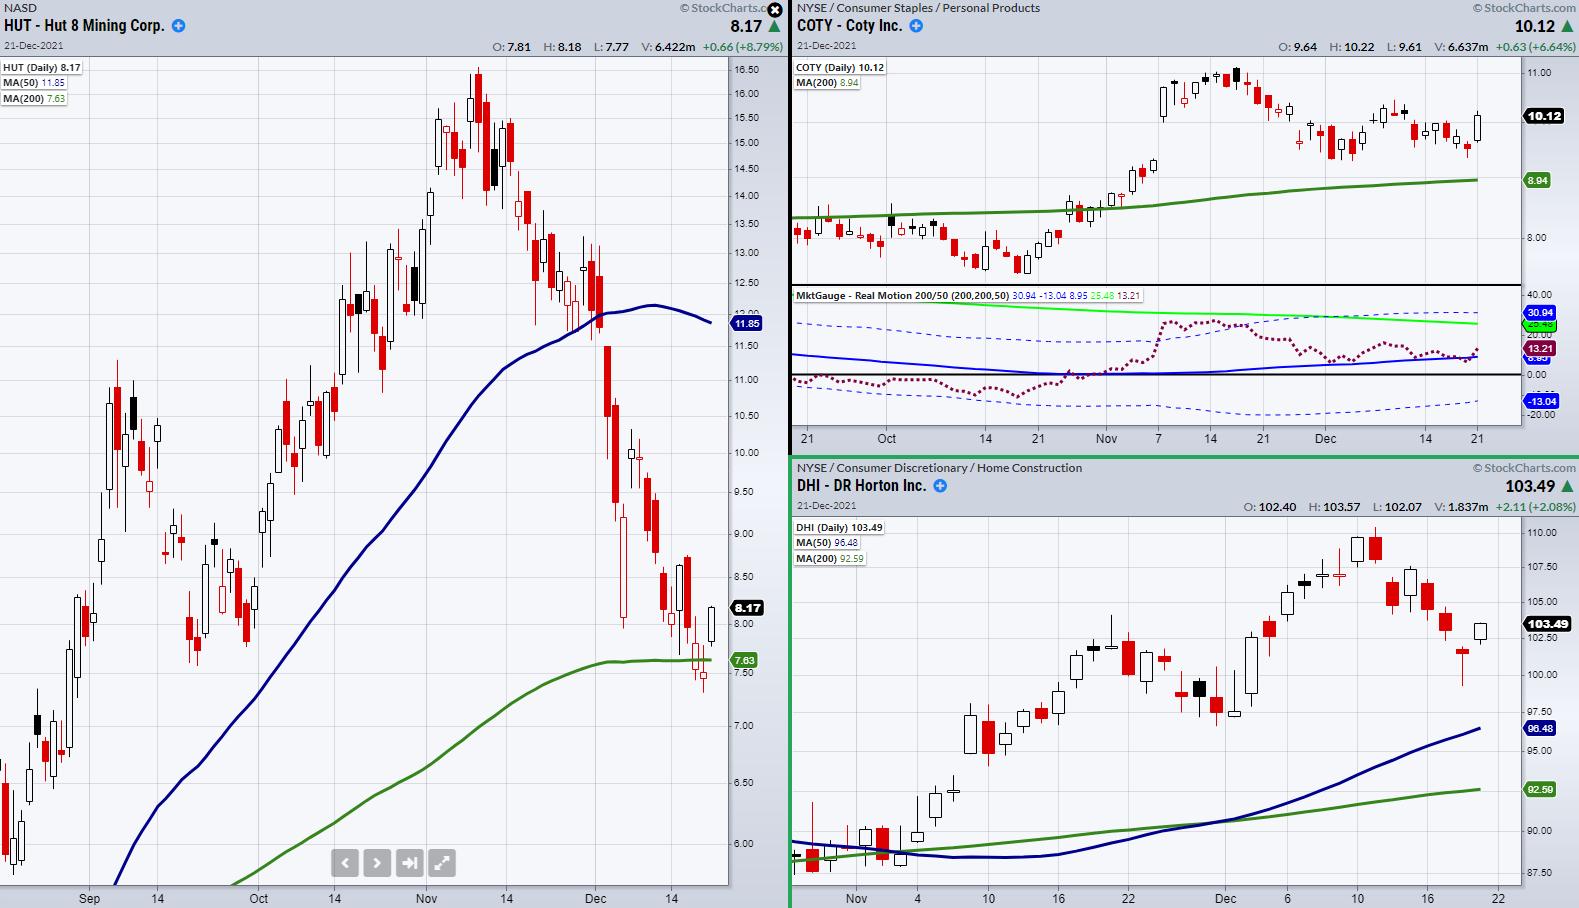
With the holiday weekend upon us, let's take a quick review of Mish's Economic Modern Family for new trends and ideas as we head into the new year.
The Family consists of 7 symbols that show a complete view of the overall market.
To start with,...
READ MORE
MEMBERS ONLY
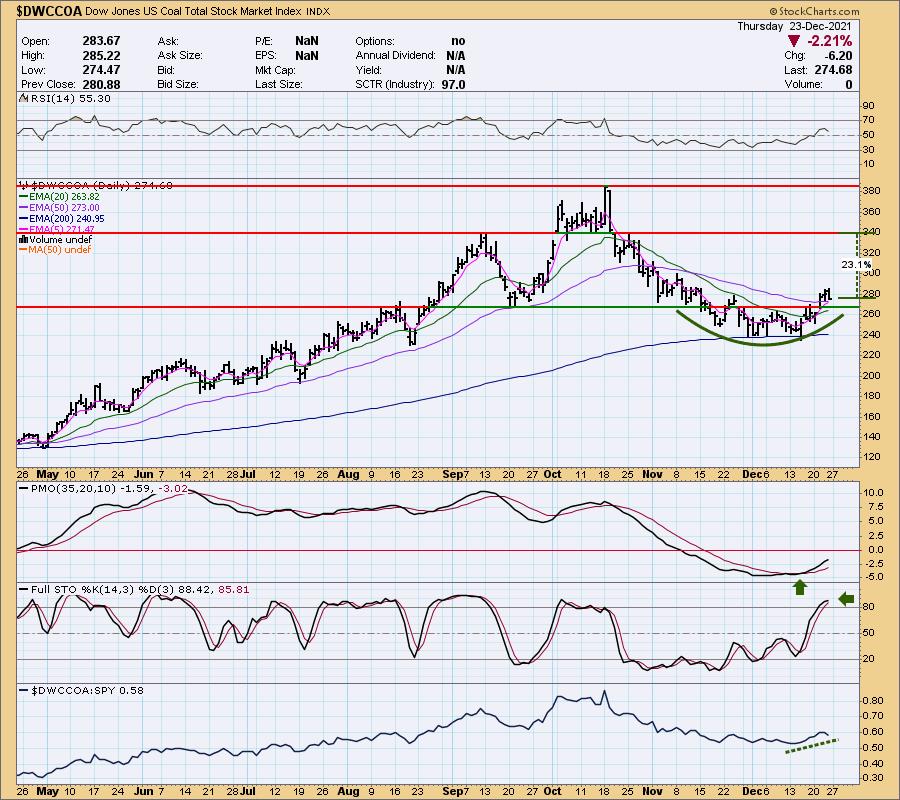
These Two Industry Groups Offer Excellent Opportunities

by Erin Swenlin,
Vice President, DecisionPoint.com
This week in the subscriber-only DecisionPoint Diamond Mine trading room Thursday morning, I found two industry groups to watch. Interestingly, one of those groups I had brought to the table last Friday for my DP Diamonds subscribers and, on Monday, I brought it to the attention of the DP Alert...
READ MORE
MEMBERS ONLY

STOCKS ENDING TRADING WEEK ON A STRONG NOTE -- S&P 500 NEARS OLD HIGH -- SEASONAL TREND REMAINS POSITIVE -- BUT MARKET BREADTH LAGS BEHIND

by John Murphy,
Chief Technical Analyst, StockCharts.com
STOCK INDEXES GAIN GROUND... Stocks are ending the trading week on a strong note as shown in the three charts below. The most notable one belongs to the S&P 500 in Chart 2 which is nearing a test of its old high. Ten of eleven stock sectors are...
READ MORE
MEMBERS ONLY
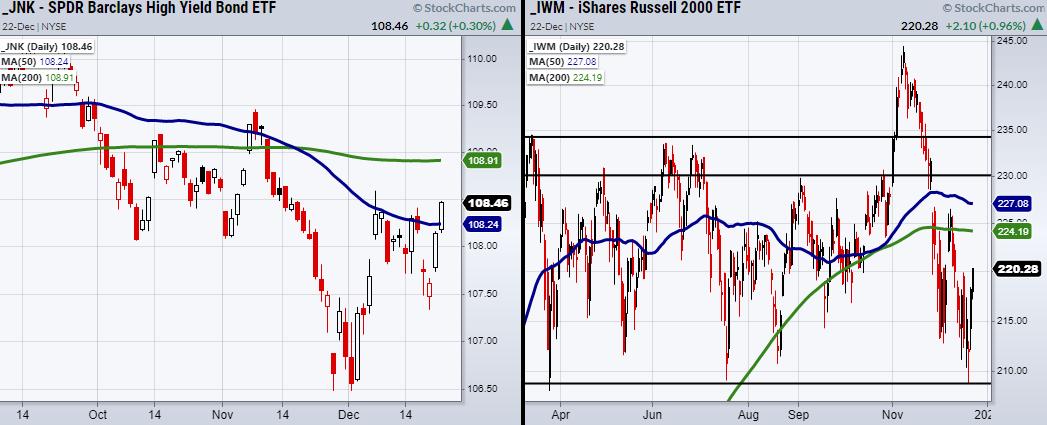
Is Everyone Loading Up on Trades Before Christmas?
High-yield corporate bonds ETF (JNK) cleared its 50-day moving average at $108.24, but sits in a pivotal resistance zone. Along with JNK, the major indices are sitting near overhead resistance from recent highs or, in the case of the Russell 2000 (IWM), the middle of the trading range. At...
READ MORE
MEMBERS ONLY

Two Intermarket Relationships Worth Monitoring for Early 2022

by Martin Pring,
President, Pring Research
Last week, I pointed out three charts that had triggered bullish signals and suggested that these characteristics were strong enough to power the market higher. Prices immediately sold off, but have subsequently rebounded. Since those charts are still positive, I am sticking to the higher market over the next 2-4...
READ MORE
MEMBERS ONLY

Providers and Pharmaceuticals Looking Strong Inside Healthcare

by Julius de Kempenaer,
Senior Technical Analyst, StockCharts.com
My longer-term outlook for the general market is still based on a continuing uptrend. However, over the last few weeks, defensive sectors picked up on the Relative Rotation Graph against the S&P 500.
Of these three sectors, Healthcare (XLV) is the biggest in terms of market capitalization at...
READ MORE
MEMBERS ONLY
Is the Santa Claus Rally Finally Here?
As the year nears its end, we have a lot of ideas to keep watch of.
Tuesday's price action could be the late Santa rally people were hoping for. Though it's better late than never, we should watch for the major indices to hold up through...
READ MORE
MEMBERS ONLY
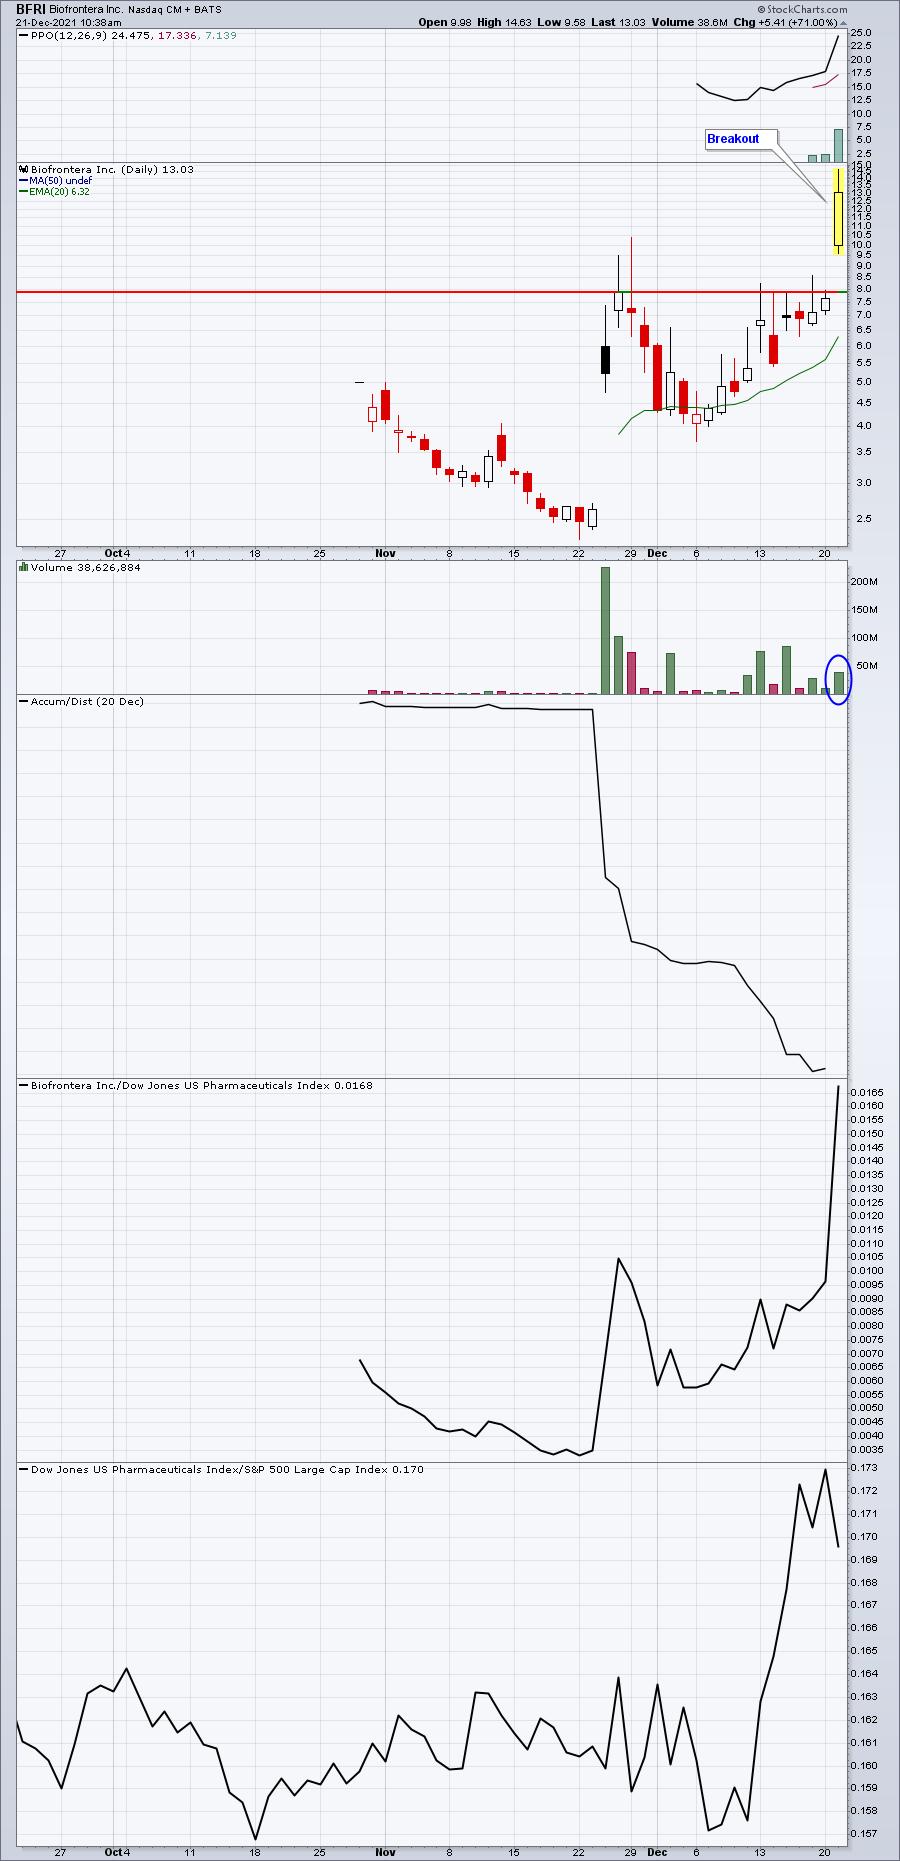
Is This Pharma The Next GameStop (GME) Short Squeeze?

by Tom Bowley,
Chief Market Strategist, EarningsBeats.com
It's been quite a volatile ride today, but one pharmaceutical stock has made 5 years' worth of returns in a couple hours. It's what happens when there's a huge imbalance in demand vs. supply on a stock and it breaks out to new...
READ MORE
MEMBERS ONLY

DP TV: Determining Biases in Indexes, Stocks and ETFs
by Erin Swenlin,
Vice President, DecisionPoint.com
On this special episode of DecisionPoint, Erin explains how you can determine the "bias" of an index, as well as a stock or ETF. Using moving averages, participation and the Golden/Silver Cross Index for sectors and the broad market, you can determine whether the market, a sector...
READ MORE
MEMBERS ONLY
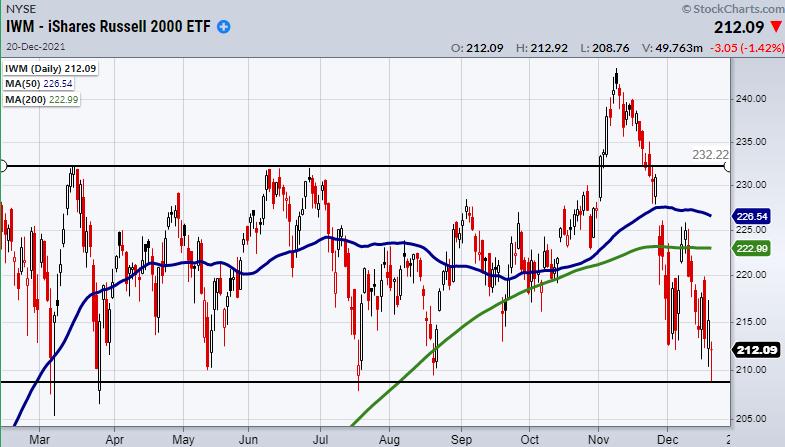
Is it Time to Start Range Trading?
Currently, the major indices are trading near the lows of December or, in the case of IWM, near the bottom of its trading range, around $208.
With 2021 wrapping up, there is still a lot of uncertainty in the market. The past month has been tough from a trading standpoint,...
READ MORE
MEMBERS ONLY
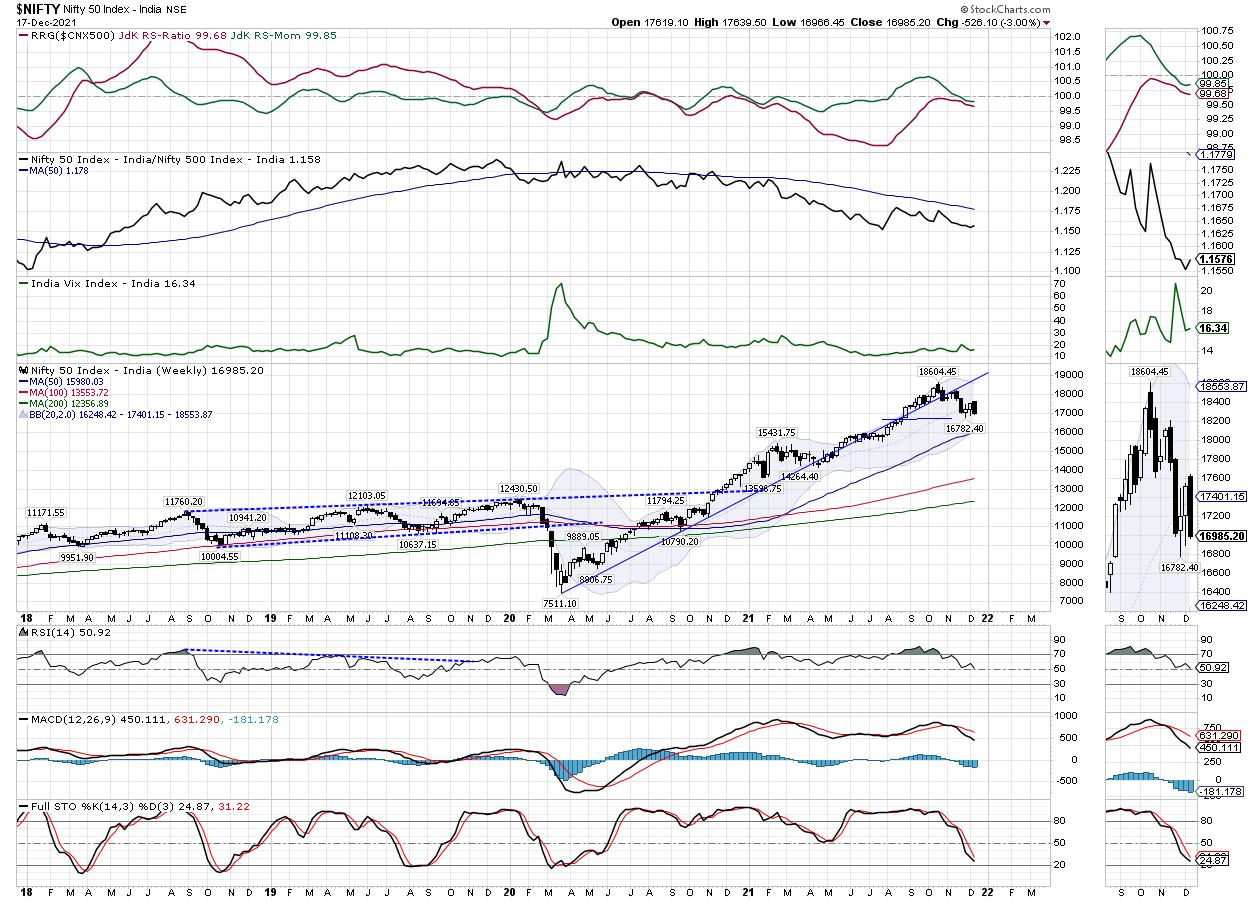
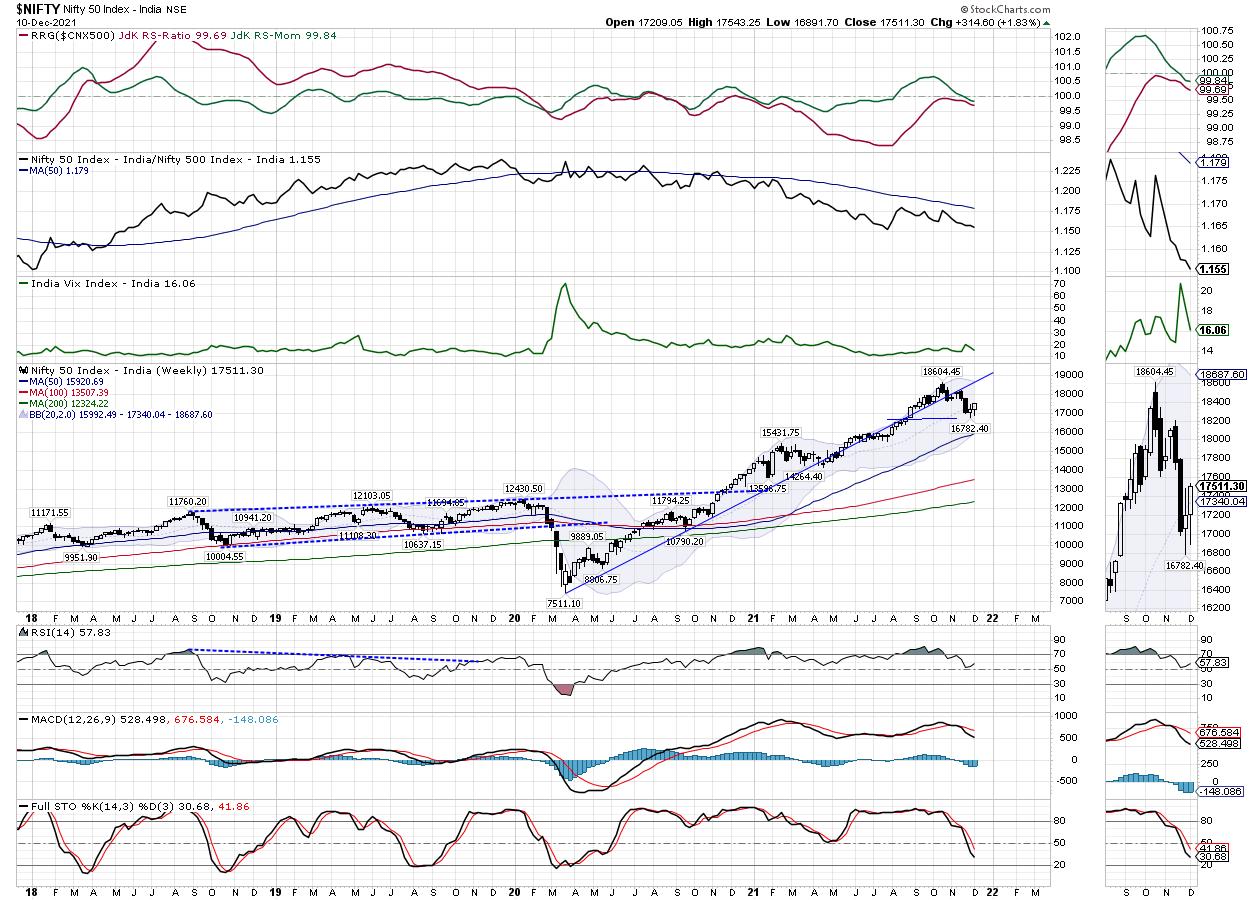
Week Ahead: Crucial Days Ahead for NIFTY; RRG Chart Shows This Sector Ending Relative Underperformance

by Milan Vaishnav,
Founder and Technical Analyst, EquityResearch.asia and ChartWizard.ae
In predominantly weak trading days over the entire past week, the Indian equity markets not only violated a few important levels, but also grossly underperformed the global markets. All of the last five trading days remained weak as the NIFTY failed to move past the 17500 level. After a failed...
READ MORE
MEMBERS ONLY
In Search of Some Inflation Protection? Check Out These Considerations

by Mary Ellen McGonagle,
President, MEM Investment Research
Last week, the Federal Reserve announced plans to shift to a tighter monetary policy to allow for interest rate hikes sooner than expected. The move is in an effort to keep inflation from spiraling out of control and was in response to reports of a surge in inflation. November'...
READ MORE
MEMBERS ONLY
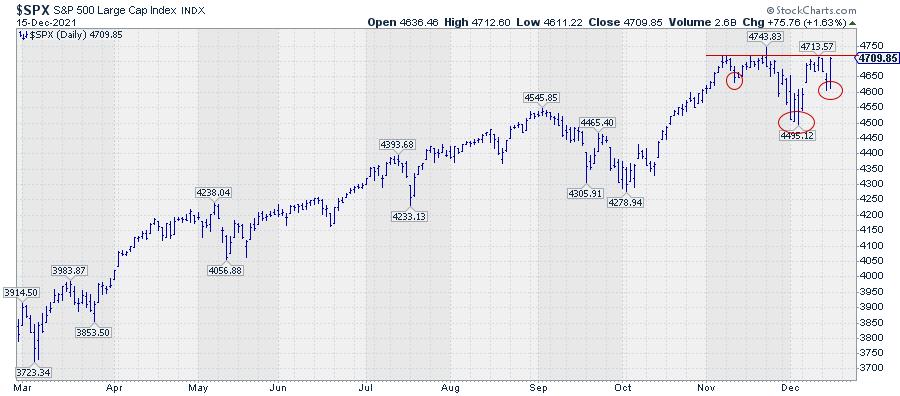
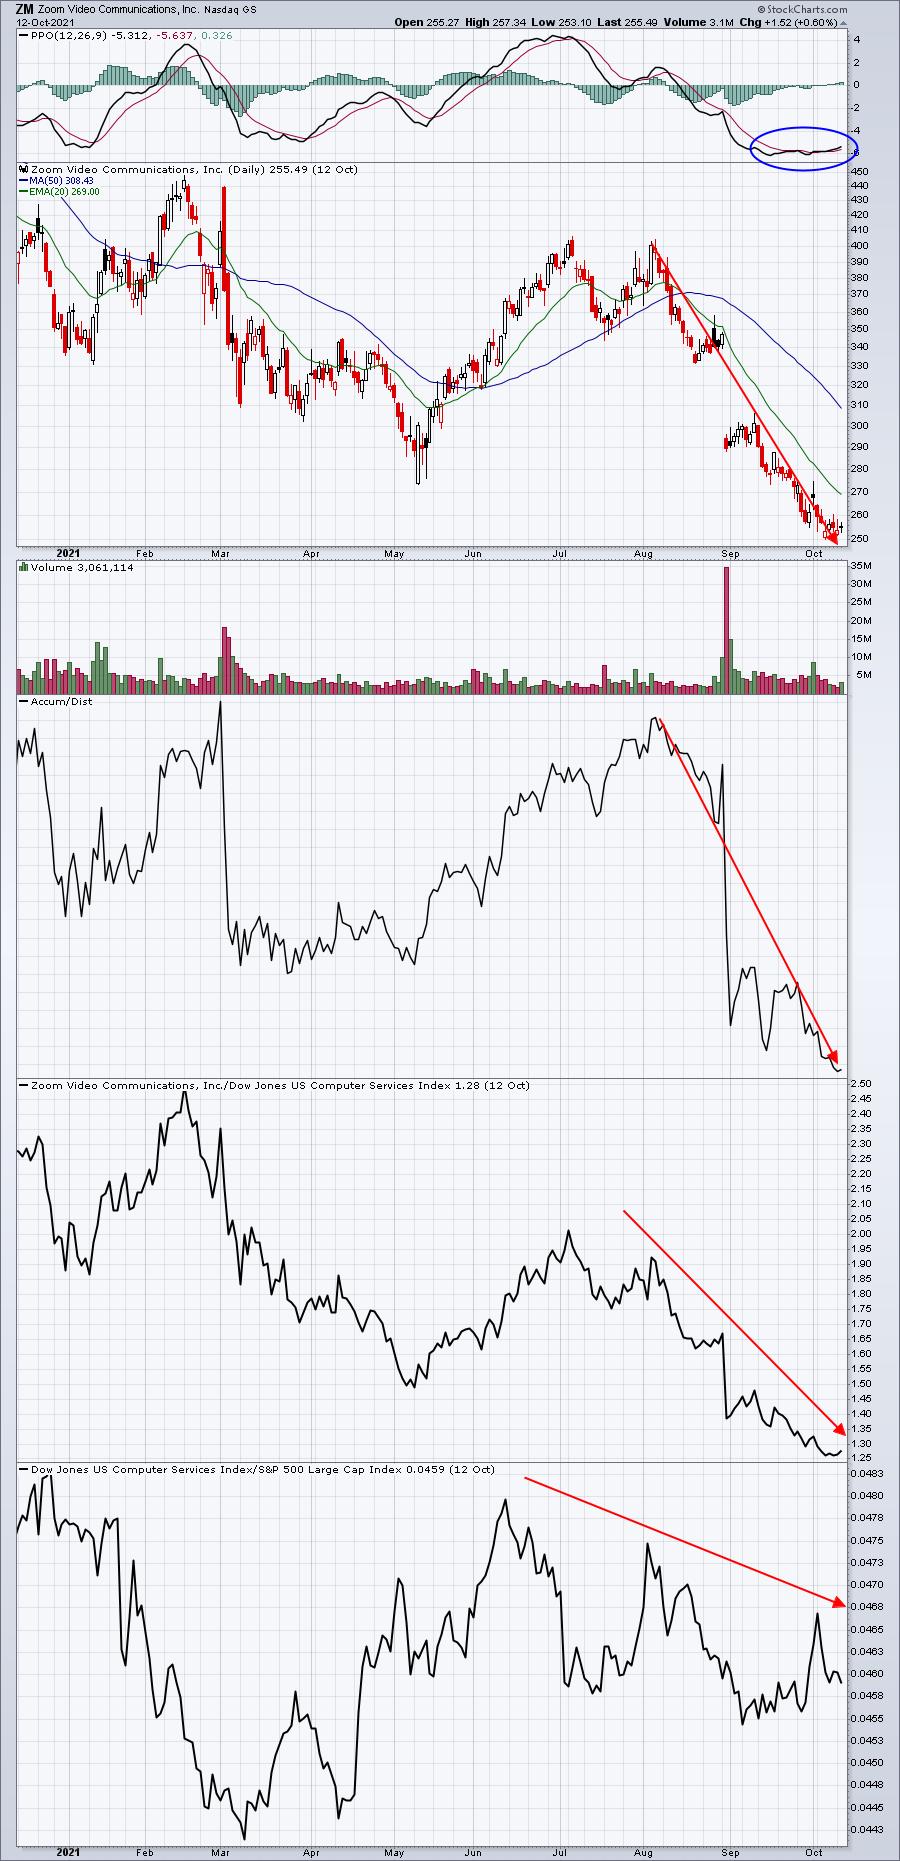
Bearish Divergence Continues for S&P 500
by David Keller,
President and Chief Strategist, Sierra Alpha Research
Something changed on November 5, 2021.
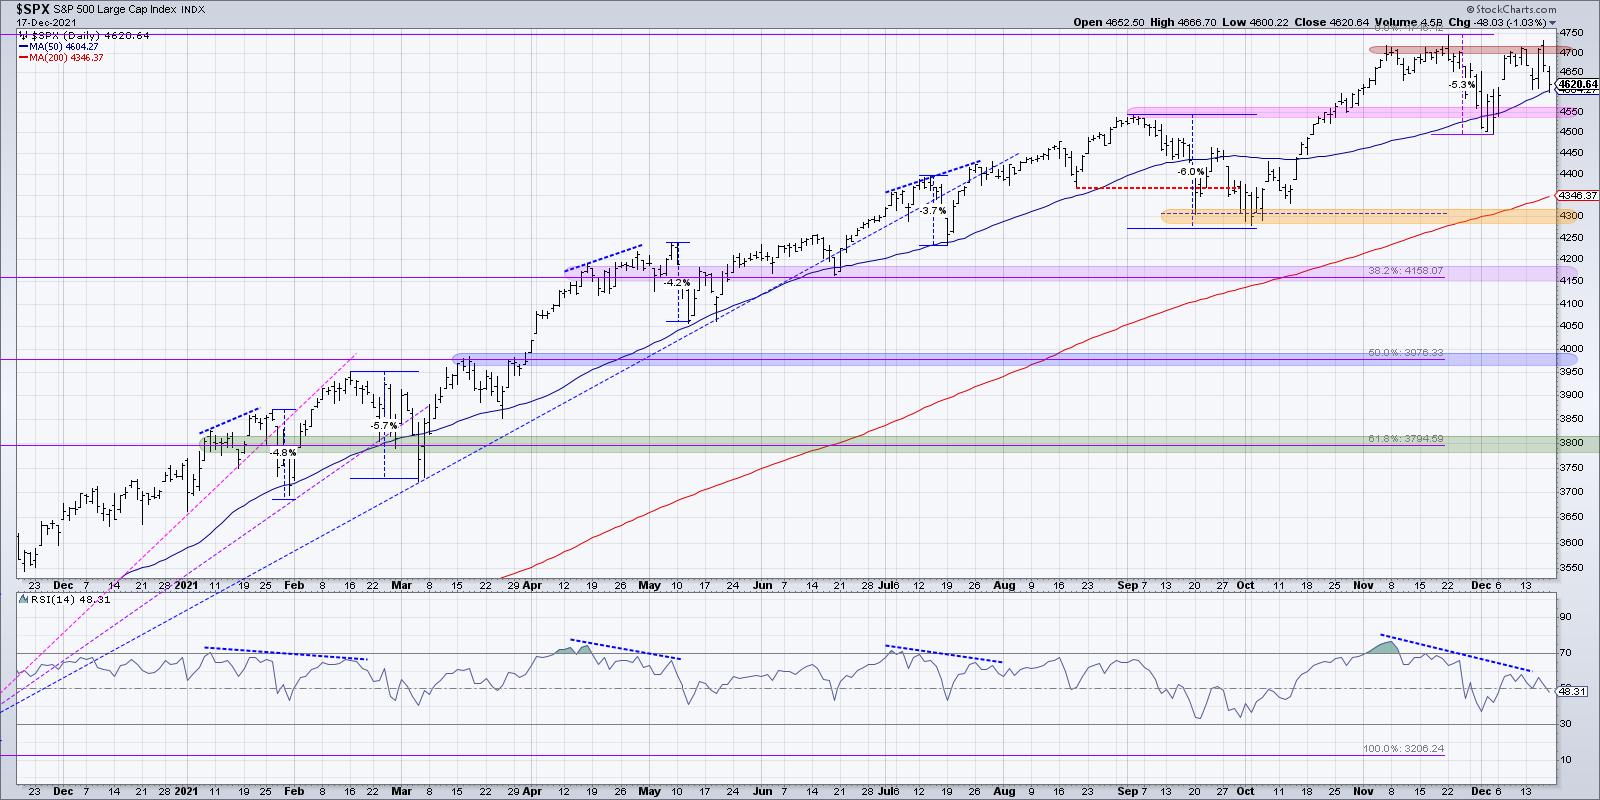
The S&P 500 had successfully broken up through the previous resistance level around 4550; early November saw the benchmark continue higher to finally reach 2700 on November 5th. Until that first Friday in November, the S&P 500 appeared to be...
READ MORE
MEMBERS ONLY

Markets Close Down, But These Areas are Up!
by Mary Ellen McGonagle,
President, MEM Investment Research
On this episode of StockCharts TV'sThe MEM Edge, Mary Ellen reviews where the relative strength is in the markets and shares individual stocks that are expected to remain strong into next year.
This video was originally recorded on December 17, 2021. Click on the above image to watch...
READ MORE
MEMBERS ONLY

See the Growth -- Value Dance on Relative Rotation Graphs
by Julius de Kempenaer,
Senior Technical Analyst, StockCharts.com
One of the predefined universes/groups on the RRG page is for Growth/Value. Many investors look at this relationship to help them determine whether the market is in a risk-on or risk-off mode. Just pull down the "Groups" selection box and look for Growth / Value.
When browsing...
READ MORE
MEMBERS ONLY
Is the ARKK ETF Showing Big Potential Going into 2022?
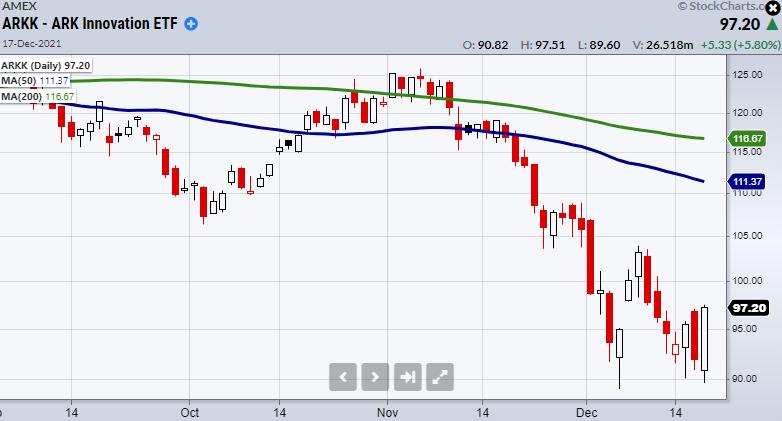
While the Nasdaq 100 (QQQ) is down 0.3% on Friday's close, Cathy Woods Ark Innovation ETF (ARKK) closed over 6% on the day. Additionally, ARKK made a strong close over yesterday's high, showing added strength when compared to the major indices. With that said, this...
READ MORE
MEMBERS ONLY

How to Avoid Failing Stocks

by TG Watkins,
Director of Stocks, Simpler Trading
In this week's edition of Moxie Indicator Minutes, TG explains how sometimes a move to the upside is really just a bounce into resistance. He will walk you through how to spot this and show how to not get caught in failing stocks and downtrends.
This video was...
READ MORE
MEMBERS ONLY

The Evolution And Essential Foundations Of The Stock Market Mastery Methodology

by Gatis Roze,
Author, "Tensile Trading"
This past week, Grayson and I had the special pleasure of being interviewed by David Keller who, in the video, posed many pithy questions as to the evolution of our Stock Market Mastery methodology.
We each reflected on the investing foundations differently, but all three of us agreed on the...
READ MORE
MEMBERS ONLY

STOCKS STRUGGLE WITH RATE HIKES AND OMICRON --STOCK INDEXES TEST 50-DAY AVERAGES --DEFENSIVE STOCK SECTORS HIT NEW RECORDS
by John Murphy,
Chief Technical Analyst, StockCharts.com
STOCK INDEXES WEAKEN... Stock prices are ending a volatile week on the downside. So far, no serious chart damage has been done as the three major stock indexes shown below are testing potential support at their 50-day moving averages. Stocks are struggling with the spread of the omicron virus (and...
READ MORE
MEMBERS ONLY
Industrial & Office REITs are Shining in the Real Estate Sector
by Julius de Kempenaer,
Senior Technical Analyst, StockCharts.com
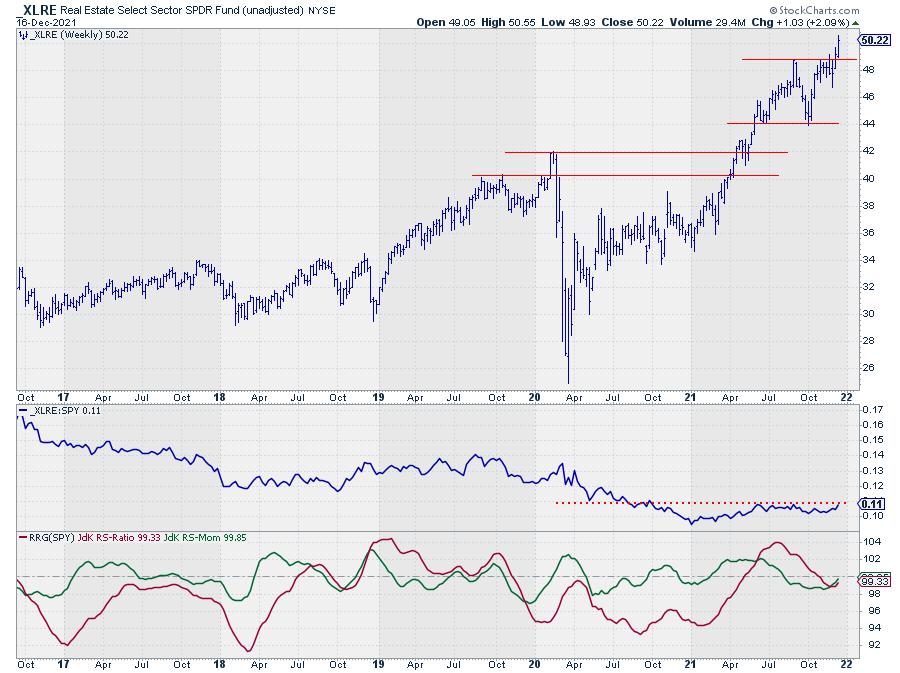
Watching the rotation of the Real Estate sector (XLRE) on a Relative Rotation Graph shows the tail inside the lagging quadrant after a long rotation through leading and weakening.
Six weeks ago, XLRE moved into the lagging quadrant, but quite rapidly started to pick up relative momentum again, pushing the...
READ MORE
MEMBERS ONLY
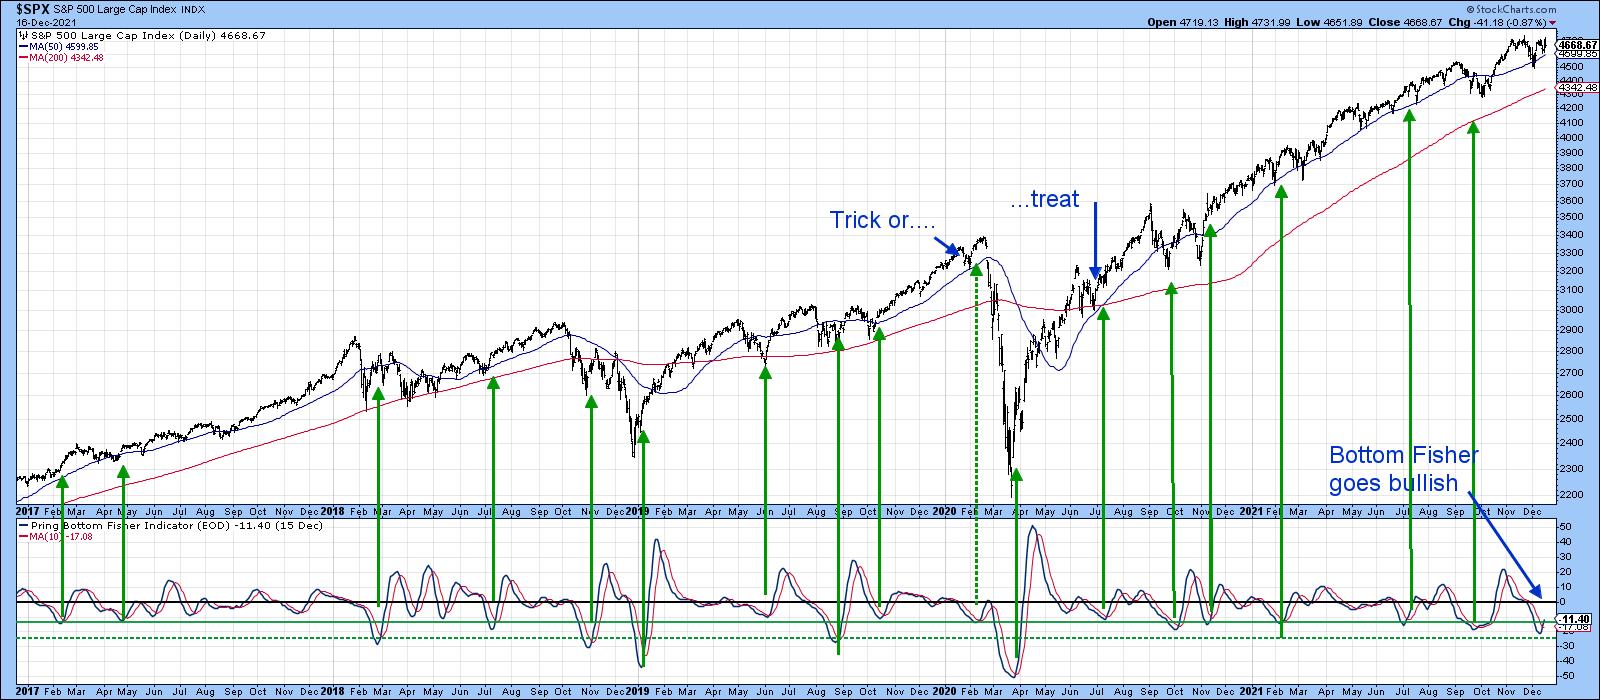
Three Charts That Suggests This Rally Has Legs.... For the Time Being
by Martin Pring,
President, Pring Research
A lot of indicators, such as the percentage of NYSE stocks above their 200-day MA and the NYSE bullish percentage, remain in confirmed downtrends that will take time to reverse. However, some of the shorter-term charts that have proved reliable in the past have just begun to offer some bullish...
READ MORE
MEMBERS ONLY

Chartwise Women: The Power of Chart Patterns
by Mary Ellen McGonagle,
President, MEM Investment Research
by Erin Swenlin,
Vice President, DecisionPoint.com
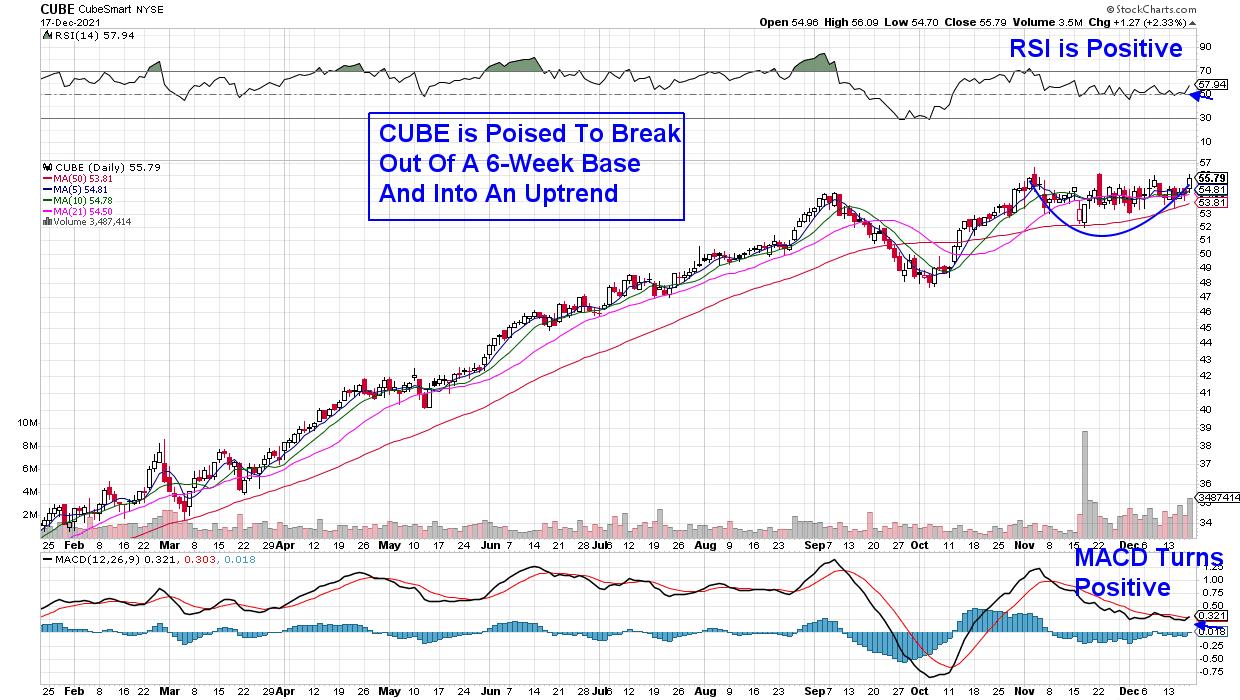
It's that time of year again! On this week's edition of Chartwise Women, Erin and Mary Ellen talk about their favorite chart patterns, with Mary Ellen going in-depth on Base Breakout patterns while Erin covers the Double Bottom, Ascending Triangle, Falling Wedge, Bull Flag and Triple...
READ MORE
MEMBERS ONLY

Strategies for Taking Profits

by Joe Rabil,
President, Rabil Stock Research
In this week's edition of Stock Talk with Joe Rabil, Joe Rabil discusses how he takes profits. He recommends defining who you are as a trader/investor, then shows how to go about taking profits whether you are a short-term trader or a Trend player. Joe then goes...
READ MORE
MEMBERS ONLY
Is The S&P 500 Setting Up for a Break to New Highs?
by Julius de Kempenaer,
Senior Technical Analyst, StockCharts.com
After dipping to 4500, the development of a potential inverted head-and-shoulders pattern started to take shape on the price chart of the S&P 500.
The overhead resistance just above 4700 has already been developing since the market first reached that area at the start of November. Very recently,...
READ MORE
MEMBERS ONLY
Will Wednesday's Momentum Continue or Fade?
On Wednesday, investors waited for the FOMC minutes release at 2 PM EST to see whether the Fed would be hawkish or dovish in its response to the recent Producer Price Index report (PPI). With the PPI showing inflation rising rapidly, the market gapped lower Tuesday on an expectation that...
READ MORE
MEMBERS ONLY

10 Things You Must Know About Crypto

by Dave Landry,
Founder, Sentive Trading, LLC
In this edition of Trading Simplified, Dave briefly covers Mystery Chart updates and analyzes what has happened there. Next up, he covers the 10 things you must know about Crypto and any other market.
This video was originally broadcast on December 15, 2021. Click anywhere on the Trading Simplified logo...
READ MORE
MEMBERS ONLY
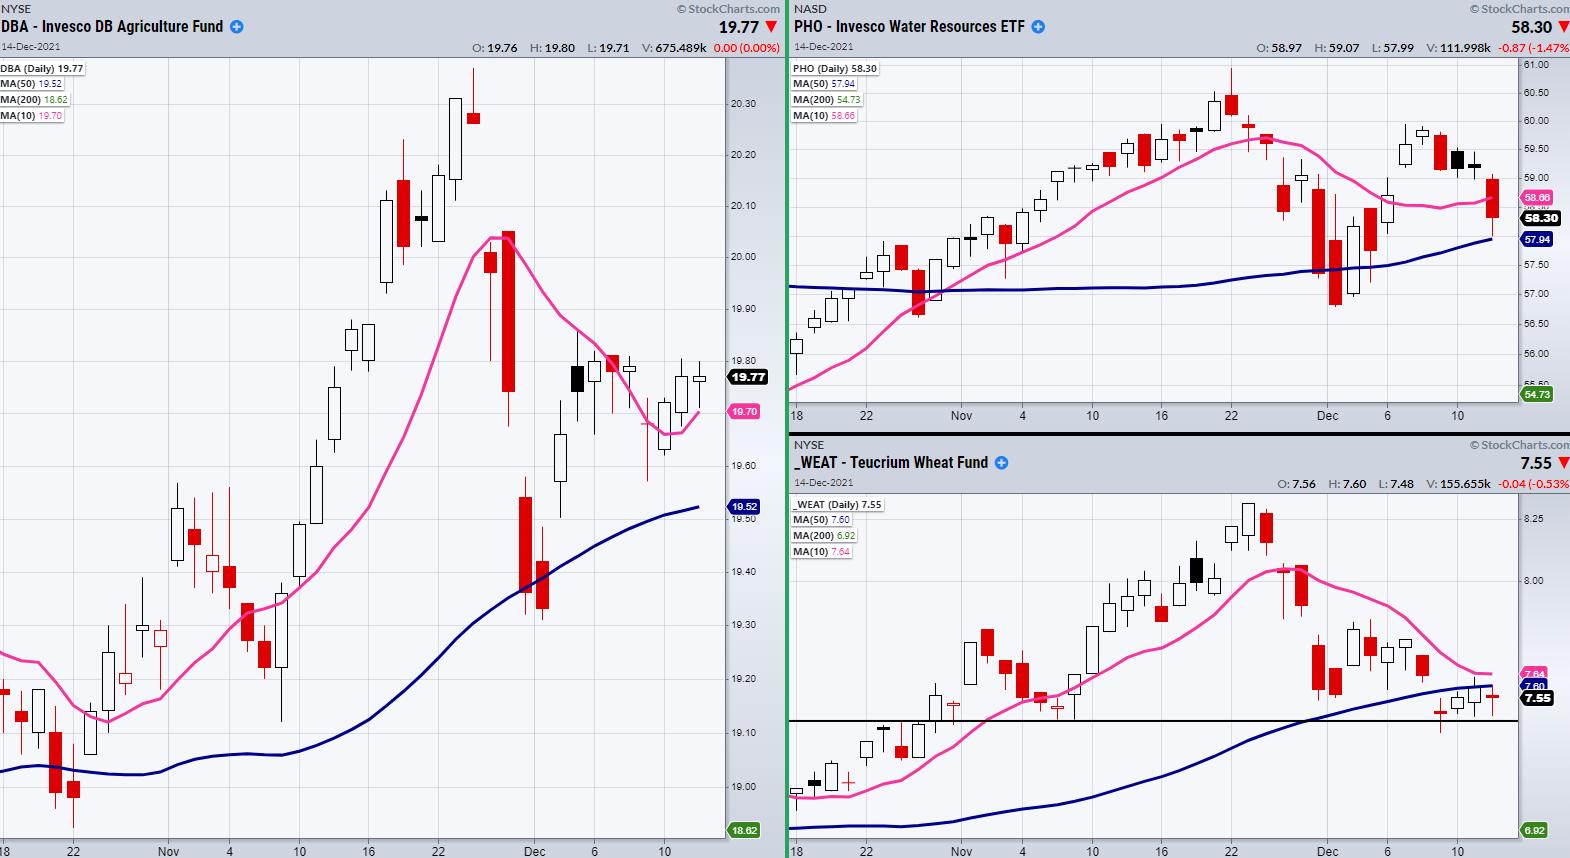
ETFs to Hedge Against Increasing Inflation
The Producer Price Index is accelerating at a quick pace, with a 0.8% increase this November. For the year, producer prices are up 9.6%. As the media and market digest the increase in prices, the stagflation narrative becomes more realistic.
With that said, this gives us more confirmation...
READ MORE
MEMBERS ONLY

Is Dr. Copper About to Make a Diagnosis?
by Martin Pring,
President, Pring Research
The copper price is reputed to have a "Ph.D. in economics" because of its ability to predict turning points in the global economy. That role is justified due to copper's widespread use in most sectors of the economy, from homes and factories to electronics, power...
READ MORE
MEMBERS ONLY

Sector Spotlight: US Leads Internationally and XLRE Stands Out
by Julius de Kempenaer,
Senior Technical Analyst, StockCharts.com
On this edition of StockCharts TV's Sector Spotlight, I take on the asset class and sector rotation as it played out last week. The relationship between stocks and bonds continues to be in favour for stocks while, at the sector level, Real Estate seems to be making an...
READ MORE
MEMBERS ONLY
Fireworks in December? Monthly Options Expire Friday
by Tom Bowley,
Chief Market Strategist, EarningsBeats.com
The Tuesday before the third Friday of each month gets the blood pumping at EarningsBeats.com. As momentum traders, it's EXTREMELY important to be aware as monthly options expiration approaches. We have seen time and time again how crazy the short-term market action can be when market makers...
READ MORE
MEMBERS ONLY
DP TV: Nasdaq "Under the Hood"
by Erin Swenlin,
Vice President, DecisionPoint.com

by Carl Swenlin,
President and Founder, DecisionPoint.com
On this episode of DecisionPoint, Carl reviews our exclusive DecisionPoint indicators, followed by an analysis of Bitcoin, 10-Year Treasury Yield, Bonds, Gold, Crude Oil and the Dollar. This week, he talks about participation using the Golden Cross Index (GCI) and Silver Cross Index (SCI) across the broad market indexes. Spoiler...
READ MORE
MEMBERS ONLY
Is the Santa Claus Rally Almost Here?
Tis the season for a Santa Claus rally.
Though the reasons for a Santa Claus rally are debatable, the main school of thought is that, because there is less institutional participation in the market as many take time off to travel, the stock market is left in the hands of...
READ MORE
MEMBERS ONLY

Is Inflation Truly A Problem? Here Are 3 Charts To Follow
by Tom Bowley,
Chief Market Strategist, EarningsBeats.com
Most of you know I'm not a fan of the media. It has zero to do with who they are as people and everything to do with how they make their money. They need visitors at their websites in order to sell ads. The best way to attract...
READ MORE
MEMBERS ONLY
Week Ahead: NIFTY Crawls Above 20-Week MA; RRG Chart Shows These Sectors Continuing to Outperform
by Milan Vaishnav,
Founder and Technical Analyst, EquityResearch.asia and ChartWizard.ae
After ending with gains in the week prior, this week the NIFTY continued with its pullback and has closed with gains again. The trading range continued to remain wider on the expected lines as the NIFTY oscillated 651.55 points over the previous week. After a very bad and weak...
READ MORE
MEMBERS ONLY
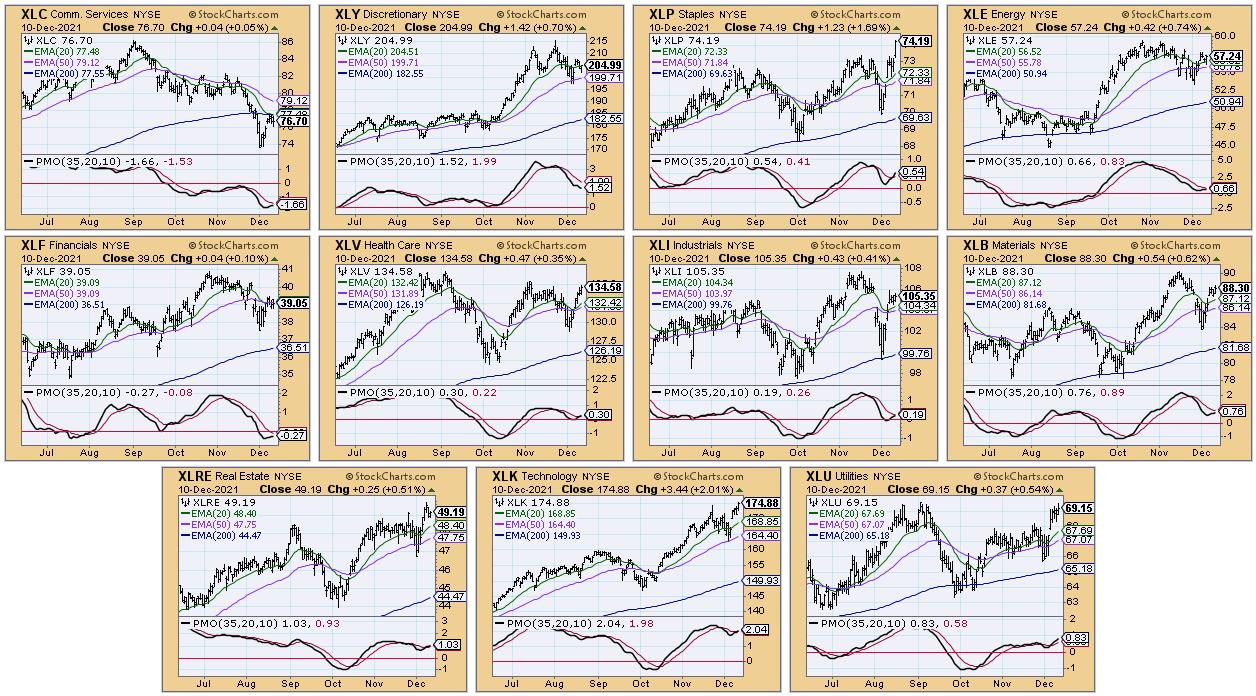
Sector CandleGlance Reveals Positive Momentum in All But One Sector
by Erin Swenlin,
Vice President, DecisionPoint.com
One of the tools we use at DecisionPoint to review sector performance and strength a CandleGlance with our PMO and key moving averages. It wasn't too long ago that every sector was displaying negative momentum. Now, we are seeing broad participation, with every sector having a PMO rising...
READ MORE
MEMBERS ONLY
Base Breakouts & Shining Stocks Amid Inflation
by Mary Ellen McGonagle,
President, MEM Investment Research
On this episode StockCharts TV'sThe MEM Edge, Mary Ellen reviews stocks that are breaking out of bases amid news. She also highlights areas that perform the best during periods with high inflation, such as now.
This video was originally recorded on December 10, 2021. Click on the above...
READ MORE
MEMBERS ONLY
The Mechanics of the Moxie Indicator
by TG Watkins,
Director of Stocks, Simpler Trading
In this week's edition of Moxie Indicator Minutes, TG goes over the mechanics and signals of his Moxie Indicator. He does this by demonstrating a variety of tickers in a variety of sectors, which include XPDI, WFC, and BAC.
This video was originally broadcast on December 10, 2021....
READ MORE
MEMBERS ONLY
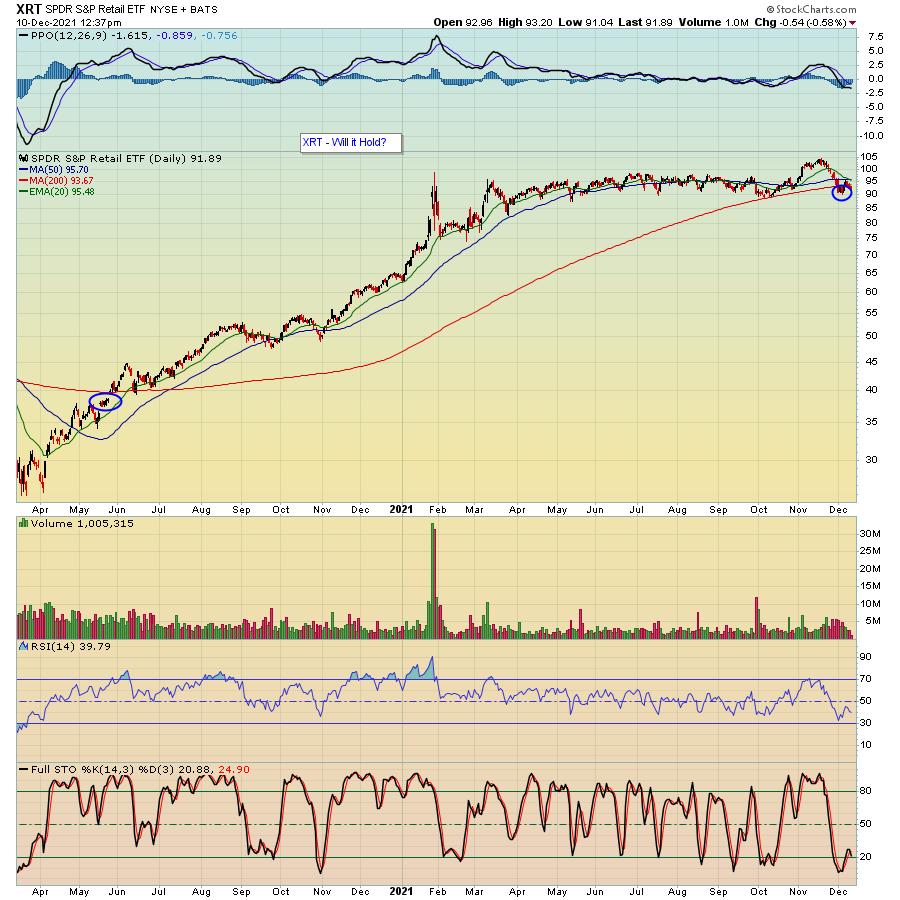
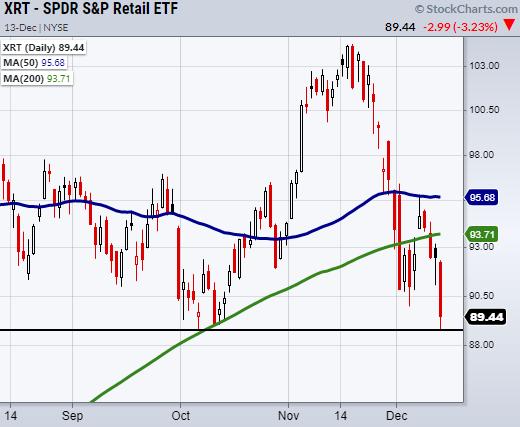
Retail Sector Could Hold the Key to a Santa Claus Rally

by John Hopkins,
President and Co-founder, EarningsBeats.com
The market has been under pressure the past several weeks after all of the major indexes hit record highs during November. The NASDAQ has particularly had a tough time getting back on track and it's hard to imagine any Santa Claus rally without the participation of tech stocks....
READ MORE
MEMBERS ONLY

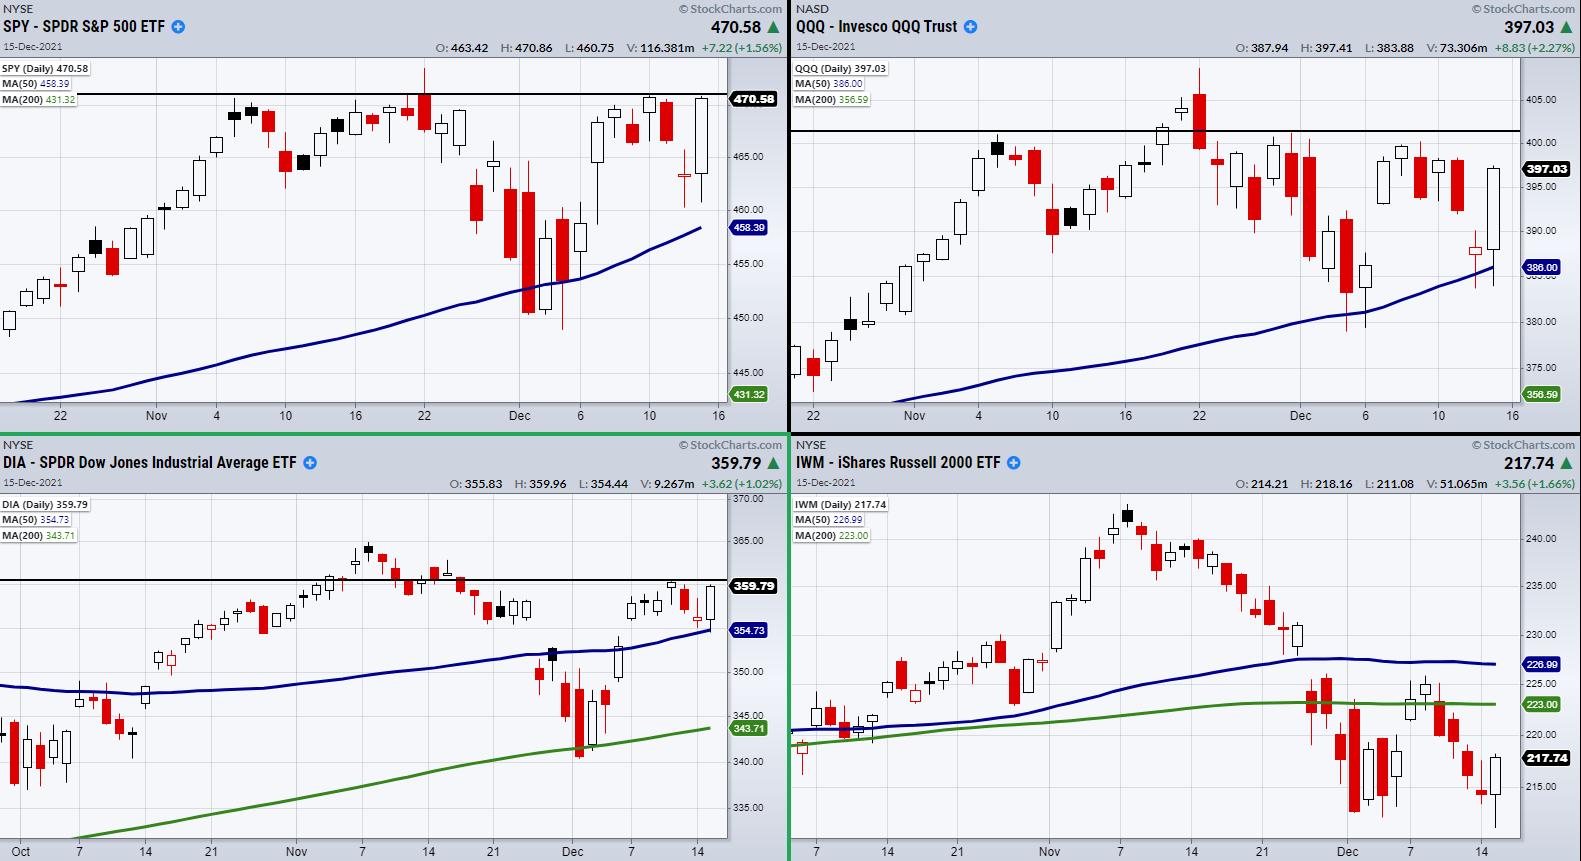
The Large-Cap Indices Reach a Pivotal Point
With a stock market gap up on Tuesday, many traders scrambled to re-enter as they grappled with FOMO (fear of missing out). Additionally, the market is reaching a pivotal point as traders who piled in wait for a breakout towards highs.
Looking at large-cap and big-tech indices, the S&...
READ MORE
