MEMBERS ONLY
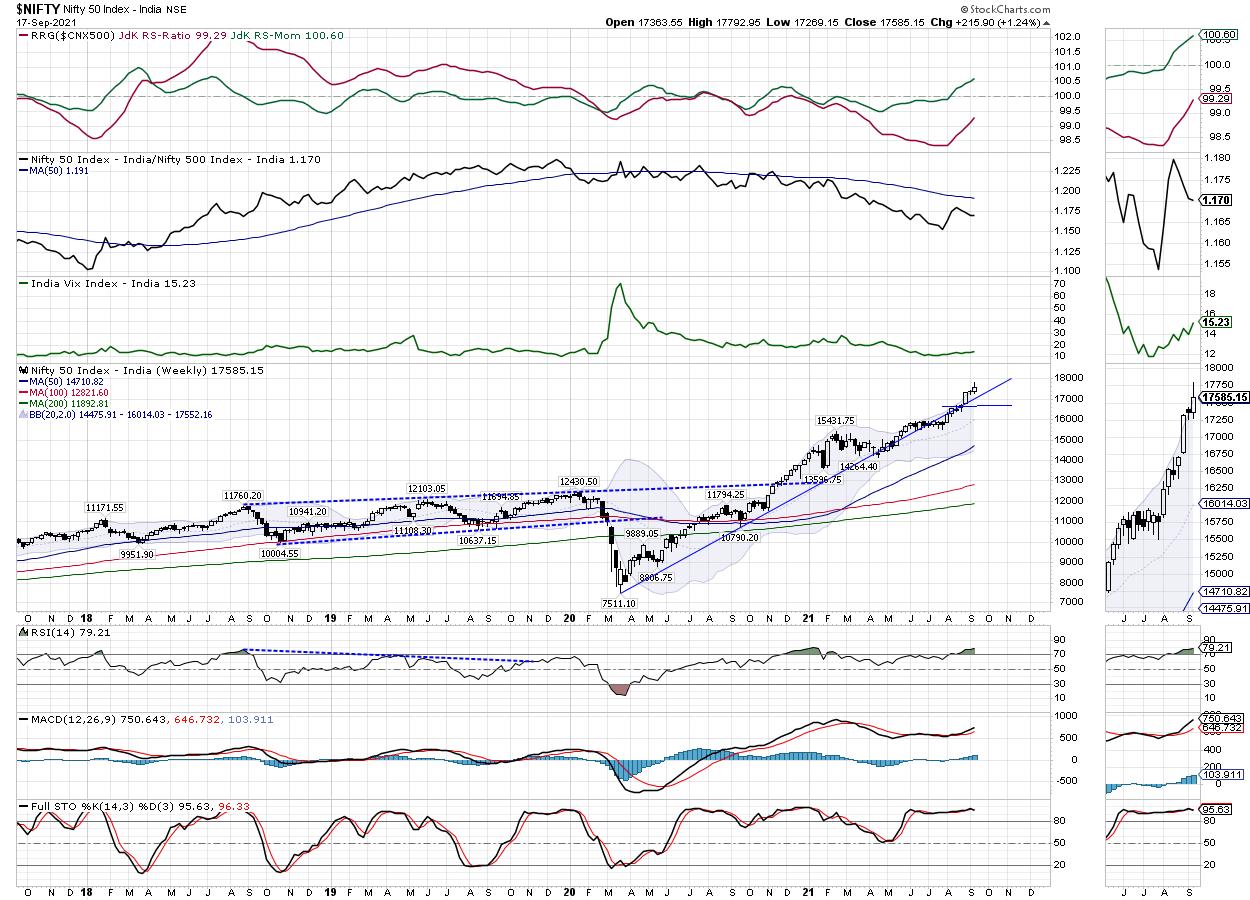
Week Ahead: NIFTY May Broadly Consolidate; RRG Chart Shows This Sector Ending Its Relative Underperformance

by Milan Vaishnav,
Founder and Technical Analyst, EquityResearch.asia and ChartWizard.ae
As discussed in an earlier technical note, the Indian equity markets were grossly overbought; as a result, they were largely expected to consolidate. However, in the first four days of the week, the NIFTY put up a very strong show as it kept marking incremental lifetime highs on a closing...
READ MORE
MEMBERS ONLY
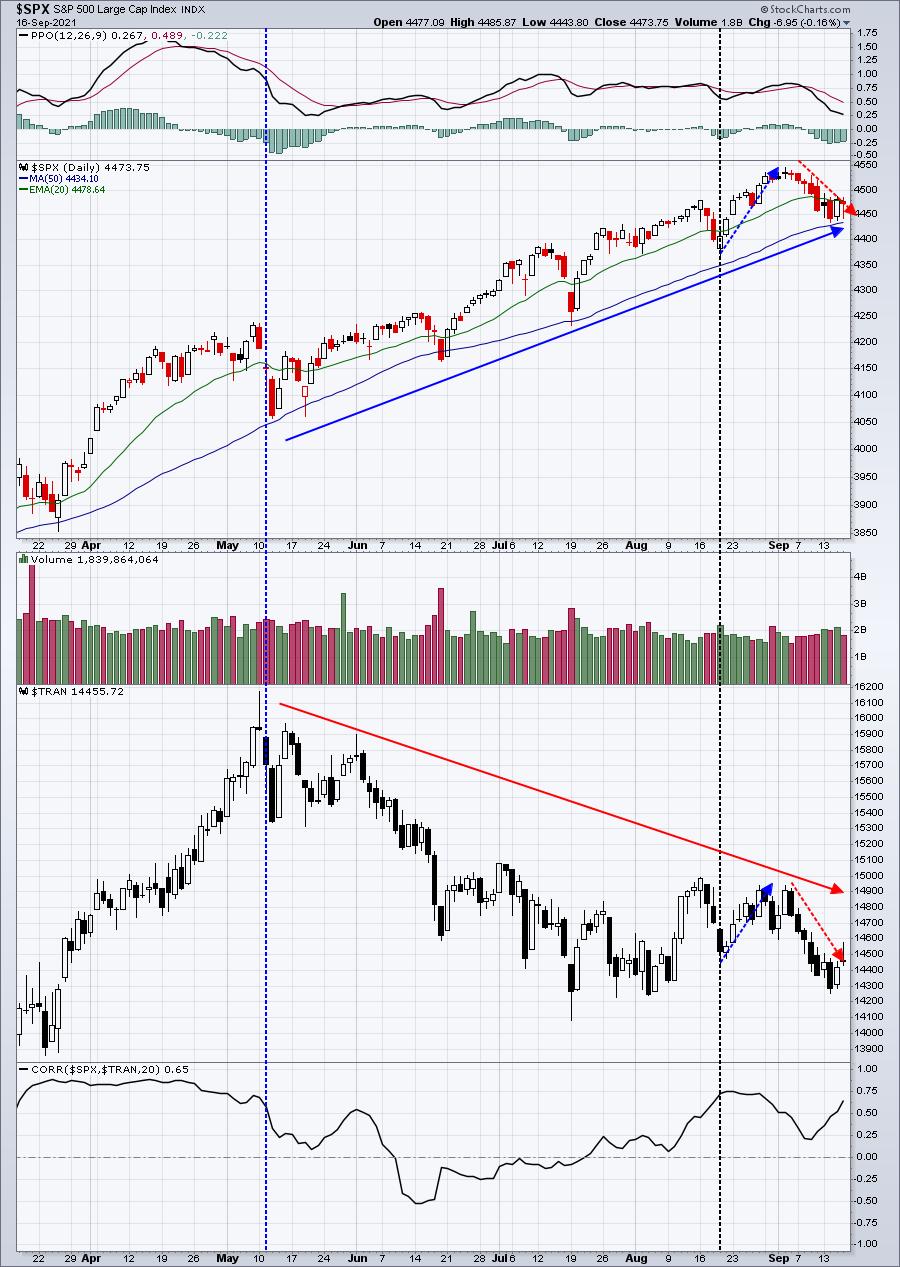
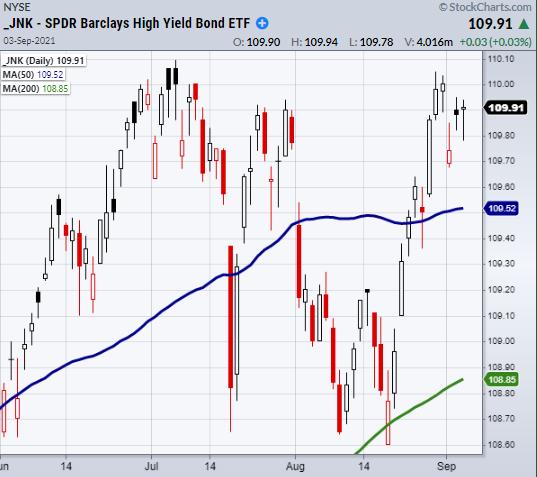
Does Poor Transportation Performance Signal A Bear Market Ahead?

by Tom Bowley,
Chief Market Strategist, EarningsBeats.com
It's an interesting question. After all, during periods of economic expansion, transportation stocks ($TRAN) should ship more goods, report higher profits, and be rewarded with higher stock prices. If you're not already aware, the TRAN and the S&P 500 have a very tight long-term...
READ MORE
MEMBERS ONLY
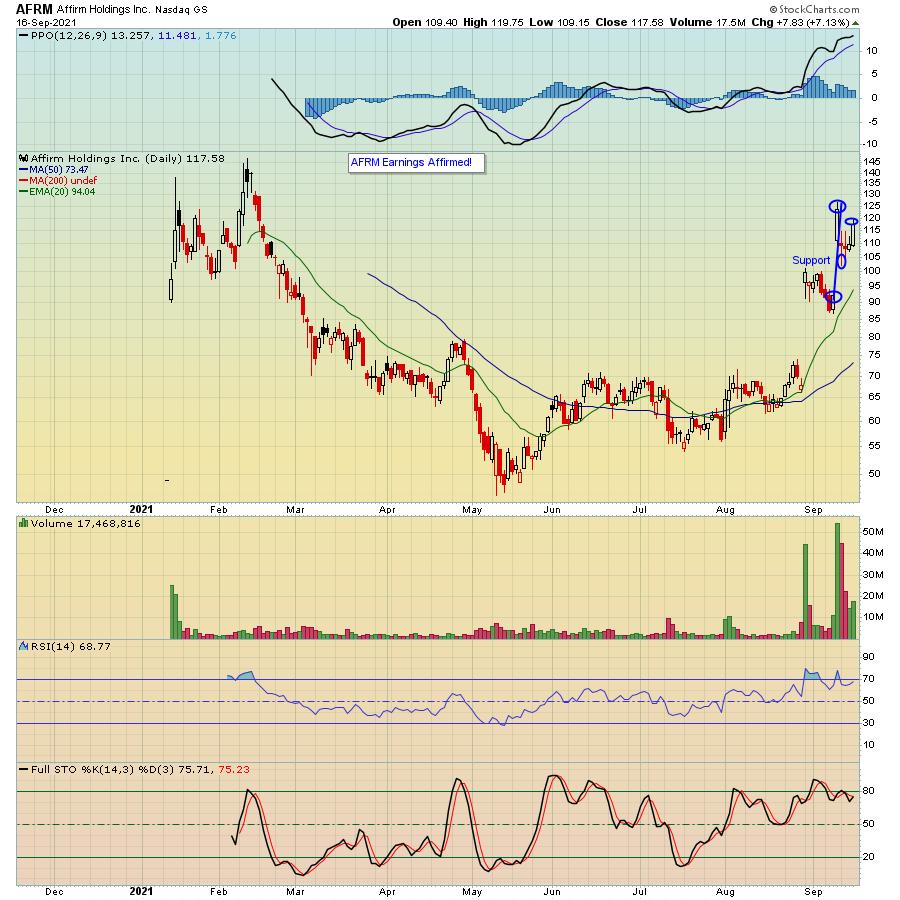
Profiting on Stocks After Earnings

by John Hopkins,
President and Co-founder, EarningsBeats.com
On September 9, Affirm Holdings (AFRM) reported its earnings results after the bell. The market liked what they heard and saw, with the stock climbing a nifty 37.5% from the prior day's close to the high the day after the numbers were released.
If you owned the...
READ MORE
MEMBERS ONLY

Should You Buy the Pullback?

by Mary Ellen McGonagle,
President, MEM Investment Research
This week on StockCharts TV'sThe MEM Edge, Mary Ellen reviews the broader markets and what to be on the lookout for to signal a bullish uptrend. She also shares pockets of strength that are poised to trade higher, as well as turnarounds that have further upside potential.
This...
READ MORE
MEMBERS ONLY

When In Doubt, Use a Checklist

by David Keller,
President and Chief Strategist, Sierra Alpha Research
I recently gave a webcast on how to avoid one of the sneakiest and most prolific of the behavioral biases: confirmation bias. Here's how it works. Instead of gathering evidence and then making a decision, you reverse the two. You actually make your decision first and then you...
READ MORE
MEMBERS ONLY

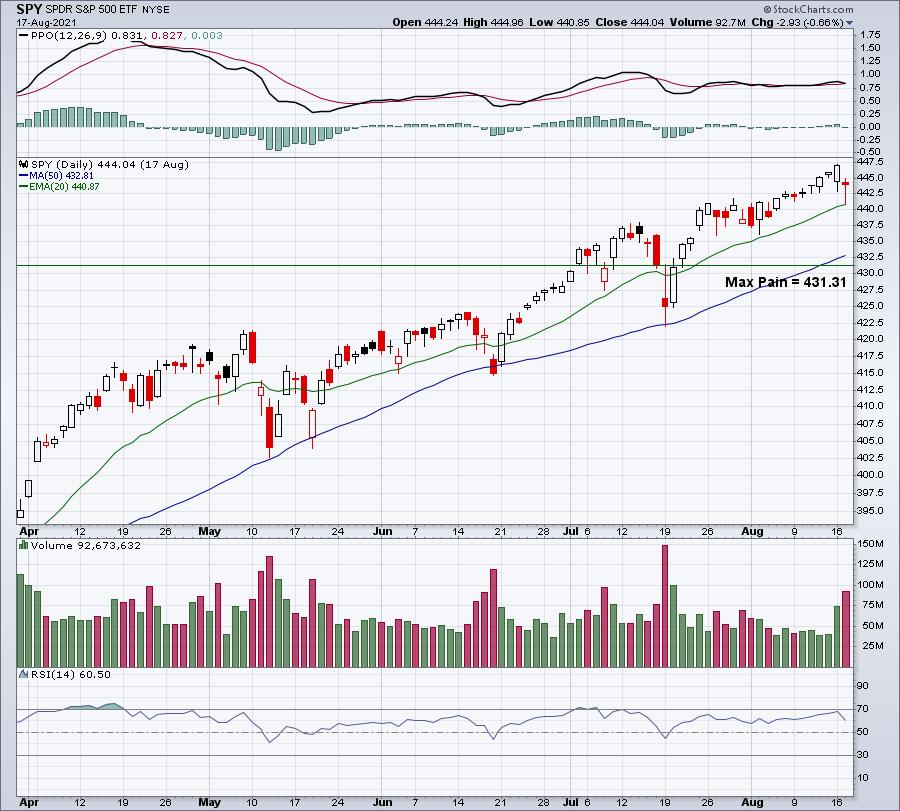
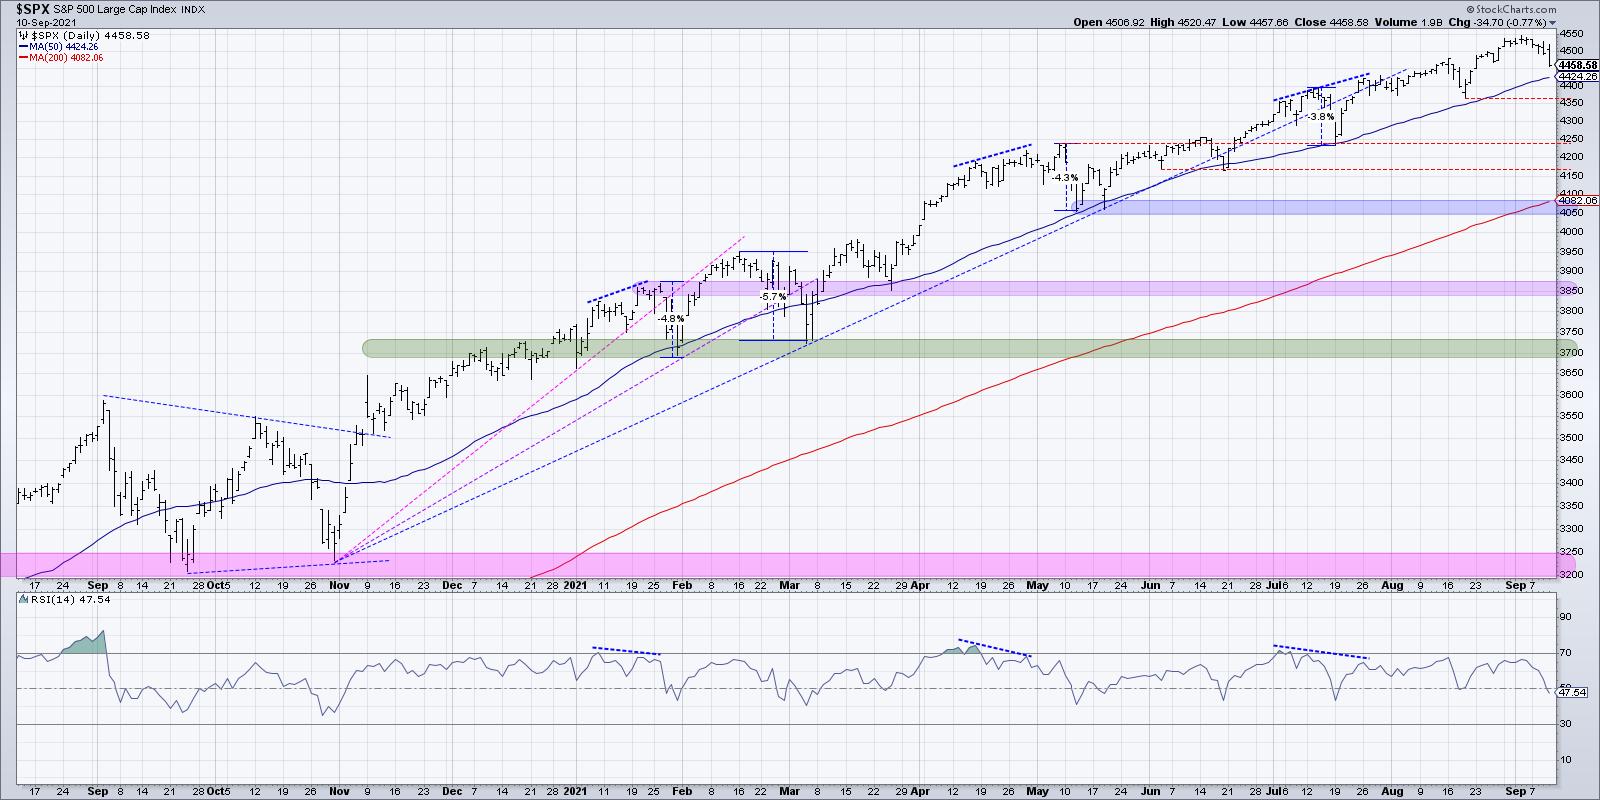
Breaking Key Support in the S&P 500 (SPY) Could Be a Reversal Opportunity
On Friday, the S&P 500 (SPY) broke an important support level by closing under the 50-day moving average and this week's low. While this was an important level to break, it was also a very clean and obvious place for the SPY to fall through.
For...
READ MORE
MEMBERS ONLY

AAII Percent Bears Surges, but Excessive Sentiment is not a Two-Way Street

by Arthur Hill,
Chief Technical Strategist, TrendInvestorPro.com
The AAII indicators are making waves this week so I will cover two charts. AAII percent bears surged to 39.3% and percent bulls dropped to 22.40%. As a result, net bull-bear percentage plunged to -16.90%, the first negative reading since September 2020. Note that the remaining 38....
READ MORE
MEMBERS ONLY

S&P 500 IS TESTING 50-DAY AVERAGE -- OTHER MEASURES OF MARKET BREADTH LOOK WEAKER

by John Murphy,
Chief Technical Analyst, StockCharts.com
S&P 500 TESTS 50-DAY MOVING AVERAGE... Chart 1 shows the S&P 500 trying to find support at its 50-day moving average (blue arrow). Stocks have entered a seasonally weak period extending from September into October. And despite the general consensus that stocks are due for a...
READ MORE
MEMBERS ONLY

Are Traders Programmed to Buy Dips?
With the pandemic came a wave of new retail traders. Using apps that make trading as easy as swiping up on a phone to execute an order, millennials and more jumped on the bull train after the initial market selloff. This rapid bullish trend has made dip-buying (buying an upward...
READ MORE
MEMBERS ONLY
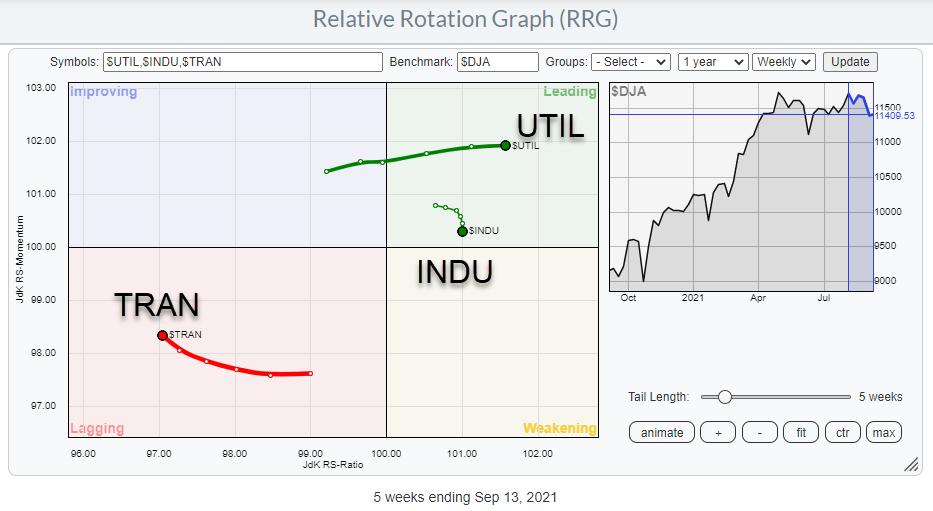
We Can See More Than "Just" Sector Rotation on Relative Rotation Graphs

by Julius de Kempenaer,
Senior Technical Analyst, StockCharts.com
I had planned to look at some lesser-known Relative Rotation Graphs in this week's episode of Sector Spotlight, but I used too much time on asset class and sector rotations to make that happen. So I am going to publish them here and give a brief description and...
READ MORE
MEMBERS ONLY

How to Find Stock Setups to Trade -- and What to Do When You Find Them

by Dave Landry,
Founder, Sentive Trading, LLC
As setups present themselves, it's hard to read something in a book and go out and do it. You really need to have somebody guide you on what a good setup is. In this edition of Trading Simplified, Dave shows you how to to just that.
This video...
READ MORE
MEMBERS ONLY
The Battle of Paid and Zero-Commission Trading Continues
On Tuesday, the chairman of the Securities and Exchange Commission, Gary Gensler, faced pushed back from senators about his recent ideas of adding cryptocurrency regulation, along with other topics such as meme stocks and zero-commission trading.
Specifically diving into zero-commission trading, Gensler believes that zero fees, while nice for the...
READ MORE
MEMBERS ONLY

Sector Spotlight: Rotation in the Defensive Sector is Gathering Momentum
by Julius de Kempenaer,
Senior Technical Analyst, StockCharts.com
On this edition of StockCharts TV's Sector Spotlight, asset class level stocks are still beating bonds, but the pace is slowing down. The big H&S pattern in EUR/USD, which suggested strength for the USD, is still there but lost a bit of its appetite.
Sector...
READ MORE
MEMBERS ONLY
Will The Market Maker Manipulation Kick In Again This Month?
by Tom Bowley,
Chief Market Strategist, EarningsBeats.com
One of my favorite times to trade is leading up to options expiration, because it's one time where I feel fairly comfortable which side of the trade that market makers are on. It's options expiration week and a time where we do a lot of research...
READ MORE
MEMBERS ONLY

DP TV: Recognizing Market Climaxes Can Help You Find Key Pivot Points

by Erin Swenlin,
Vice President, DecisionPoint.com
In this special evergreen episode of DecisionPoint, Erin discusses the concept of climax analysis. Market climaxes are important to recognize, as they generally will indicate whether the market is "initiating" a new move or if the current price move is "exhausting." Climax analysis picks up important...
READ MORE
MEMBERS ONLY
Several Indicators are Shaping Up for a Counter-Cyclical Correction

by Martin Pring,
President, Pring Research
Most of the time, the charts I plot are constructed from daily data. As a result, the necessary perspective provided by weekly ones often gets overlooked. By way of a remedy, I decided, some time ago, to create chartlists for key markets featuring weekly high low close and candlestick arrangements....
READ MORE
MEMBERS ONLY
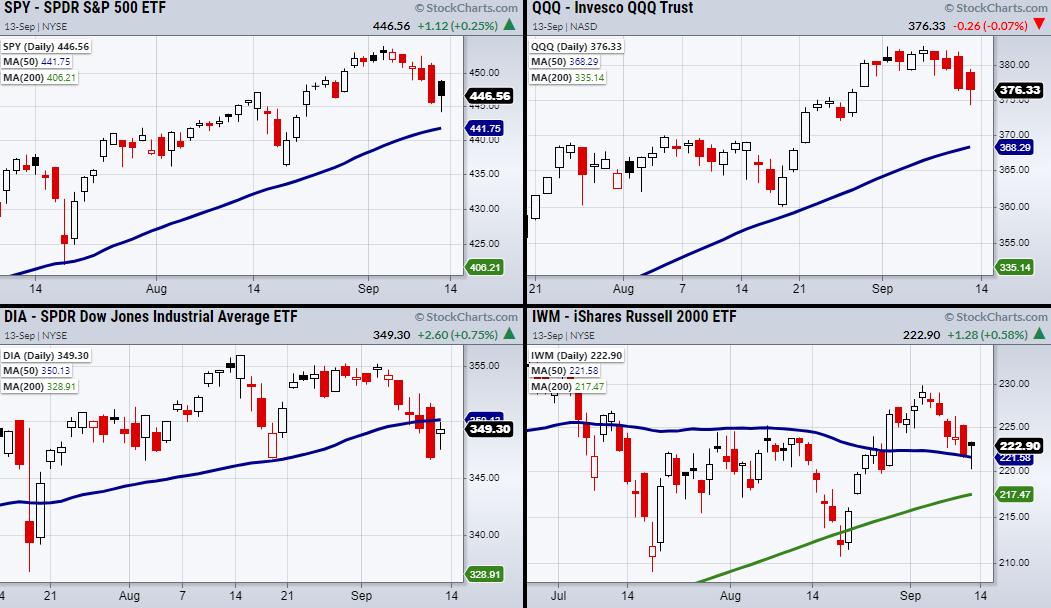
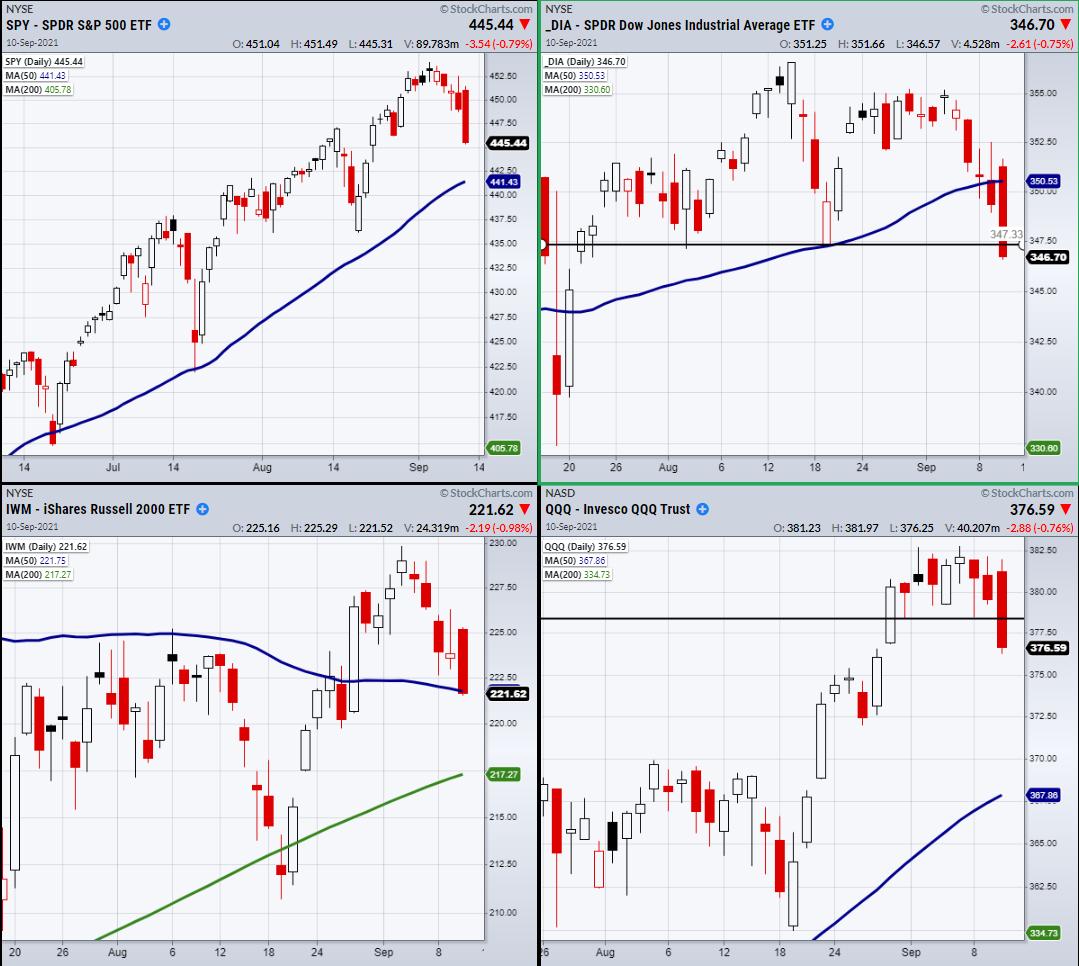
Why Tuesday's Volume Patterns are So Important for the Major Indices
The major indices closed surprisingly well on Monday. Although the initial morning gap-up did not hold, the Dow Jones (DIA) and the Russell 2000 (IWM) were able to make a comeback, with support from IWM's 50-DMA at $221.58 and the low of 8/19 at $347.31...
READ MORE
MEMBERS ONLY

AAPL on the Hinge

by Bruce Fraser,
Industry-leading "Wyckoffian"
Apple, Inc. (AAPL) has been one of the most analyzed stocks in the Wyckoff Power Charting pages. It is the largest company by market capitalization and has a huge influence on the major stock indexes. On March 19th of 2015 it was added to the (pre) historic Dow Jones Industrial...
READ MORE
MEMBERS ONLY
My PRIMARY Technical Indicator And One Industry Group Likely Under Your Radar
by Tom Bowley,
Chief Market Strategist, EarningsBeats.com
Following rotation in 2021 has been difficult because few industry groups have maintained leadership roles for any length of time. There have been a few. Specialty finance ($DJUSSP), internet ($DJUSNS), and software ($DJUSSW) come quickly to mind among our 5 aggressive sectors. Outside of the aggressive sectors, I could certainly...
READ MORE
MEMBERS ONLY

New Trend Signals: Act Now or Wait for a Pullback?
by Arthur Hill,
Chief Technical Strategist, TrendInvestorPro.com
Chartists often face a conundrum when a new trend signal triggers because the stock or ETF is frequently extended when this signal triggers. After all, it takes strong buying pressure for a new uptrend to signal. Short-term overbought or extended conditions are long-term bullish, but these same conditions can lead...
READ MORE
MEMBERS ONLY
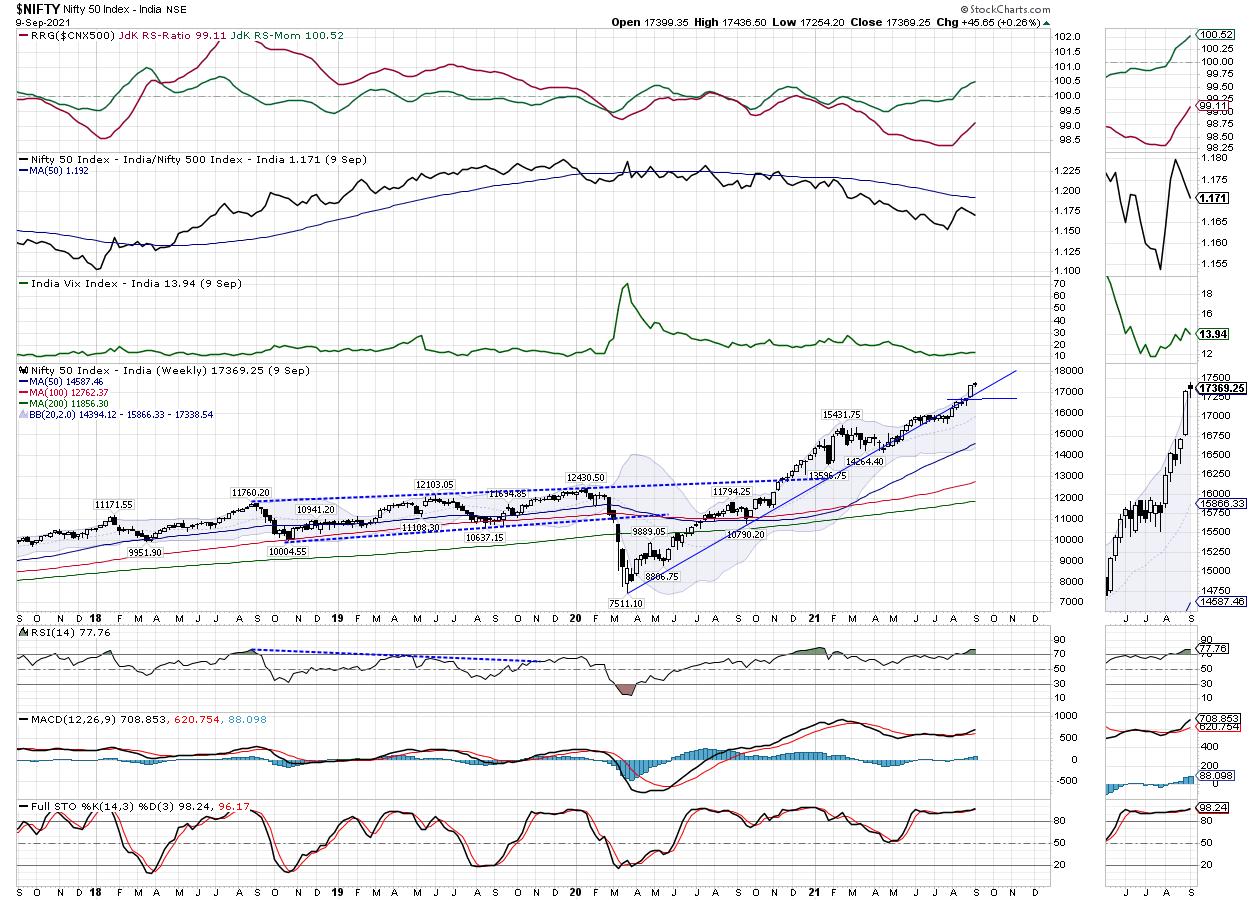
Week Ahead: NIFTY is Inherently Buoyant, But May Consolidate in a Broad Range; RRG Chart Shows a Good Setup
by Milan Vaishnav,
Founder and Technical Analyst, EquityResearch.asia and ChartWizard.ae
In the previous weekly note, it was mentioned that even though the NIFTY and other key indexes are grossly overbought, the options data is continuing to show strength. This also meant that the supports were dragged higher by the NIFTY. While trading on the expected lines, the Indian equity markets...
READ MORE
MEMBERS ONLY
The Markets are Weakening... Here's A System That Will Help You Prepare
by Mary Ellen McGonagle,
President, MEM Investment Research
The S&P 500 posted its worst week since February, with every sector ending in the red. The move points to investor concerns about volatility as we head into the typically difficult fall period.
While subscribers to my MEM Edge Report will attest to clear-cut pockets of strength, as...
READ MORE
MEMBERS ONLY
Four Signs the Bull Market is Over
by David Keller,
President and Chief Strategist, Sierra Alpha Research
"Technical analysis is a windsock, not a crystal ball." - Carl Swenlin
For me, technical analysis is not about trying to predict the future. So when I'm asked to give my S&P 500 target for year-end, I try not to giggle as I answer....
READ MORE
MEMBERS ONLY
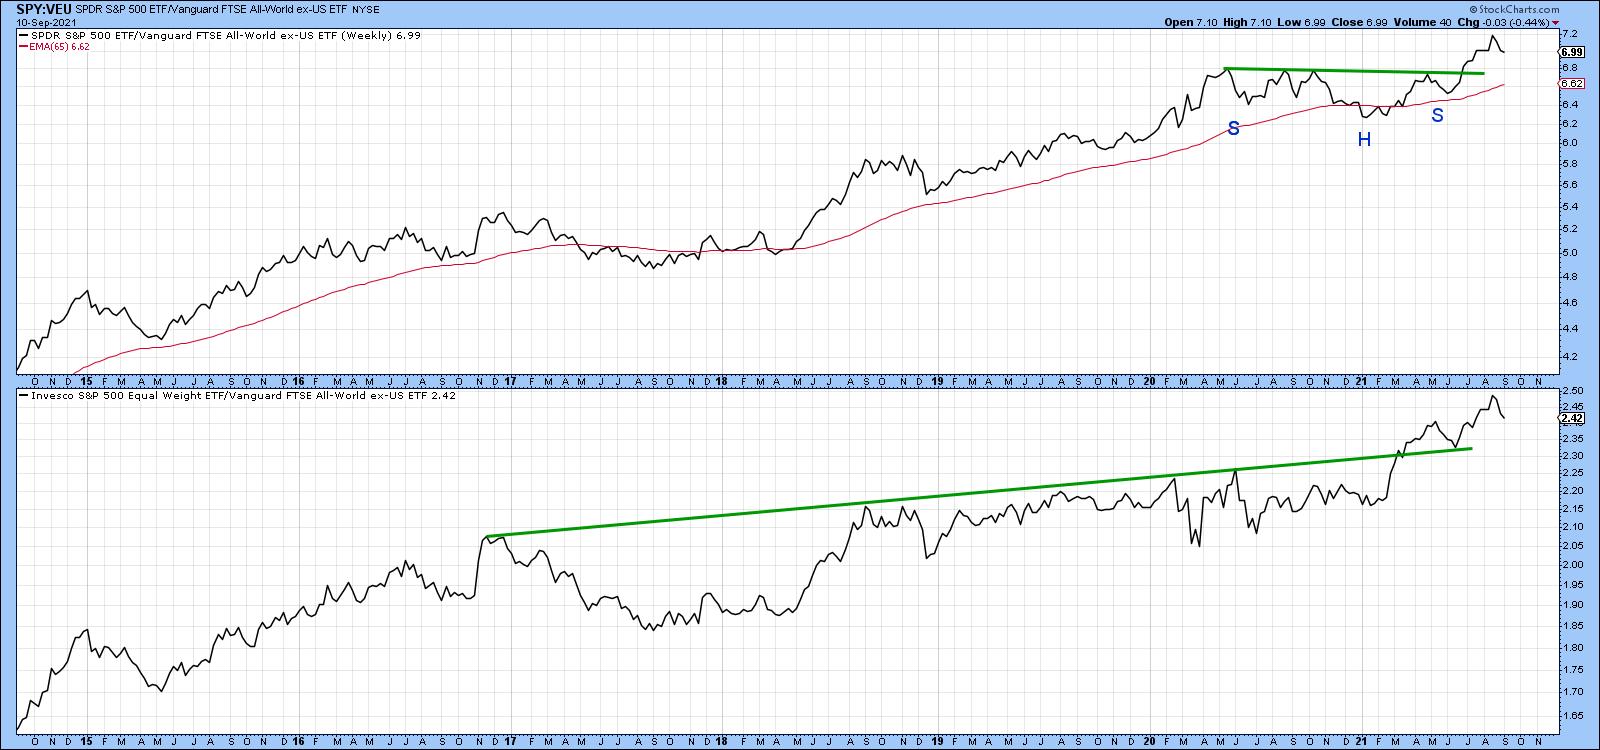
Nine Country ETFs That are Starting to Emerge
by Martin Pring,
President, Pring Research
Chart 1 shows that the US stock market is in a long-term uptrend relative to the rest of the world. The upper window compares the S&P to the Vanguard All-World ex-US ETF and indicates a recent breakout from a consolidation reverse head-and-shoulders. The lower panel substitutes the S&...
READ MORE
MEMBERS ONLY
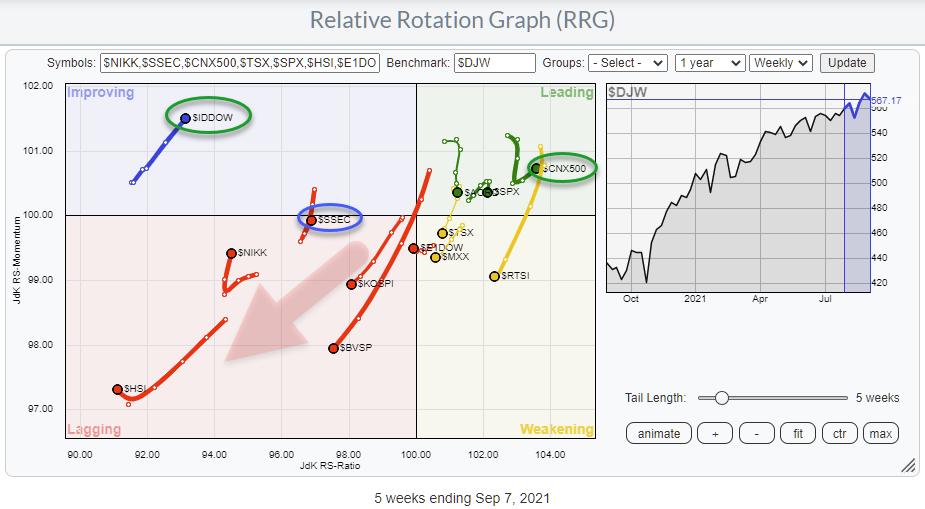
An International Perspective on (Stock) Markets From RRG
by Julius de Kempenaer,
Senior Technical Analyst, StockCharts.com
With the SPY/SPX chart sending curveballs, sector rotation on Relative Rotation Graphs is sending conflicting signals. With breadth continuing to deteriorate as the S&P continues to creep higher, getting a handle on the markets is not getting any easier. So instead of focusing on the S&...
READ MORE
MEMBERS ONLY
Is it a Pullback or Something More Ominous?
by Mary Ellen McGonagle,
President, MEM Investment Research
This week on StockCharts TV'sThe MEM Edge, Mary Ellen reviews last week's market action to determine whether we're in for rougher times ahead. She also highlights how to tell if your stock is pulling back or poised to head much lower.
This video was...
READ MORE
MEMBERS ONLY
Does the Transportation Sector (IYT) Hold the Fate of the Market?
When the market struggles to decide which direction to travel in, we tend to see increased volatility. Throughout last week, the market was struggling to pick a direction until finally it threw in the towel and broke lower near the end of Friday. This is a considerable break in price...
READ MORE
MEMBERS ONLY
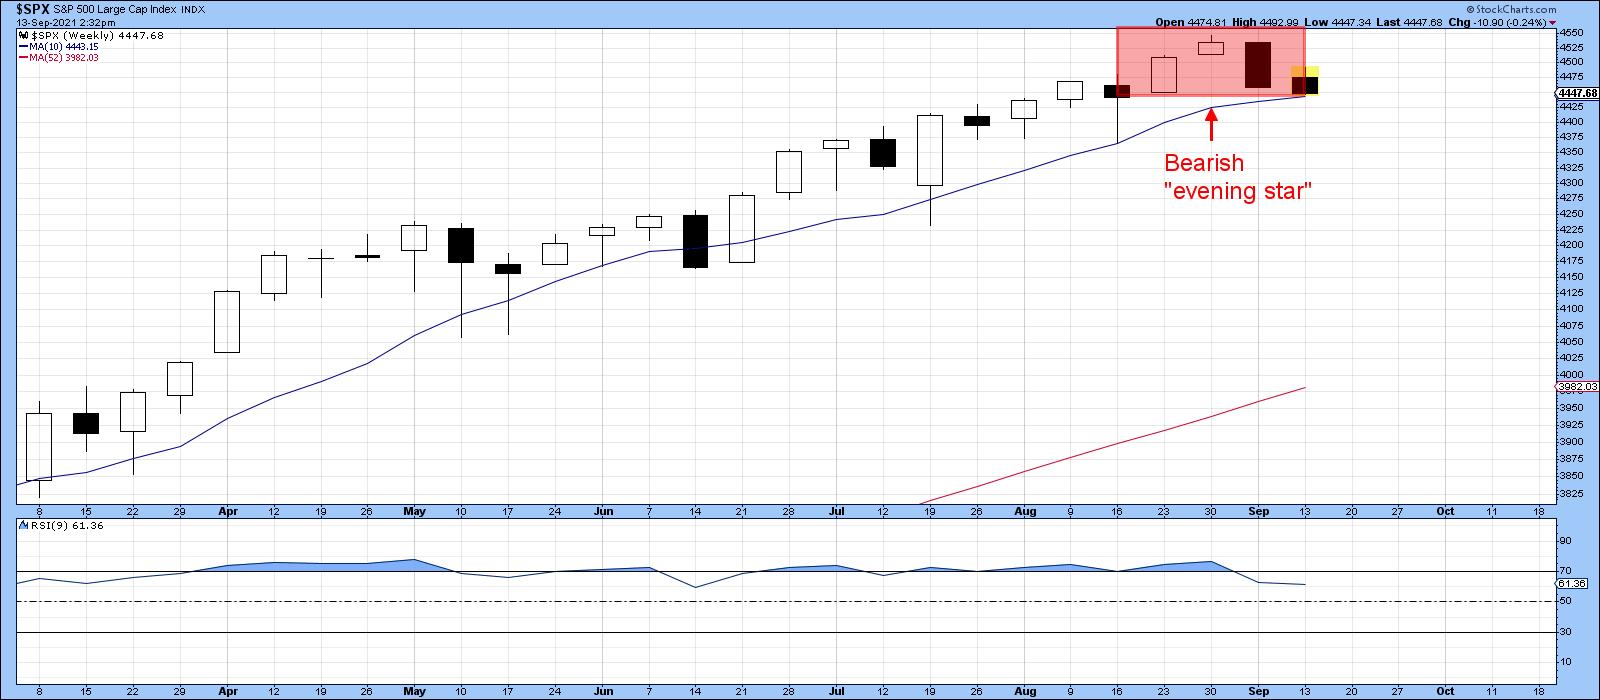
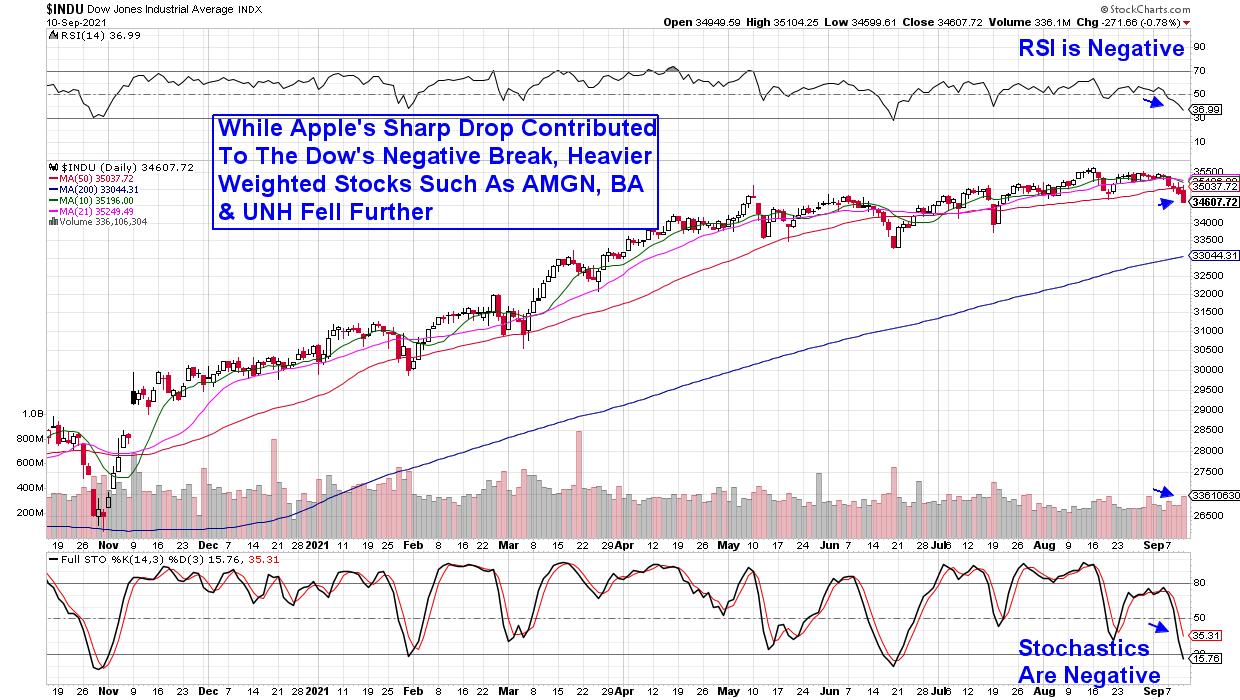
What You Need to Know About September Weakness
by Tom Bowley,
Chief Market Strategist, EarningsBeats.com
Congratulations! We've made it through the first 10 days of September mostly unscathed. At the time of this writing, the S&P 500 is down slightly more than 0.50% month-to-date. Momentum remains fairly strong and the trend is up, so why should we worry? Well, let&...
READ MORE
MEMBERS ONLY
Pressure Continues to Build For Global Markets
by Julius de Kempenaer,
Senior Technical Analyst, StockCharts.com
Over the past few weeks, I have been pointing out conflicting rotations for sectors on Relative Rotation Graphs, the negative divergence between RSI and SPY and a few more arguments that signal caution.With regard to the S&P, that has not paid off.... yet. The US stock market,...
READ MORE
MEMBERS ONLY

How to Discover Trend Alignment Using a Single MA Line

by Joe Rabil,
President, Rabil Stock Research
In this week's edition of Stock Talk with Joe Rabil, Joe shows how a simple moving average can help to define the trend in each time frame. He then explains how to take it a step further and find trend alignment in 3 timeframes. By doing so, we...
READ MORE
MEMBERS ONLY
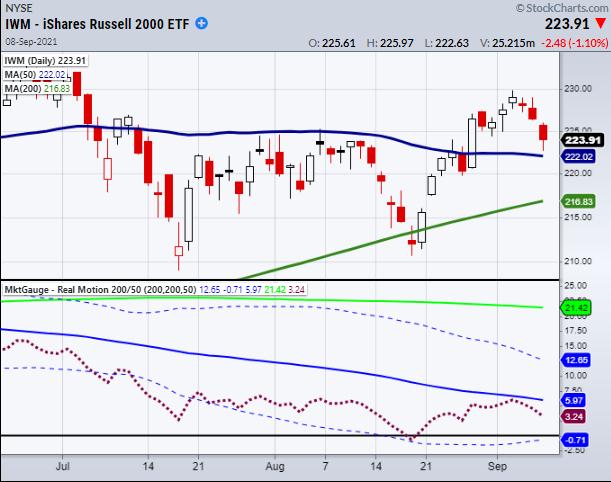
How Momentum Plays a Key Role in the Russell 2000 (IWM)
Representing 2000 small-cap companies, the Russell 2000 (IWM) gives a great view of the overall market picture.
Recently, we talked about watching our Real Motion momentum indicator to time a buy entry if it cleared its 50-day moving average in both price and momentum. However, momentum was unable to clear...
READ MORE
MEMBERS ONLY
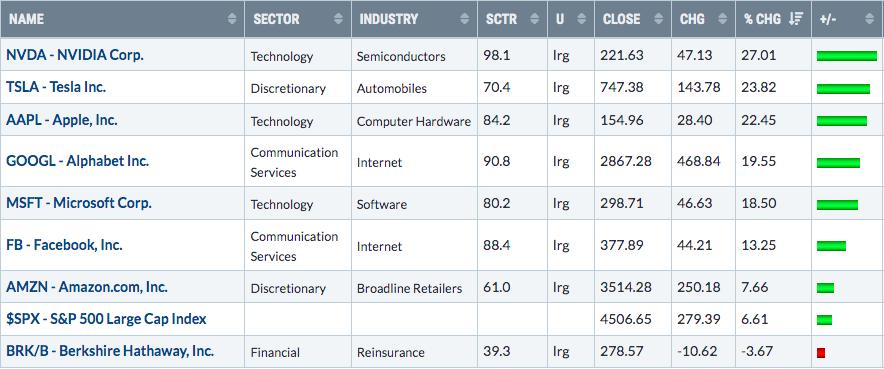
Strong Stocks Hitting Key Support Levels; S&P 500 Performance Could Be Impacted
by Tom Bowley,
Chief Market Strategist, EarningsBeats.com
There's no doubt that U.S. equities have been carried higher by a handful of mega-cap superstars. The S&P 500 is a market cap weighted index and its top holdings include:
* Apple (AAPL): 5.90%
* Microsoft (MSFT): 5.60%
* Amazon.com (AMZN): 4.05%
* Alphabet (GOOGL)...
READ MORE
MEMBERS ONLY

Rydex Ratio Reaching Historically Overbought Territory
by Erin Swenlin,
Vice President, DecisionPoint.com
I haven't reviewed the Rydex Ratio chart in some time, mainly because what used to be considered overbought territory became the "new" oversold territory and I wanted to see how it behaved moving forward.
A quick refresher on what the Rydex Ratio tracks. We compare the...
READ MORE
MEMBERS ONLY

Nine Country ETFs That are Starting to Emerge
by Martin Pring,
President, Pring Research
Chart 1 shows that the US stock market is in a long-term uptrend relative to the rest of the world. The upper window compares the S&P to the Vanguard All-World ex-US ETF and indicates a recent breakout from a consolidation reverse head-and-shoulders. The lower panel substitutes the S&...
READ MORE
MEMBERS ONLY
Why Jobs Growth Could Make or Break the Current Market
The jobs market is growing, with more companies offering higher wages and increased benefits. For instance, Walmart (WMT) increased its average minimum wage to $16 an hour and has a program to pay for worker's tuition at a four-year college. Many other companies have followed suit with increasing...
READ MORE
MEMBERS ONLY
Sector Spotlight: Frustration Takes Foothold in the Markets
by Julius de Kempenaer,
Senior Technical Analyst, StockCharts.com
On this edition of StockCharts TV's Sector Spotlight, I talk you through the recent rotations in Asset Classes and Sectors, addressing the counter-trend move in the USD index -- which is close to negating the double bottom in the index and the H&S pattern in the...
READ MORE
MEMBERS ONLY
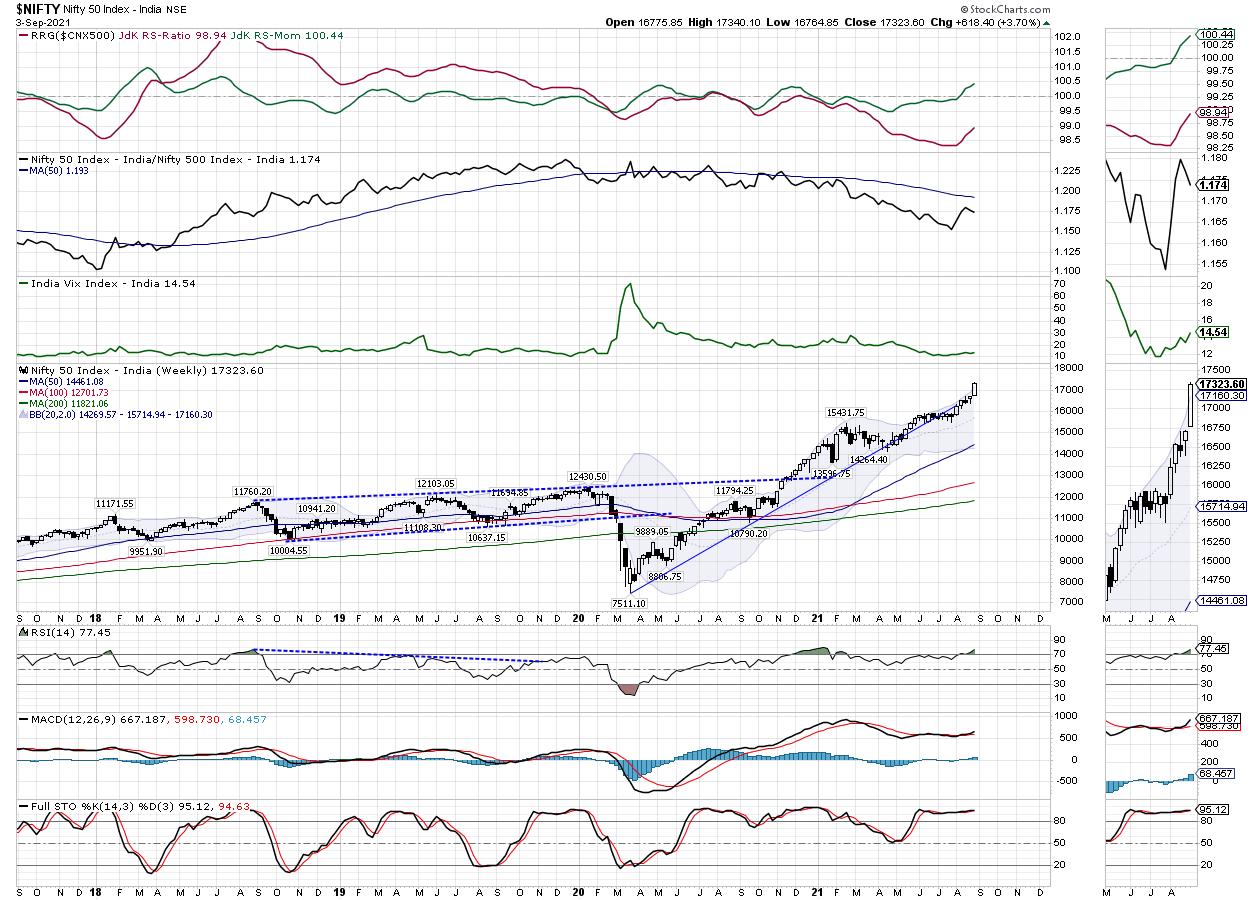
Week Ahead: NIFTY Shows Internal Strength; RRG Chart Show These Sectors' Improving Relative Strength
by Milan Vaishnav,
Founder and Technical Analyst, EquityResearch.asia and ChartWizard.ae
In a very strong surge to the up move, the Indian equity markets scaled greater heights, ending on a new lifetime high. In the previous edition of the weekly note, it was mentioned that, looking at the week's options data and the amount of PUT writing that was...
READ MORE
MEMBERS ONLY
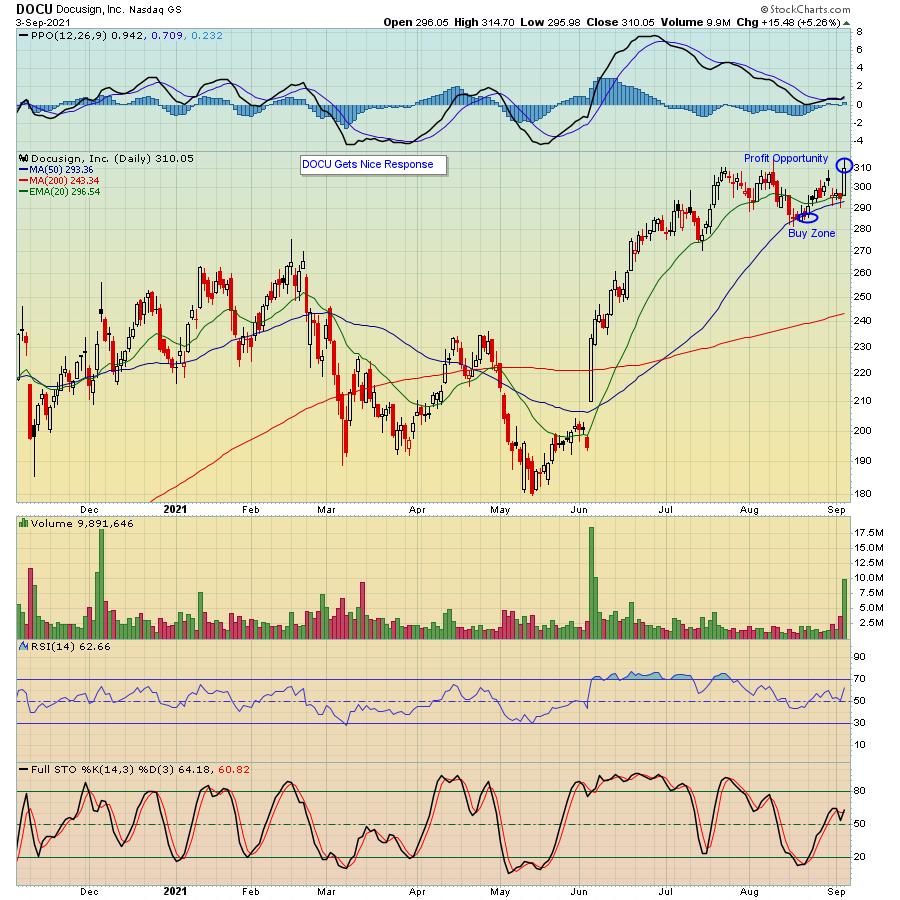
How to Profit from Strong Earnings Reports While Reducing Risk
by John Hopkins,
President and Co-founder, EarningsBeats.com
For a very long time, I have avoided holding stocks that I own into an earnings report. I should explain that I am more of a short-term trader, so I don't like the risk that goes along with holding a stock when they are about to report. And...
READ MORE
MEMBERS ONLY
Base Breakouts and Gaps Up That You Need To See!
by Mary Ellen McGonagle,
President, MEM Investment Research
This week on StockCharts TV'sThe MEM Edge, Mary Ellen shares growth stocks that are on the move. She also reviews where the current strength is in the markets, as well as hot Cryptocurrency-related stocks.
This video was originally recorded on September 3, 2021. Click on the above image...
READ MORE
MEMBERS ONLY
Bad Jobs Report Ahead of Labor Day
On Friday, the jobs report showed 235,000 new jobs reported for August. This was not good news since the estimate was roughly 500,000 higher. Ouch! However, the major indices did not take a large hit and closed roughly flat or a smidge down for the day.
So why...
READ MORE
