MEMBERS ONLY

Volatility Hits Rock Bottom, What It Means for the Week Ahead

by Milan Vaishnav,
Founder and Technical Analyst, EquityResearch.asia and ChartWizard.ae
Though the NIFTY is trading just below lifetime highs, it appears to be in a zone of indecision. What's the best strategy in a setting where any adverse trigger could make the market vulnerable?...
READ MORE
MEMBERS ONLY
Investing Goals for 2026: Set Alerts and Stay Ahead

by Jayanthi Gopalakrishnan,
Director of Site Content, StockCharts.com
Hope you all had a wonderful Christmas!
The Santa Claus Rally window is officially here, and so far, it looks like we may get that holiday gift. Historically, when the market rallies during this period, it often sets the stage for positive momentum into the new year. On the flip...
READ MORE
MEMBERS ONLY

StockCharts Insider: How to Spot Style Rotation Before the Crowd

by Karl Montevirgen,
The StockCharts Insider
Before We Dive In…
The market isn’t one story. It’s a dozen stories fighting for the spotlight. And depending on the day, a different one steals the show. One of the cleanest ways to read those stories is through Market Factors—Value, Growth, Momentum, Quality, and more. Spot...
READ MORE
MEMBERS ONLY

StockCharts Insider: The Five Questions That Bring the 10 Laws Together
by Karl Montevirgen,
The StockCharts Insider
Before We Dive In…
After John Murphy’s 10 Laws, a nagging question remains: where do you actually begin once you’ve loaded your chart? Maybe you weren’t expecting it, but the answer isn’t an indicator or setup. Instead, it begins with a sequence of questions.
You see,...
READ MORE
MEMBERS ONLY

Peace on Earth, Stability in Bonds? Watch These 3 Charts for Fixed Income in 2026
What does next year have in store for the bond market? Treasury yields, the yen, and credit spreads are expected to shape fixed-income returns in 2026. Which charts should you be watching? Find out here....
READ MORE
MEMBERS ONLY
Larry Williams’ 2026 Market Forecast: Cycles, Risks, and Opportunities

by Larry Williams,
Veteran Investor and Author
Larry Williams presents his full-year 2026 market outlook, explaining why many popular bearish forecasts don’t align with history or market data. With the help of cycles, valuations, and employment trends, Larry outlines what investors can realistically expect in the year ahead....
READ MORE
MEMBERS ONLY

Stocks are Improving - So Why Am I Still Cautious?

by Julius de Kempenaer,
Senior Technical Analyst, StockCharts.com
Stocks may be improving again, but the signals aren’t lining up cleanly just yet. Julius de Kempenaer explains what’s getting better, what’s still holding the market back, and why caution might be warranted here....
READ MORE
MEMBERS ONLY

Watch This Chart — “Affordability” May Be About to Get Less Affordable

by Martin Pring,
President, Pring Research
Gold's historic leadership may be shifting. A critical Gold/CRB signal suggests a potential commodity bull market and rising affordability risks ahead. ...
READ MORE
MEMBERS ONLY

A Year of Market Fear — and Resilience: Breaking Down the VIX in 2025
Revisit the major volatility catalysts of 2025 to gain insight into what new ones could be in store next year....
READ MORE
MEMBERS ONLY

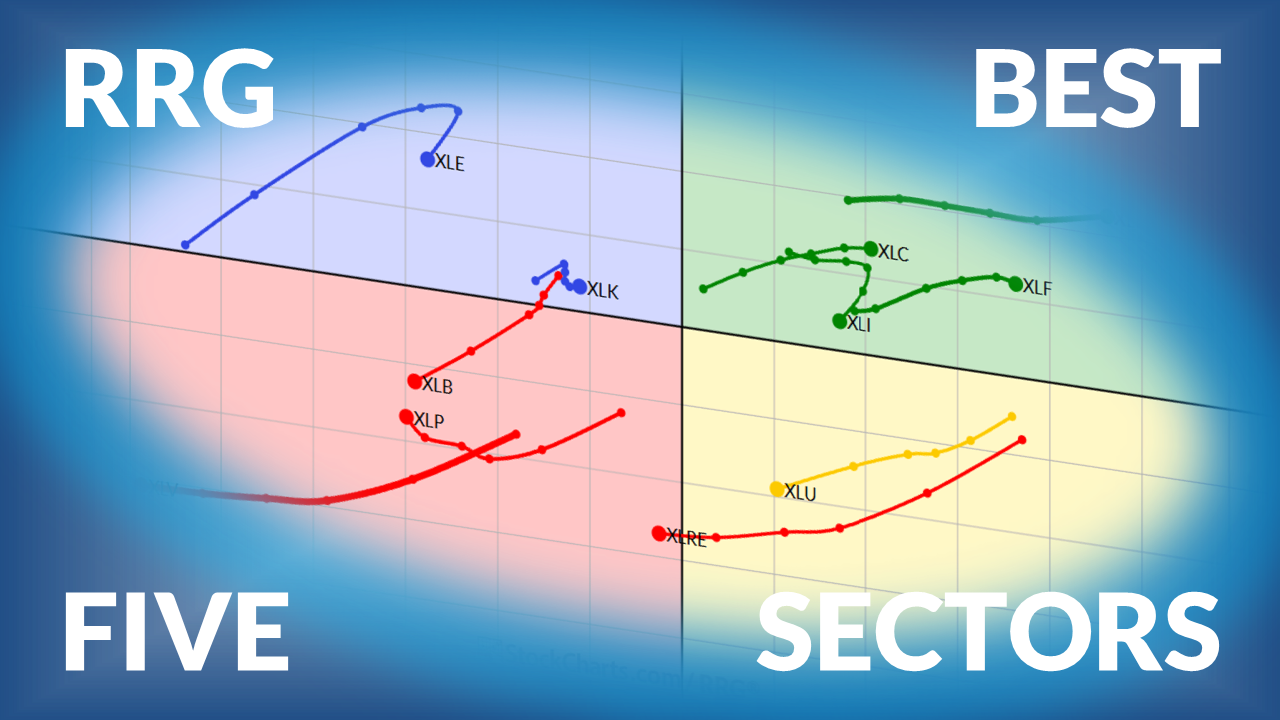
The Best Five Sectors This Week, #50
by Julius de Kempenaer,
Senior Technical Analyst, StockCharts.com
Weekly Sector Rotation Update for US Sectors based on Relative Rotation Graphs...
READ MORE
MEMBERS ONLY
Consolidation Continues: Nifty Awaits Trigger for Directional Move
by Milan Vaishnav,
Founder and Technical Analyst, EquityResearch.asia and ChartWizard.ae
With the Nifty now in a sideways consolidation, what will it take to reignite upward momentum? And what does the truncated week ahead look like for the Indian market?...
READ MORE
MEMBERS ONLY

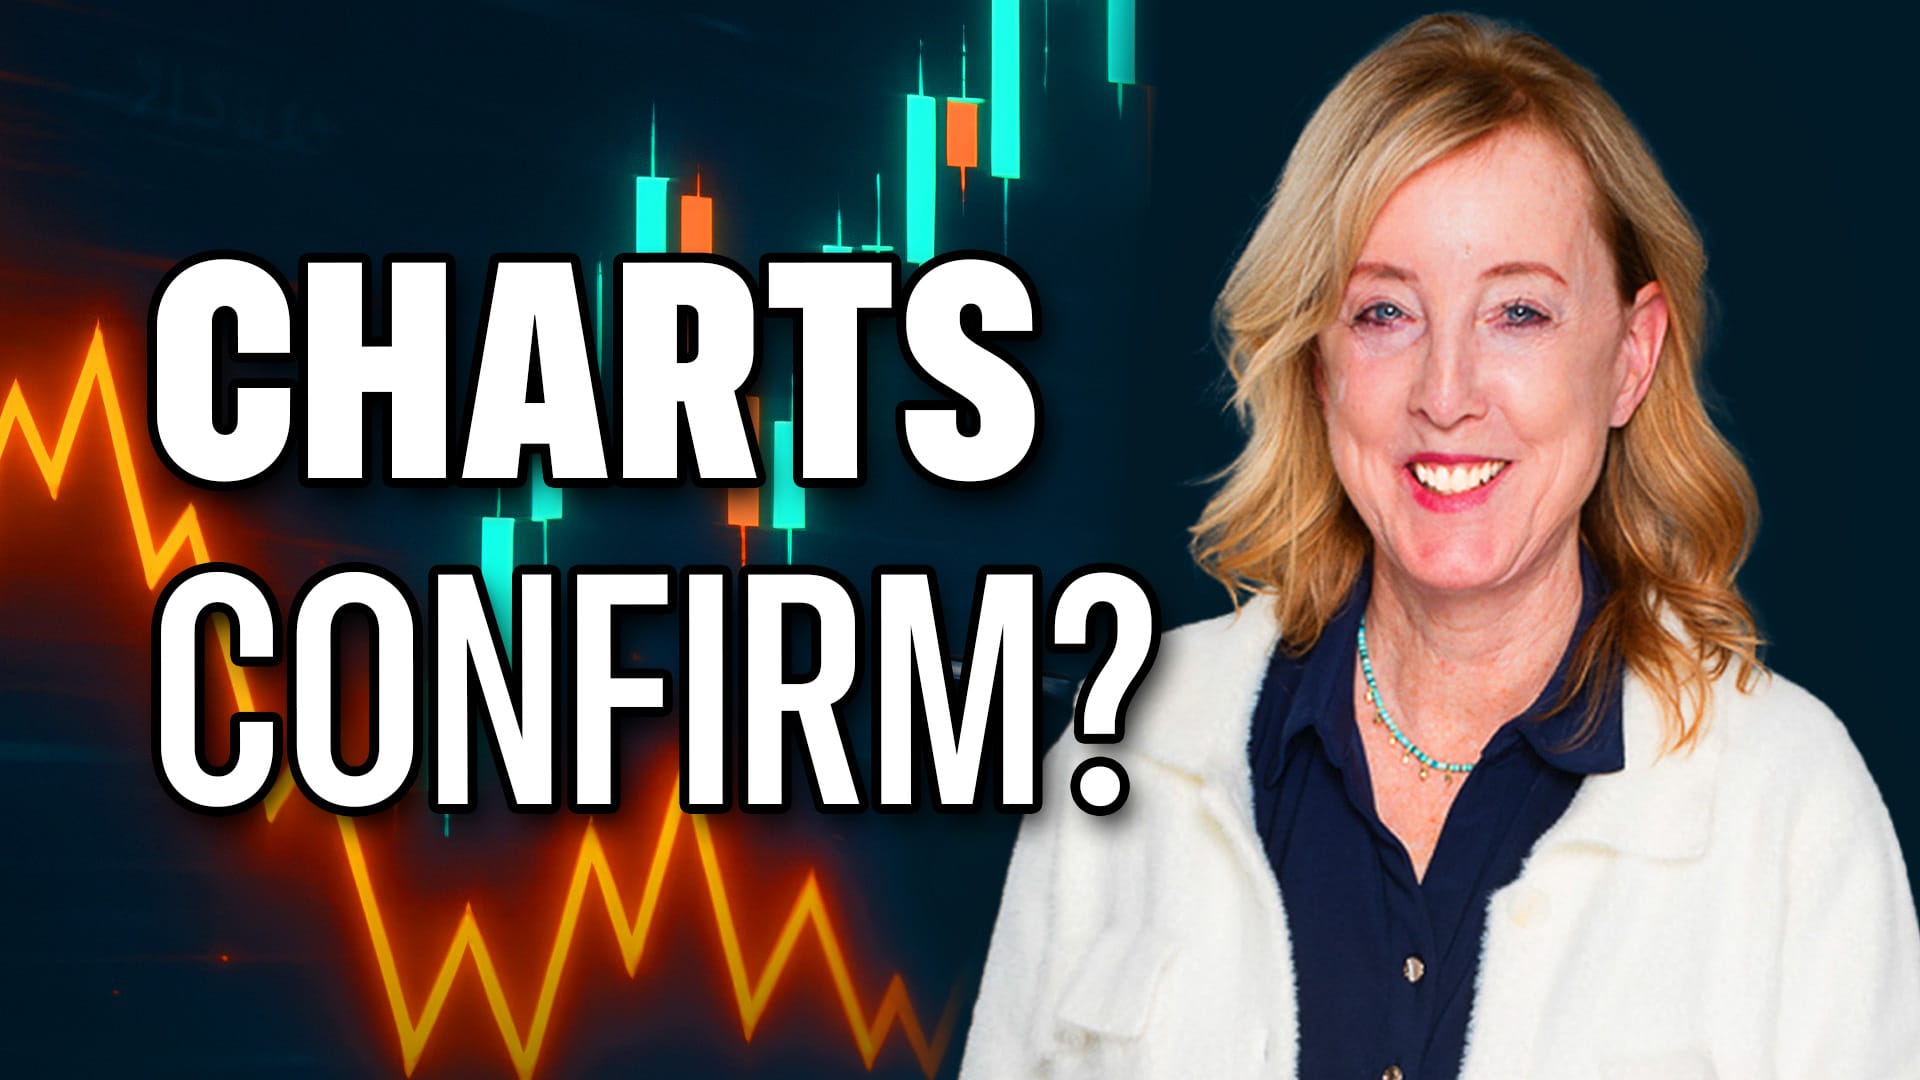
J.P. Morgan's Top Picks for 2026: A Closer Look at the Charts

by Mary Ellen McGonagle,
President, MEM Investment Research
Mary Ellen McGonagle takes a close look at some seminconductor and networking names that J.P. Morgan has ranked as top picks for the new year. What are her thoughts?...
READ MORE
MEMBERS ONLY
Turn Market Noise into Opportunity with Stock and ETF Scans
by Jayanthi Gopalakrishnan,
Director of Site Content, StockCharts.com
The last full trading week of the year is behind us, and what a year it’s been. We’ve seen long, steady rallies, sharp pullbacks, and plenty of choppy, sideways action along the way. Throughout it all, 2025 reminded us just how dynamic and unpredictable the market can be....
READ MORE
MEMBERS ONLY

Three Investing Lessons from a Challenging 2025 Market

by David Keller,
President and Chief Strategist, Sierra Alpha Research
After a challenging and highly rotational 2025, Dave Keller, CMT, shares three key investing lessons, from focusing on process over prediction to recognizing leadership shifts beneath the surface. Learn how investors can better prepare for market opportunities in 2026....
READ MORE
MEMBERS ONLY

Is a Santa Claus Rally Starting to Take Shape?
by Mary Ellen McGonagle,
President, MEM Investment Research
Mary Ellen analyzes a notable shift in the markets, how to capitalize, and what it might mean for the fabled Santa Claus Rally....
READ MORE
MEMBERS ONLY
2025 Market Recap & 2026 Outlook: Trends, Psychology, and What Comes Next

by Grayson Roze,
Chief Strategist, StockCharts.com
by David Keller,
President and Chief Strategist, Sierra Alpha Research
Grayson and Dave give their year-end thoughts about the wild market action of 2025, what worked (or not) for traders over the course of the year, and what lessons to take for 2026. ...
READ MORE
MEMBERS ONLY
Semiconductors Crumble; Big Warning Signs Flashing!

by Tom Bowley,
Chief Market Strategist, EarningsBeats.com
Tom looks at the last week's market action and what it means for bulls....
READ MORE
MEMBERS ONLY

What Is The Crypto Selloff Telling Us About Stocks?
by Tom Bowley,
Chief Market Strategist, EarningsBeats.com
Bitcoin and the S&P 500 often move in tandem, but when they move in opposite directions, it's time to pay attention. Find out what Tom Bowley's analysis reveals about Bitcoin signaling an early warning....
READ MORE
MEMBERS ONLY

To Be Invested or Not to be Invested? That is the Question

by Arthur Hill,
Chief Technical Strategist, TrendInvestorPro.com
These three indicators will filter out the noise and identify whether the stock market is bullish or bearish. This, in turn, will help you determine whether you should remain invested or not. Explore these indicators and find out which key levels to watch....
READ MORE
MEMBERS ONLY

Stocks Showing Early Market Rotation Using Relative Strength

by Joe Rabil,
President, Rabil Stock Research
Joe Rabil of Rabil Stock Research looks at stocks rotating after a long bearish, discusses the prospects of a Santa Claus rally, and breaks down viewer-requested stocks....
READ MORE
MEMBERS ONLY

Calm Markets, Crude Chaos: Why Oil Is the Odd One Out This Holiday Season
While equities have remained relatively calm during this holiday season, oil prices have been under pressure. Even as energy stocks are performing better than crude, the overall trend remains bearish....
READ MORE
MEMBERS ONLY

Two Markets That Could Be Influenced by a Peace Settlement in Ukraine
by Martin Pring,
President, Pring Research
Martin Pring analyzes the two areas that could see a significant upside move if a peace settlement in the conflict in Ukraine is reached....
READ MORE
MEMBERS ONLY

Change of Character: Spotting the Shift From Downtrend to Uptrend
by David Keller,
President and Chief Strategist, Sierra Alpha Research
David Keller explains how to spot when a stock transitions from distribution to accumulation, and how you can use scanning, alerts, and scheduled scans to find the next breakout....
READ MORE
MEMBERS ONLY

StockCharts Insider: John Murphy’s Law #11 - Keep At It (The Hidden Curriculum of Technical Analysis)
by Karl Montevirgen,
The StockCharts Insider
Before We Dive In…
John Murphy’s unofficial Law #11 (“Keep at it”) can easily be misread as a motivational statement or a clichéd “self-help” line. But if you read it closely, it may be the most technical law of them all. How so? It doesn’t explain a...
READ MORE
MEMBERS ONLY
The Best Five Sectors This Week, #49
by Julius de Kempenaer,
Senior Technical Analyst, StockCharts.com
Weekly update on U.S. sector rotation using Relative Rotation Graphs....
READ MORE
MEMBERS ONLY

If Value Is Really Back, These Two Stocks Will Tell Us First
Value stocks are showing signs of strength, but it will take strength from sectors such as Energy and Financials to push this asset group higher. Learn about which charts could provide clues on the value vs. growth trade. ...
READ MORE
MEMBERS ONLY

Critical Week Ahead: Can Nifty Push Past Resistance?
by Milan Vaishnav,
Founder and Technical Analyst, EquityResearch.asia and ChartWizard.ae
The broader structure of the Nifty remains bullish, but the index is navigating a key inflection zone. Will the next week extend the trend?...
READ MORE
MEMBERS ONLY
Too Many Stocks, Not Enough Clarity? Let’s Get Organized
by Jayanthi Gopalakrishnan,
Director of Site Content, StockCharts.com
We hope you’ve had a chance to customize your dashboard and spend a little time with the Market Summary page since last week. Even a few minutes a day can make a big difference in how connected you feel to the market!
If this past week reminded us of...
READ MORE
MEMBERS ONLY

Is the S&P 500 Stuck in Neutral? A Traffic Light Approach to Trend Changes
by David Keller,
President and Chief Strategist, Sierra Alpha Research
Since the April low, the S&P 500 has shifted from a strong uptrend into a clear consolidation. Dave Keller, CMT, introduces a “traffic light” charting technique to define key support and resistance levels—and spot when sideways markets finally break into accumulation or distribution....
READ MORE
MEMBERS ONLY
Is This Rally for Real? Here's What the Charts Are Saying
by Mary Ellen McGonagle,
President, MEM Investment Research
Mary Ellen McGonagle breaks down the current market rally and examines whether expanding participation and sector movement are confirming the move. Discover what market breadth, equal-weight indexes, and sector charts are revealing beneath the surface....
READ MORE
MEMBERS ONLY

Will Semiconductors Be A Problem in 2026?
by Tom Bowley,
Chief Market Strategist, EarningsBeats.com
Are semiconductors due for a correction? Tom Bowley analyzes the longer-term chart of the Dow Jones US Semiconductors Index. Find out what his analysis reveals....
READ MORE
MEMBERS ONLY

How to Generate Weekly Income with Options — Fast and Smart!

by Tony Zhang,
Chief Strategist, OptionsPlay
Tony Zhang reveals how to generate consistent weekly income with smart options strategies. Learn how to scan for the highest-yielding cover calls, cash-secured puts, and spreads using StockCharts’ OptionsPlay Strategy Center....
READ MORE
MEMBERS ONLY

Using Trend Signals and Oversold Conditions to Get a Jump on the Breakout
by Arthur Hill,
Chief Technical Strategist, TrendInvestorPro.com
If you're looking to get in early on a breakout, first identify the uptrend and then find oversold setups. Arthur Hill walks you through how to look for the ideal setups....
READ MORE
MEMBERS ONLY
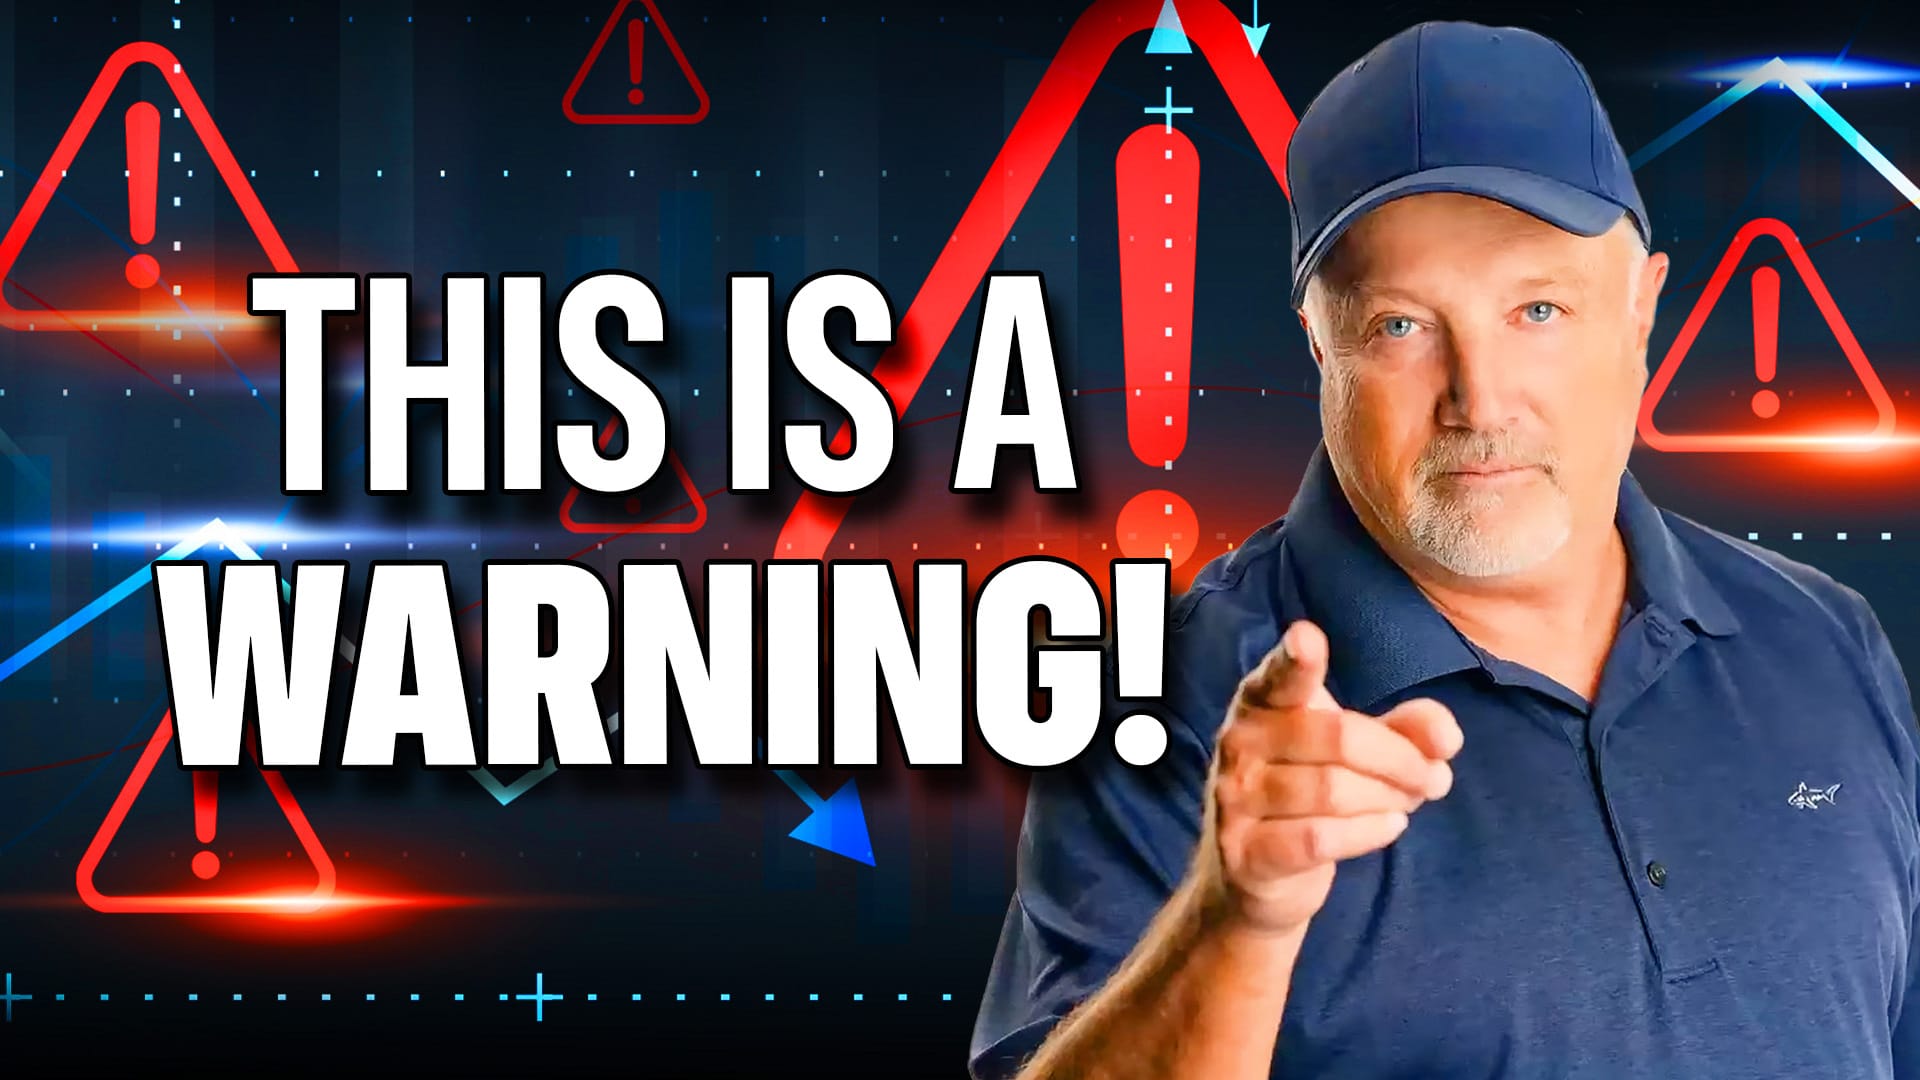
The Rotation No One Wants to Talk About — And Why It’s a Warning
by Tom Bowley,
Chief Market Strategist, EarningsBeats.com
Money is rotating sharply out of large-cap growth and into areas like small caps, transports, and regional banks. Tom Bowley of EarningsBeats explains why that shift matters, breaking down the signals raising caution and the five stocks showing standout strength as the market resets....
READ MORE
MEMBERS ONLY

StockCharts Insider: John Murphy’s Law #10 — Know the Confirming Signs (Volume)
by Karl Montevirgen,
The StockCharts Insider
Before We Dive In…
Price can advance a bullish or bearish argument. But volume reveals the true conviction behind the case. That’s the core of John Murphy’s Law #10. A rally that isn’t attracting buyers? A selloff nobody’s committing to? A breakout nobody cares about? Those...
READ MORE
MEMBERS ONLY

A Stock Market Rally With a Twist: What's Strengthening and What's Cracking?
by Jayanthi Gopalakrishnan,
Director of Site Content, StockCharts.com
The Fed cut sparked new life in the stock market. See which sectors broke out, where weakness remains, and what it means for investors....
READ MORE
MEMBERS ONLY

Hedge Funds AND Mutual Funds Picked These 6 Stocks — Should You?
by David Keller,
President and Chief Strategist, Sierra Alpha Research
Dave Keller, CMT reviews six stocks that appeared on both hedge fund and mutual fund “shared favorites” lists in a recent Goldman Sachs study. He evaluates each using StockCharts tools, revealing which setups still show strength and which may be flashing warning signs....
READ MORE
MEMBERS ONLY
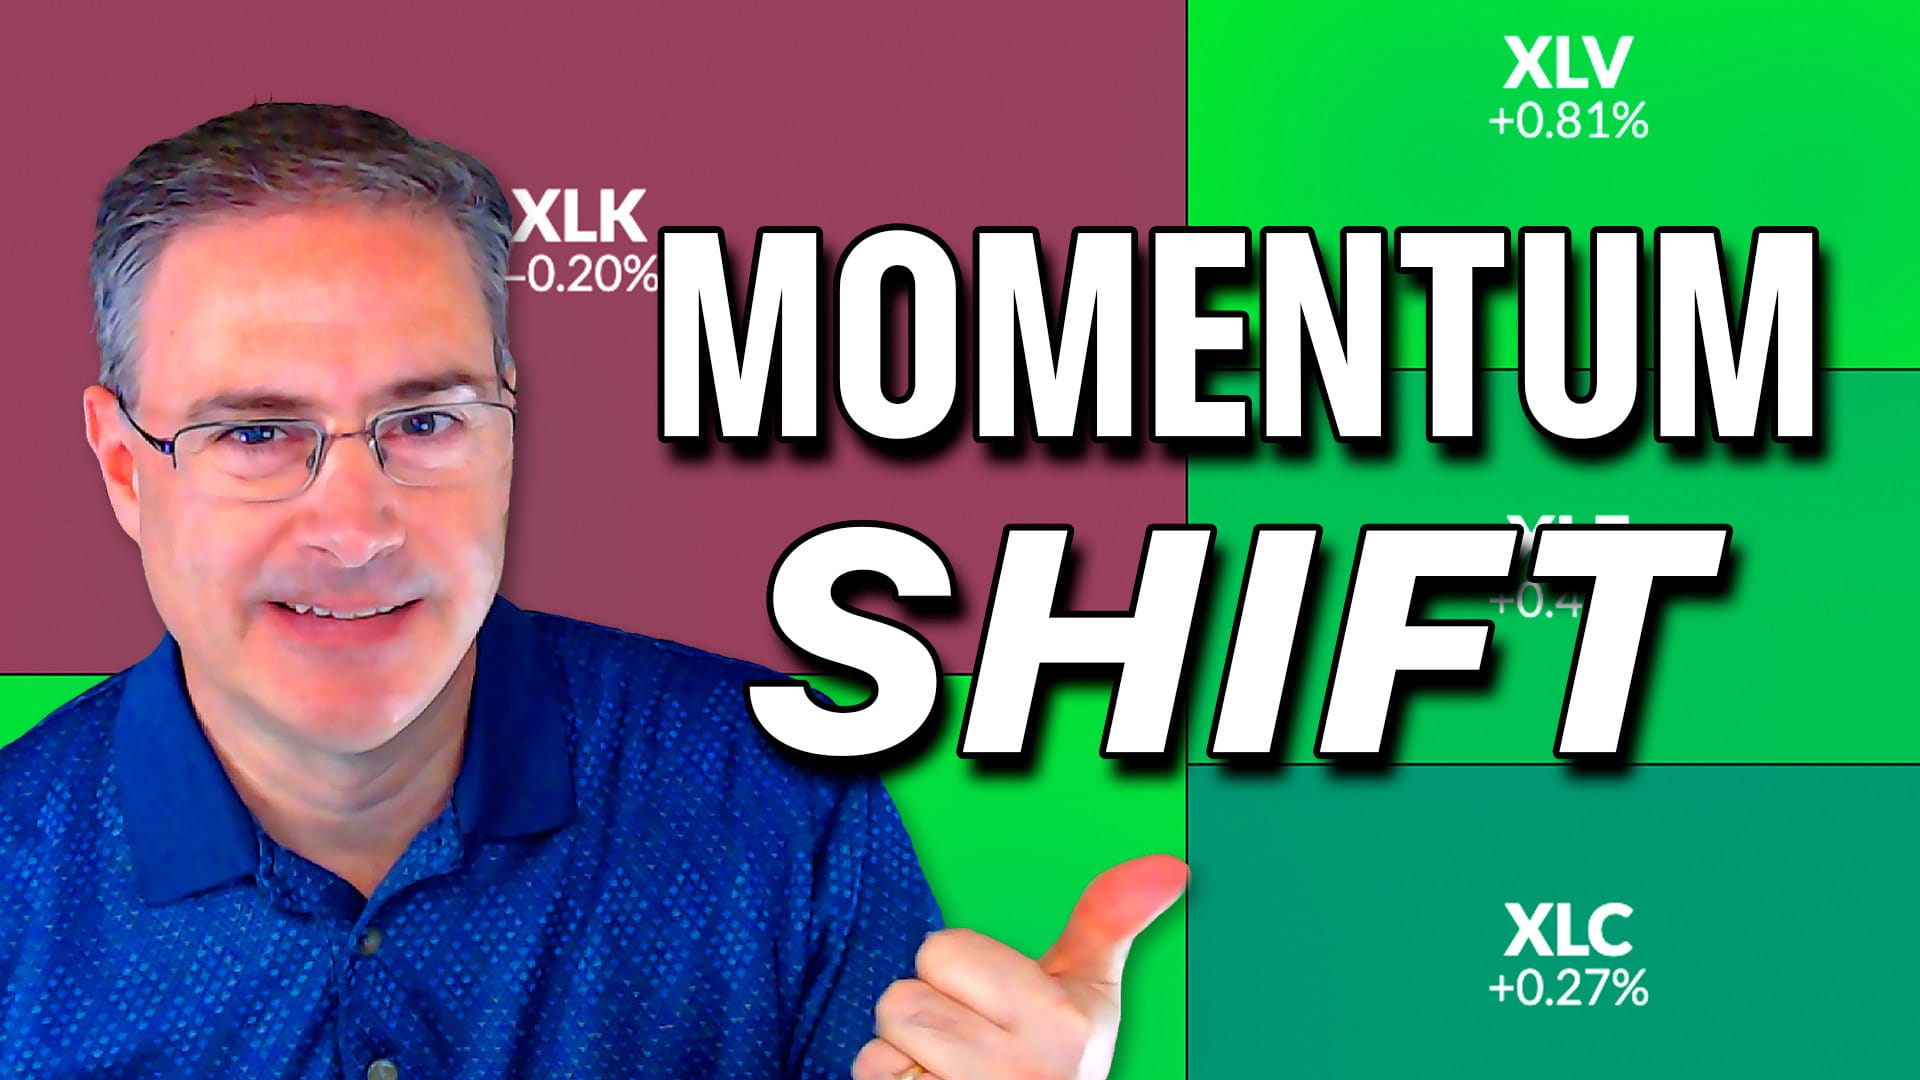
Momentum Shift Starting — These Sectors Are Waking Up
by Joe Rabil,
President, Rabil Stock Research
Joe Rabil of Rabil Stock Research highlights a momentum shift taking shape across sectors, showing which ones are beginning to wake up as 2026 begins. He also reviews the S&P 500, market conditions, and individual stock setups showing improving structure and momentum....
READ MORE