MEMBERS ONLY
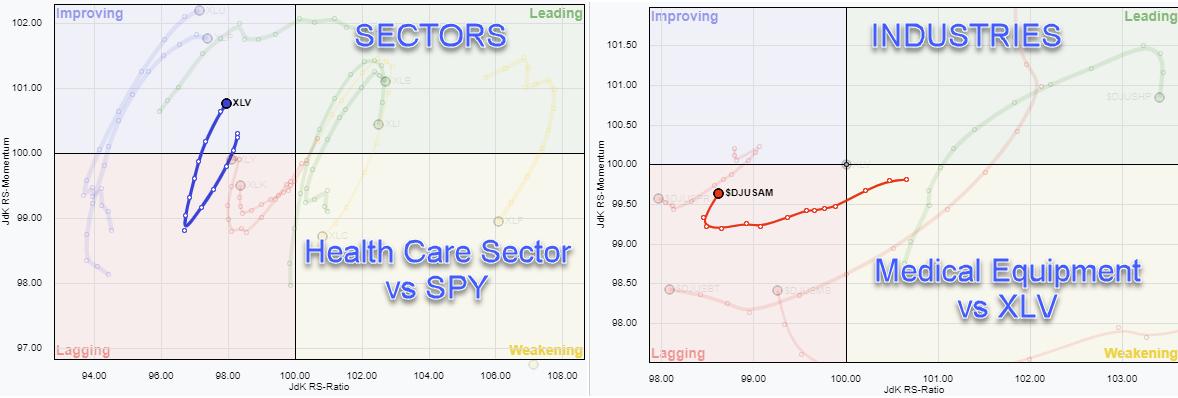
From Sector to Industry to Agilent Technologies

by Julius de Kempenaer,
Senior Technical Analyst, StockCharts.com
The Health Care sector is one of the defensive sectors in the S&P 500 which is on a positive trajectory inside the improving quadrant and heading towards leading. The RRG for sectors, highlighting XLV, is on the left above.
The RRG on the right shows the industries inside...
READ MORE
MEMBERS ONLY
Chartwise Women: AMC & More Movie Star Stocks

by Mary Ellen McGonagle,
President, MEM Investment Research

by Erin Swenlin,
Vice President, DecisionPoint.com
In this week's edition of Chartwise Women, Erin and Mary Ellen take a trip to the movies! Of course, they have to look at AMC since it was "movie day", but they also share numerous stocks that you should consider for "starring roles" in...
READ MORE
MEMBERS ONLY

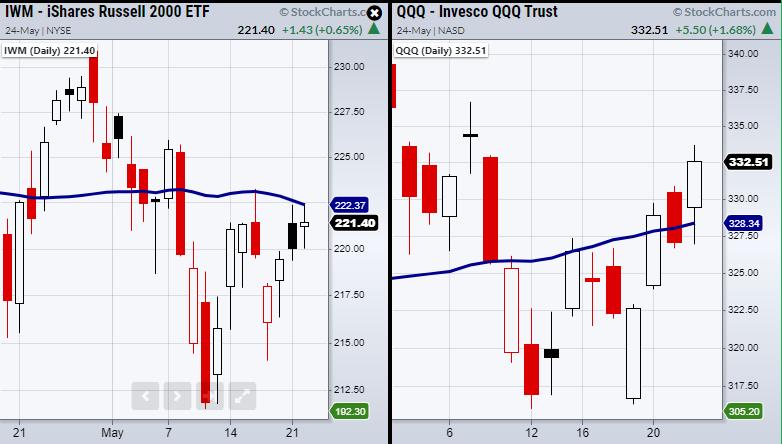
Finally Russell 2000 -- But Can You Confirm?
For the past couple of weeks, the Russell 2000 (IWM) has been a major focus for traders and investors that have been cautious, given the struggle IWM has gone through in its current trading range. Now it has cleared its pivotal 50-day moving average at $221.96 and looks to...
READ MORE
MEMBERS ONLY

17 Secrets to Trading, Part 2

by Dave Landry,
Founder, Sentive Trading, LLC
In this edition of Trading Simplified, Dave starts the show by covering three mystery charts, then continues his discussion on "Trading Secrets". Topics in this video include making decisions, emotions in trading, gaining experience and going with the flow of the market.
This video was originally broadcast on...
READ MORE
MEMBERS ONLY

PULLBACK IN BOND YIELDS MAY BE BOOSTING TECH STOCKS AND NASDAQ -- YIELD PULLBACK, HOWEVER, MAY BE TEMPORARY

by John Murphy,
Chief Technical Analyst, StockCharts.com
10-YEAR YIELD PULLS BACK... Despite all the talk about accelerating inflation, bond yields have been pulling back of late. The daily bars in Chart 1 show the 10-Year Treasury yield falling to the lowest level in three weeks and trading below its 50-day moving average. The TNX set a 52-week...
READ MORE
MEMBERS ONLY
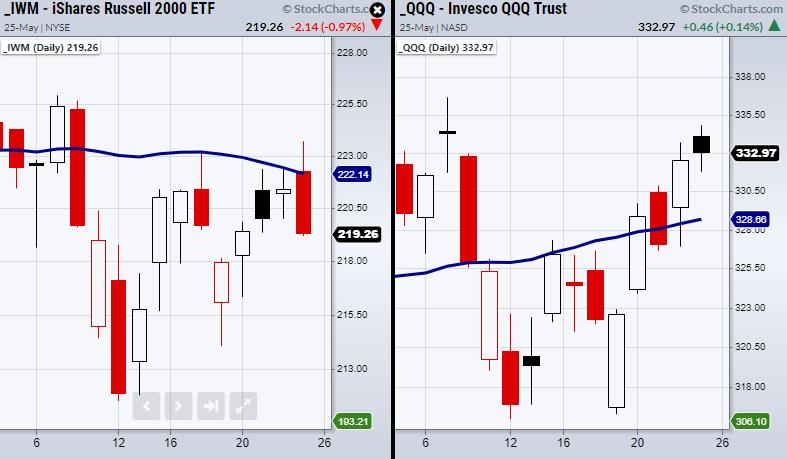
Why the Russell 2000 (IWM) Needs to Clear $222.14
For the third time, the small-cap index Russell 2000 (IWM) has failed to clear its 50-day moving average. It is the last of the four major indices to lag as, on Monday, the Nasdaq 100 (QQQ) cleared and has since held over its 50-DMA for a second day. This confirmed...
READ MORE
MEMBERS ONLY

Sector Spotlight: Rotation to Defense Continues
by Julius de Kempenaer,
Senior Technical Analyst, StockCharts.com
On this edition of StockCharts TV's Sector Spotlight, I highlight the rotations in asset classes and US sectors as they played out last week and then put things into a longer-term perspective. The warning signals that already popped up over the last few weeks are persisting. In today&...
READ MORE
MEMBERS ONLY
Three Key Lines for Three Key Charts

by David Keller,
President and Chief Strategist, Sierra Alpha Research
As I go through my normal routine of analyzing hundreds of charts every day, or when I'm preparing for my daily closing bell show, I often focus on the "line in the sand" for each chart. That is, what's the point at which you...
READ MORE
MEMBERS ONLY
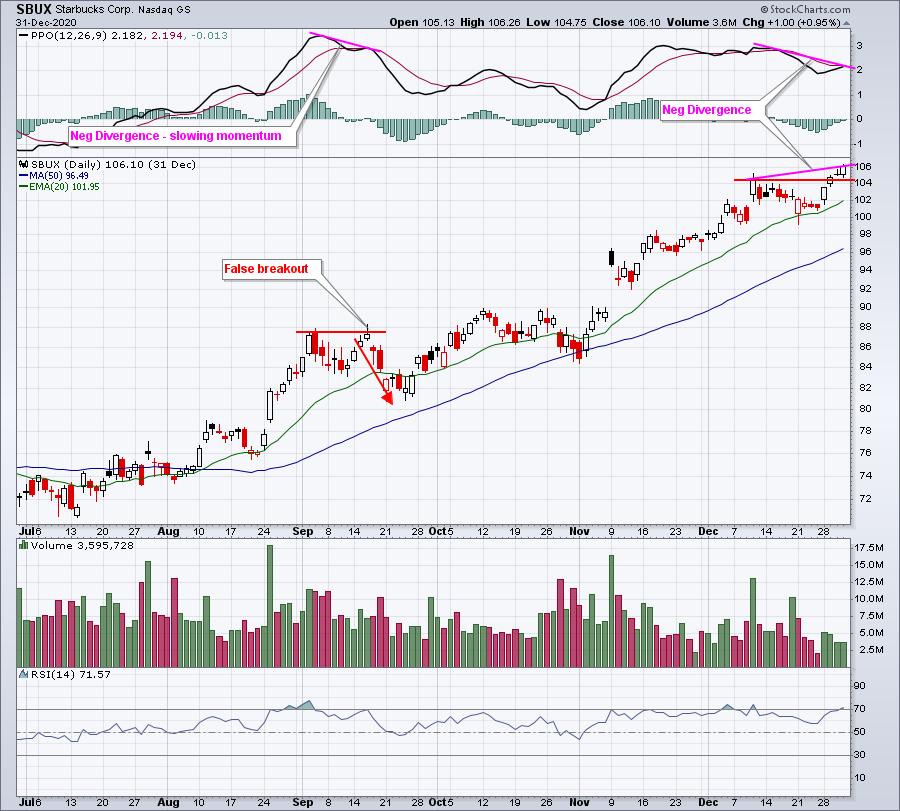
Breakouts: Deciphering the Good from the Bad

by Tom Bowley,
Chief Market Strategist, EarningsBeats.com
From a long-term perspective, it's hard to imagine that it's a bad thing for your stock to be setting a fresh 52-week or all-time high. But from a short-term trader's perspective, there could be a world of difference. Two keys are the candlestick and...
READ MORE
MEMBERS ONLY

DP TV: Short-Term Bullish!
by Erin Swenlin,
Vice President, DecisionPoint.com

by Carl Swenlin,
President and Founder, DecisionPoint.com
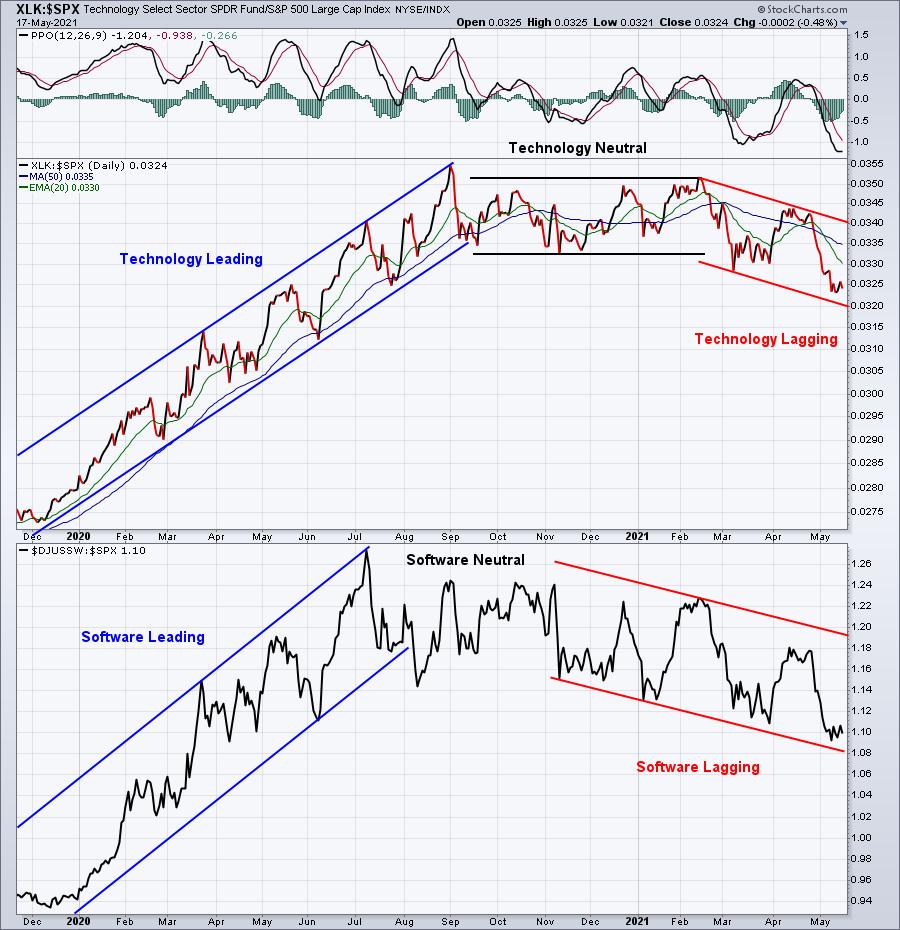
In this episode of DecisionPoint, the DecisionPoint indicators have Carl and Erin in a short-term bullish position. Watch to see why! Erin reviews the Technology sector and focuses in on Semiconductors and Software, two areas that are profiting from the current bullish bias in market. She offers up THREE Diamonds...
READ MORE
MEMBERS ONLY
Can Big Tech Lead the Market Higher?
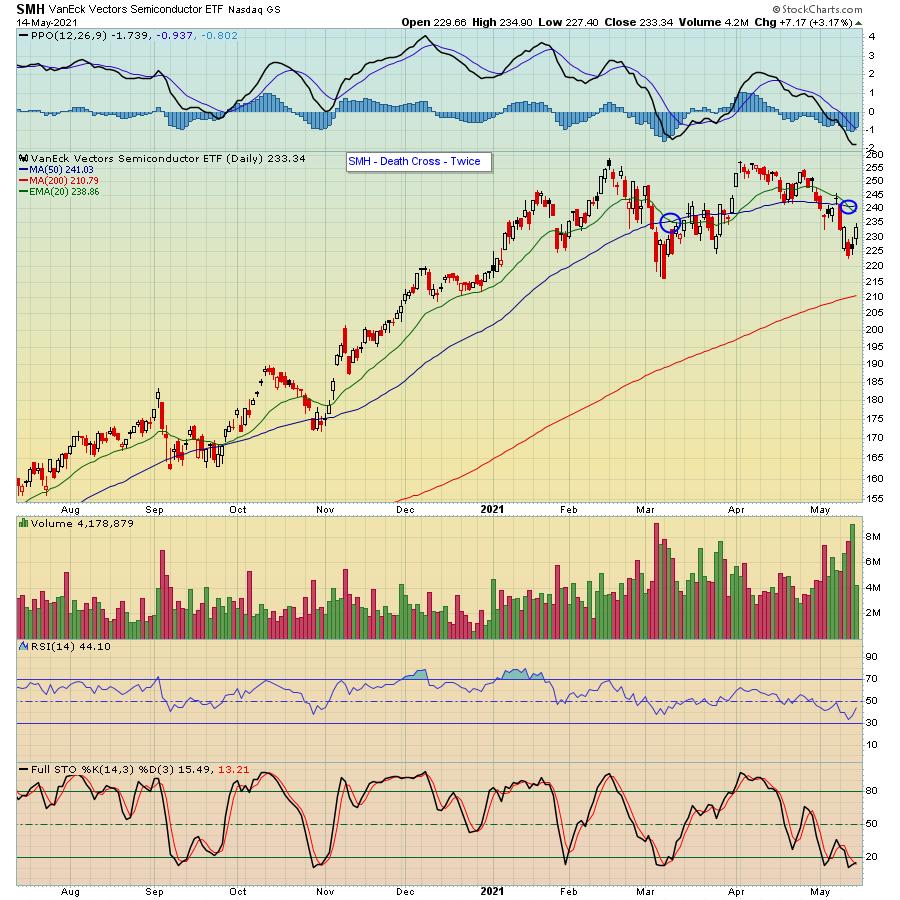
On Monday, the Semiconductors ETF (SMH) cleared back over resistance from its 50-day moving average at $242.07. Additionally, the tech-heavy Nasdaq 100 (QQQ) cleared its 50-DMA. The next test is for both symbols to hold their MAs as support for Tuesday's trading session. Because both have consolidation...
READ MORE
MEMBERS ONLY
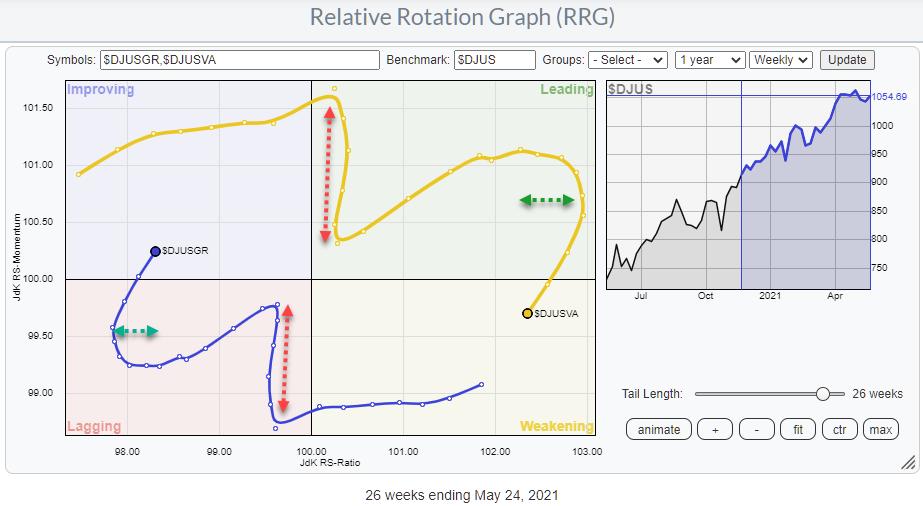
Value to Growth Rotation is Slowing Down
by Julius de Kempenaer,
Senior Technical Analyst, StockCharts.com
The Big Growth to Value Rotation, which has been going on for months, seems to be slowing down. NOT REVERSING, yet, but slowing down!
In the RRG Long/Short baskets, we have IVE on the Long side and IVW on the Short side since September 2020. Looking at the RRG...
READ MORE
MEMBERS ONLY

Gold, Silver the 200-day and Realistic Expectations

by Arthur Hill,
Chief Technical Strategist, TrendInvestorPro.com
The Gold SPDR (GLD) crossed above its 200-day EMA in early May and its 200-day SMA this past week. Both signals are "bullish" and point to a long-term uptrend, but tell us little regarding realistic expectations going forward. To get a better understanding, we need to know which...
READ MORE
MEMBERS ONLY

Week Ahead: Chase Momentum Selectively; RRG Chart Shows One More Defensive Sector Rolling Inside the Leading Quadrant

by Milan Vaishnav,
Founder and Technical Analyst, EquityResearch.asia and ChartWizard.ae
Despite intermittent hiccups in between, the past week stayed much better than expected for the Indian markets. The NIFTY not only averted the bearish consequence of the violation of the rising trend line, but it also went on to end the week while posting decent gains. As compared to the...
READ MORE
MEMBERS ONLY
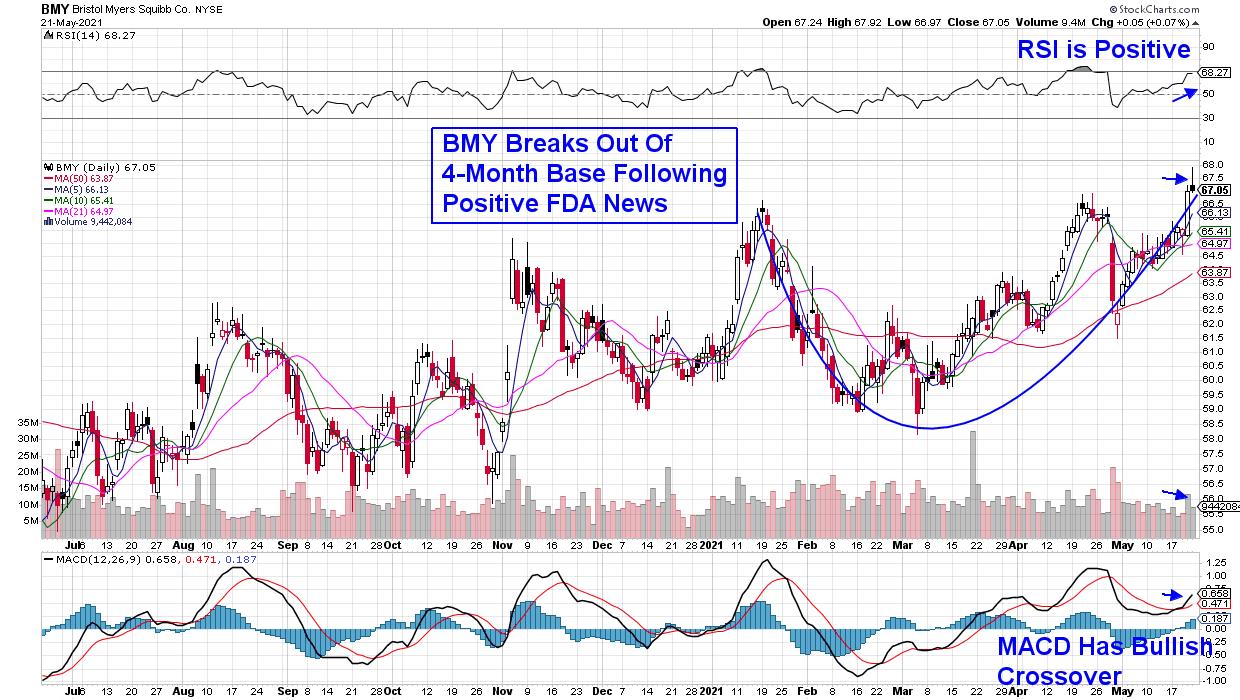
These Stocks Can Provide Stability and a Lot More During These Tricky Times
by Mary Ellen McGonagle,
President, MEM Investment Research
I don't have to tell you it's been tough for most investors to make headway in the markets this month. We're navigating a landscape that's never before been traveled. With government stimulus triple the Great Recession and sharp economic growth with pandemic...
READ MORE
MEMBERS ONLY
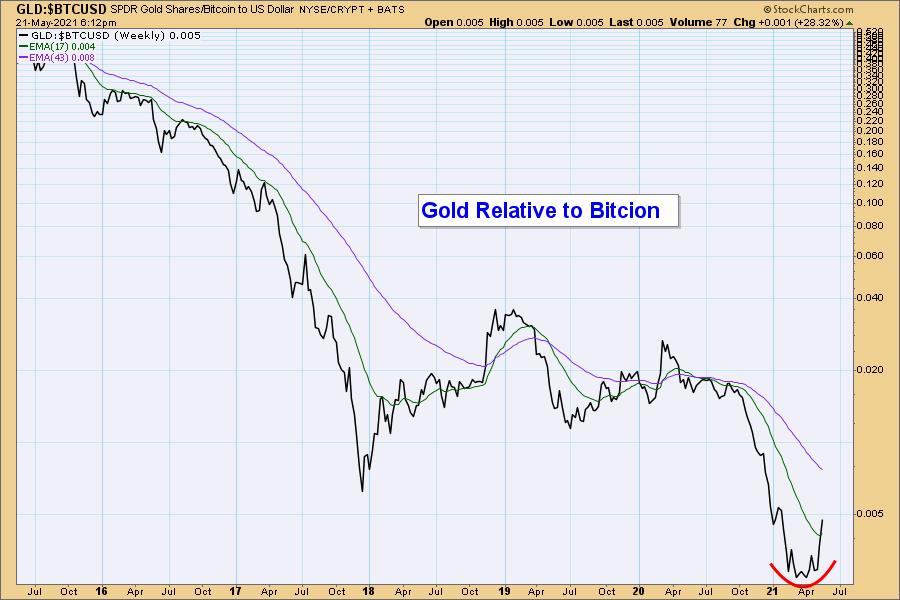
Will Gold Continue to Strengthen Versus Cryptos?
by Carl Swenlin,
President and Founder, DecisionPoint.com
This is an excerpt from today's subscriber-only "DecisionPoint Weekly Wrap":
It has long been our belief that gold should be doing a lot better, considering the reckless spending and borrowing that is currently in progress. We have also believed that billions of dollars being diverted into...
READ MORE
MEMBERS ONLY

Which Way are the Markets Headed?
by Mary Ellen McGonagle,
President, MEM Investment Research
In this episode of StockCharts TV'sThe MEM Edge, Mary Ellen shares top candidates that are defensive, as well as recovery plays. She also highlights new areas that are reversing lengthy downtrends and, lastly, headline stocks due to report earnings next week.
This video was originally recorded on May...
READ MORE
MEMBERS ONLY
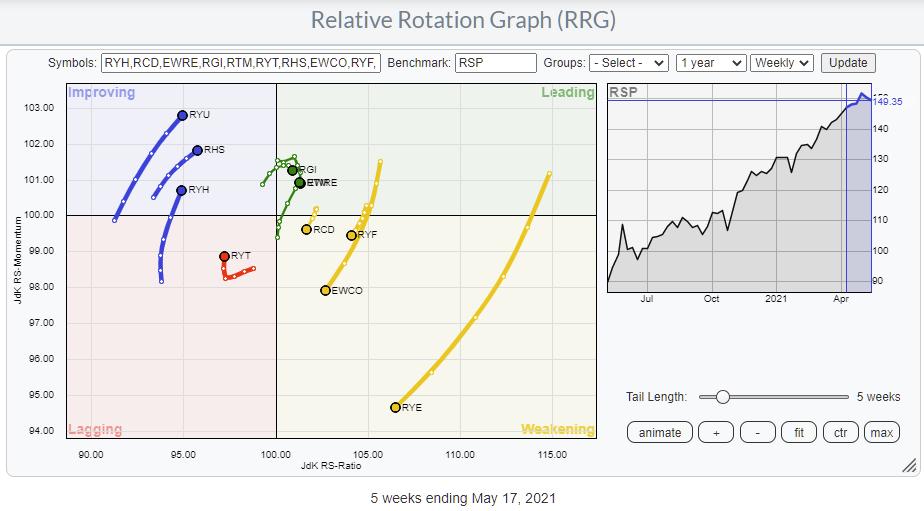
Is Equal-Weight Really Equal Weight When it Comes to Sectors?
by Julius de Kempenaer,
Senior Technical Analyst, StockCharts.com
The Relative Rotation Graph shows the rotation of the Invesco family of equal-weight ETFs. These sector ETFs are often used to eliminate the dominating weight of some individual stocks in specific sectors. Think AAPL and MSFT in Technology, AMZN and (to a lesser extent) TSLA in Consumer Discretionary and FB...
READ MORE
MEMBERS ONLY
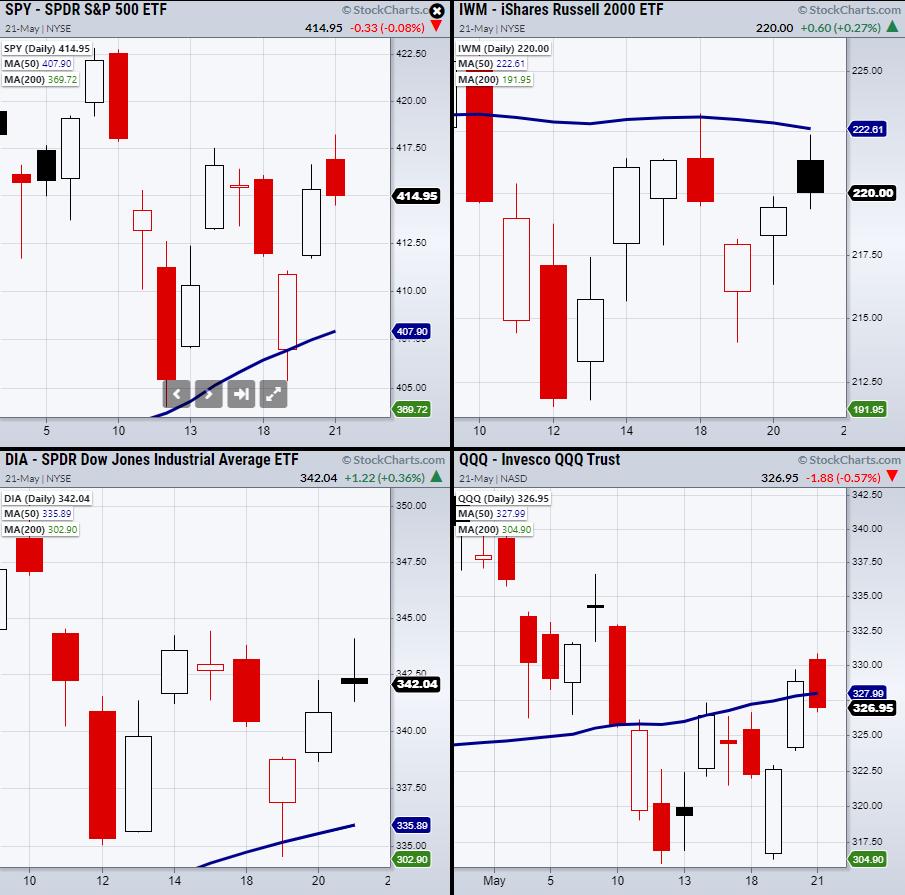
Will Monday Settle the Stock Market Divide?
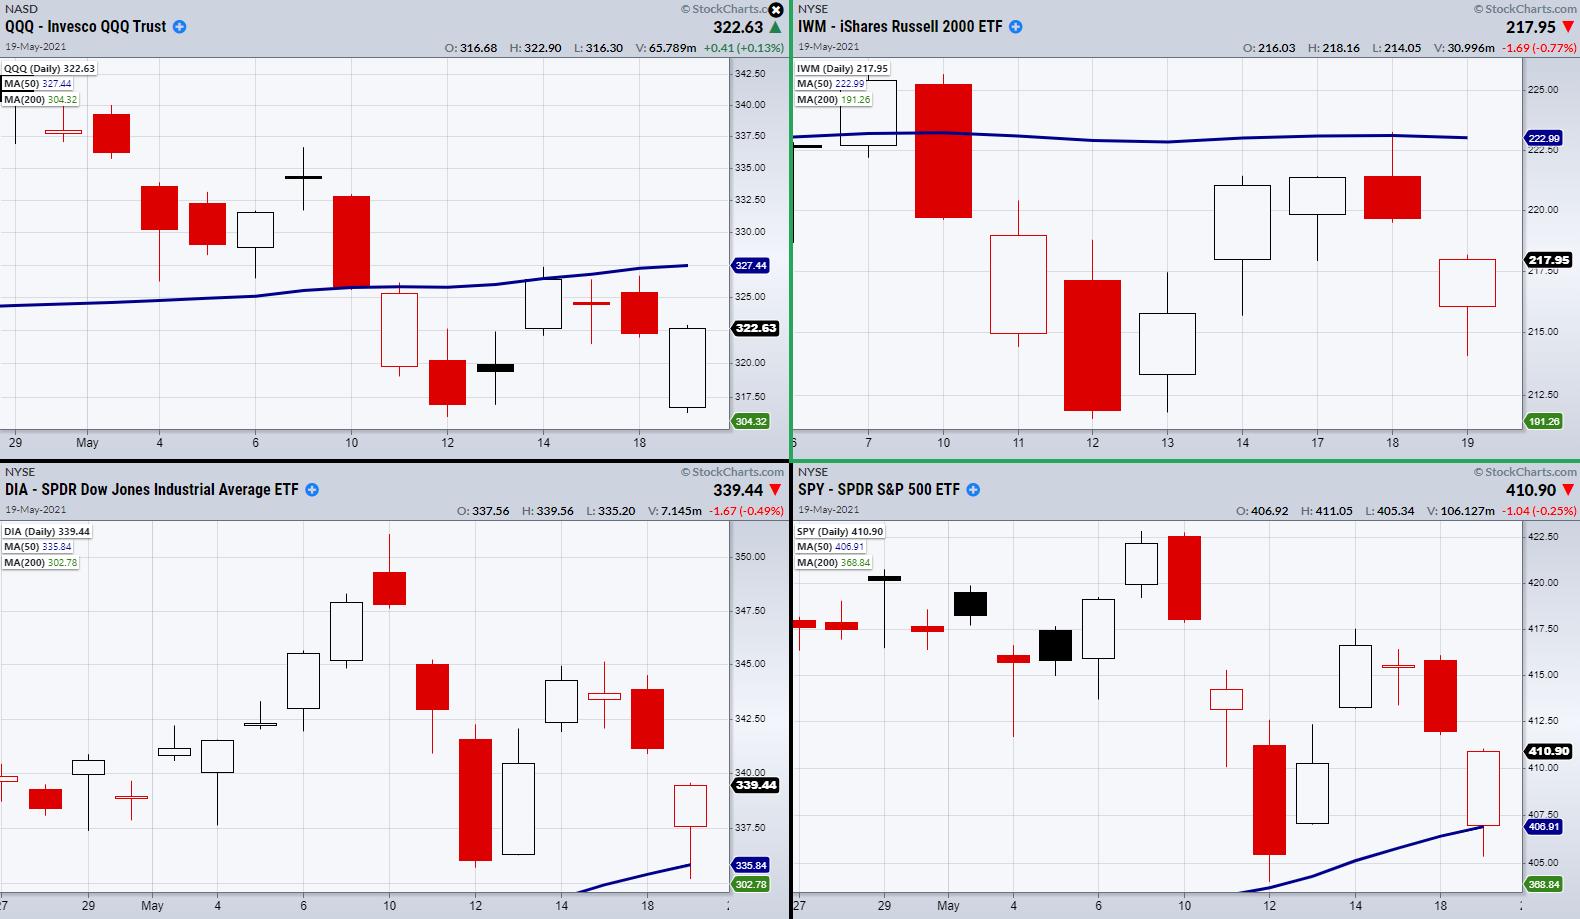
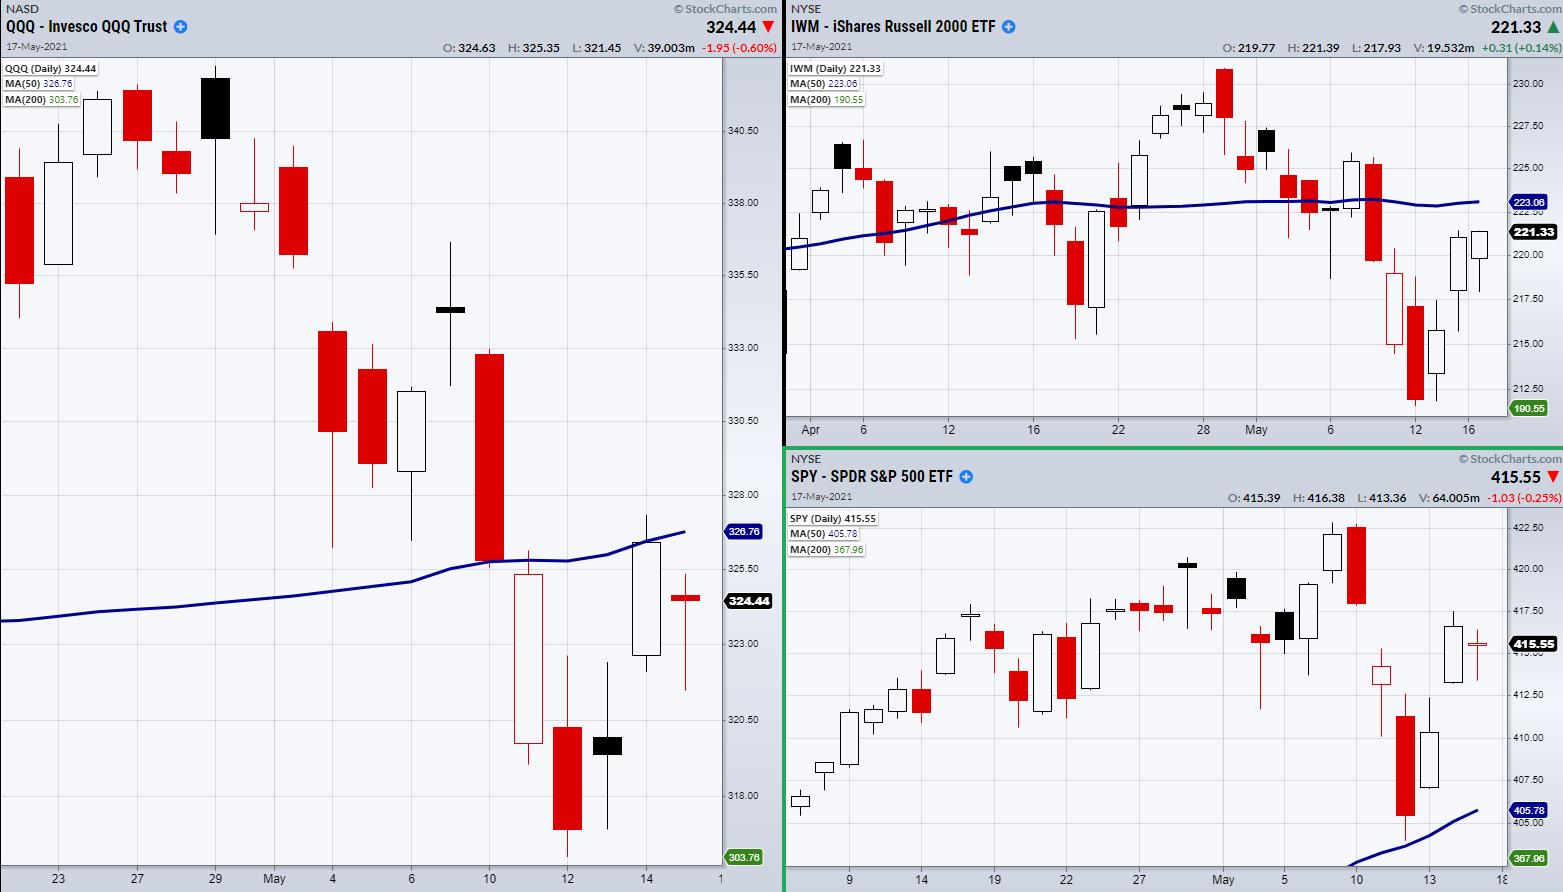
The four major indices are split between two phases.
The first is a bullish phase. This is created when the price of a symbol is trading over its 50-day moving average, with the 50-DMA over the 200-DMA. Both the Dow Jones (DIA) and the S&P 500 (SPY) are...
READ MORE
MEMBERS ONLY

MONTHLY AND WEEKLY SECTOR RANKINGS HELP FIND LEADERS AND LAGGARDS -- THE VALUE/GROWTH RATIO STILL FAVORS VALUE STOCKS
by John Murphy,
Chief Technical Analyst, StockCharts.com
MONTHLY RANKINGS... Major stock indexes are ending the week with little change. The Dow and S&P 500 show a modest loss while the Nasdaq is showing a minor gain. To get a better sense of what's moving the market, a look at sector rankings can offer...
READ MORE
MEMBERS ONLY
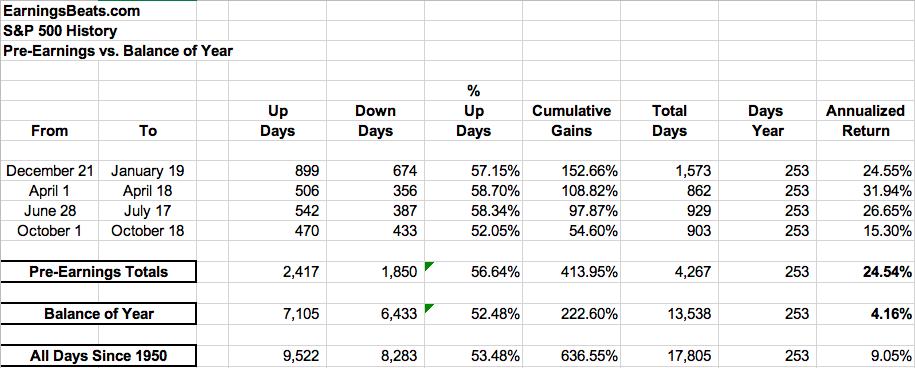
Wall Street Doesn't Want You to See These S&P 500 Performance Numbers
by Tom Bowley,
Chief Market Strategist, EarningsBeats.com
The stock market has a history of running higher in anticipation of earnings season. On the S&P 500, for instance, here are the annualized returns for the following periods since 1950:
This is 71 years of daily data, which is certainly statistically relevant. I don't believe...
READ MORE
MEMBERS ONLY
Chartwise Women: Bullish Signals in YTD Losers
by Mary Ellen McGonagle,
President, MEM Investment Research
by Erin Swenlin,
Vice President, DecisionPoint.com
In this week's edition of Chartwise Women, Mary Ellen and Erin review downtrend reversals taking place among many down-and-out stocks. They also share key signals that an uptrend has legs, as well as what to look out for in the way of upside resistance.
This video was originally...
READ MORE
MEMBERS ONLY
A Long Tail on Utilities Signals Power for Defense
by Julius de Kempenaer,
Senior Technical Analyst, StockCharts.com
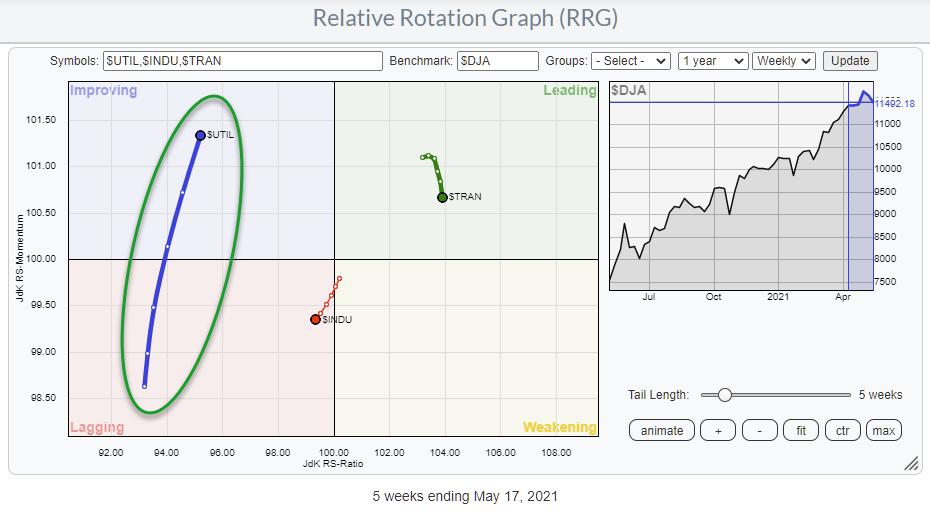
A great way to keep an eye on offense vs. defense is using the Relative Rotation Graph above, which shows the three main Dow indexes against the Dow Jones Composite Average.
This RRG is available from the drop-down on the RRG page under <DJ Composite 65>. As the...
READ MORE
MEMBERS ONLY
Can the Major Indices Stand Their Ground?
On Wednesday, the four major indices gapped lower based on the failure of the Russell 2000 (IWM) and the Nasdaq 100's (QQQ) ability to clear resistance from their 50-day moving averages. However, IWM did not reach its next support level at $211, and the QQQs were able to...
READ MORE
MEMBERS ONLY
17 Secrets to Trading, Part 1
by Dave Landry,
Founder, Sentive Trading, LLC
In this edition of Trading Simplified, Dave gives you the first 9 of his 17 secrets to trading. Number one might surprise you! Dave explains that you don't need to be a genius to be a successful trader, showing how having a set of rules, along with a...
READ MORE
MEMBERS ONLY

DOW AND S&P 500 RETEST 50-DAY LINES -- STOCKS CLOSE WELL OFF THEIR LOWS -- QQQ ENDS IN POSITIVE TERRITORY
by John Murphy,
Chief Technical Analyst, StockCharts.com
DOW AND S&P 500 HOLD SHORT-TERM SUPPORT...Stocks opened sharply lower this morning but recovered most of their losses by day's end. One encouraging sign was that the Dow the S&P 500 found some support at their 50-day moving averages and potential chart at...
READ MORE
MEMBERS ONLY
The 50-day and the early Gap Tell the Tale for QQQ
by Arthur Hill,
Chief Technical Strategist, TrendInvestorPro.com
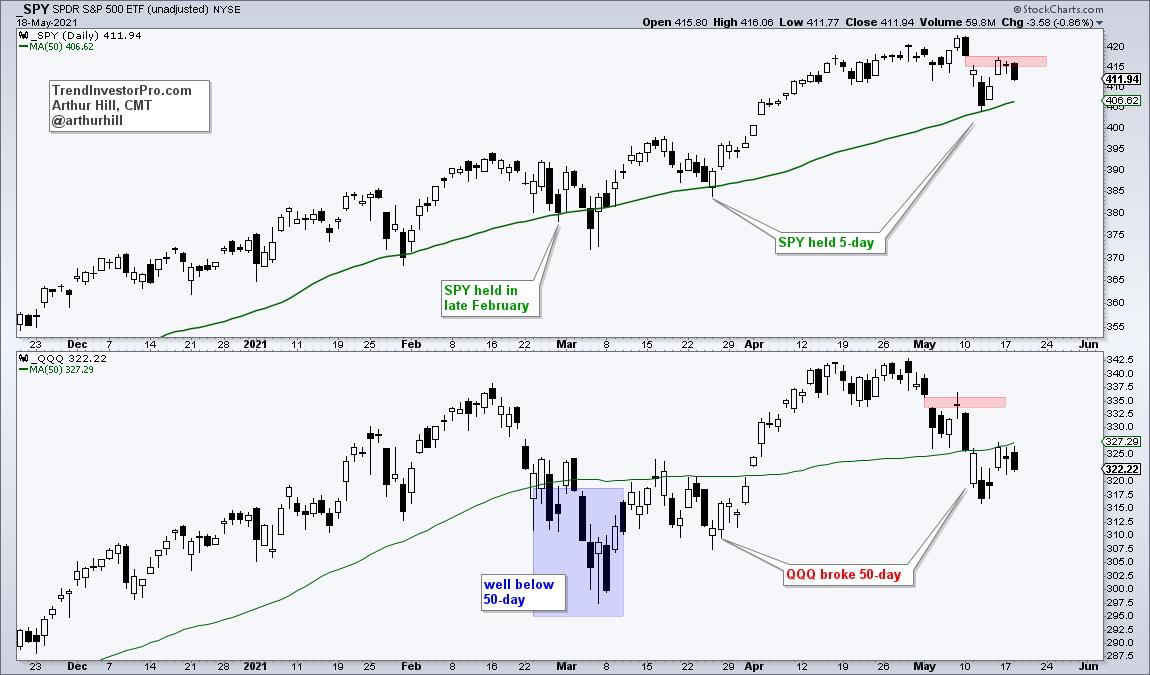
Chartists can compare performance by using the 50-day SMA as a benchmark level. Names that exceed their 50-day SMAs show more strength than those that do not exceed their 50-day SMAs. By this yardstick, QQQ is underperforming SPY and weighing on the broader market. Oh, and mind the gap as...
READ MORE
MEMBERS ONLY

All Eyes on the 50-Day Moving Average
The Russell 2000 (IWM) and Nasdaq 100 (QQQ) have yet to surpass their 50-day moving average, which has created a pivotal and psychological resistance level that bulls are looking to clear. Additionally, other key sectors and indices have been holding their breath in anticipation of a break over these specific...
READ MORE
MEMBERS ONLY
Sector Spotlight: Discretionary Danger
by Julius de Kempenaer,
Senior Technical Analyst, StockCharts.com
On this edition of StockCharts TV's Sector Spotlight, I start with the usual overview of last week's rotations in asset classes and sectors, blending those observations in with a look at the weekly Relative Rotation Graphs to identify meaningful relative trends. On the Asset Class side,...
READ MORE
MEMBERS ONLY

Be Wary AMC at This Resistance Level and with Options Set to Expire
by Tom Bowley,
Chief Market Strategist, EarningsBeats.com
Listen, anything can happen in the stock market, but AMC Entertainment Holdings (AMC) has a short-term issue to worry about. Options expire on Friday and there are a TON of options bets placed on AMC for May. At the moment, millions of dollars of net in-the-money call interest exists, and...
READ MORE
MEMBERS ONLY

Gold Starting to Look Interesting Again

by Martin Pring,
President, Pring Research
Gold has rallied nicely in the last few weeks, so the question naturally arises as to whether it's ready to resume its secular bull market. I'll get to that later, but first, a little perspective.
Longer-Term Perspective
Chart 1 plots the real price as adjusted by...
READ MORE
MEMBERS ONLY
The Up and Comers and the Stay Away Fromers
by Tom Bowley,
Chief Market Strategist, EarningsBeats.com
Rotation is always a part of a secular bull market. It's honestly the glue that holds everything together. During bear markets, when money rotates away from an area of the market, it usually just moves to the sidelines. Bull markets are different, however, as money typically finds its...
READ MORE
MEMBERS ONLY
DP TV: Market Climax Analysis
by Erin Swenlin,
Vice President, DecisionPoint.com
In this episode of DecisionPoint, Erin reviews the major market and indicators, then discusses "Climax Analysis". Last week, the market saw FOUR climax days; using climax analysis, DecisionPoint was able to prepare each day last week with market direction confidence levels. Climaxes last week worked beautifully. Erin conducts...
READ MORE
MEMBERS ONLY
Why Tuesday is Pivotal for the Market
Last Friday, the market closed on a high note, with a rally off the lows of 05/12. This was a bullish sign, yet the rally also pushed prices into a resistance area. The mixed sentiment from traders can be seen in today's major indices, with an inside...
READ MORE
MEMBERS ONLY

GOLD AND SILVER ATTRACT NEW BUYING
by John Murphy,
Chief Technical Analyst, StockCharts.com
GOLD AND ITS MINERS MAY BE TURNING UP... Precious metals have sat out the rally in most commodity markets. But money is starting to flow into the group and its miners. The daily bars in Chart 1 show the VanEck Gold Miners ETF (GDX) rising above its early 2021 peak...
READ MORE
MEMBERS ONLY

Nasdaq 100 Shows Significant Weakness
by Carl Swenlin,
President and Founder, DecisionPoint.com
The Nasdaq 100 Silver Cross Index (SCI) shows the percentage of NDX stocks with the 20EMA above the 50EMA (an IT Trend Model BUY signal). The current reading is 56%, which is pretty weak, so we must wonder if it will go lower, or if it is about to improve....
READ MORE
MEMBERS ONLY

Week Ahead: NIFTY Shows Weak Technical Setup; RRG Charts Shows These Sectors Making Strong Moves
by Milan Vaishnav,
Founder and Technical Analyst, EquityResearch.asia and ChartWizard.ae
The truncated trading week stayed disappointing in more ways than one. Just when it appeared that the NIFTY had rectified its violation of the immediate and important trend line support, it has since violated it again while taking support on the short-term 20-week MA. The trading range remained a bit...
READ MORE
MEMBERS ONLY
Dead Cat Bounce on S&P 500?
by David Keller,
President and Chief Strategist, Sierra Alpha Research
When a market makes a quick move lower from an established peak, then quickly rebounds back to the upside, you will hear the dreaded phrase "dead cat bounce" emerge on trading floors. What is this pattern, and what can it tell us about next steps for the S&...
READ MORE
MEMBERS ONLY
Staples Stocks Spring to Life
by Mary Ellen McGonagle,
President, MEM Investment Research
In this episode of StockCharts TV'sThe MEM Edge, Mary Ellen reveals a sector benefiting from increased prices while sharing stocks poised to trade higher. She also reviews names that withstood the downward pressure this week, with an eye toward continued outperformance.
This video was originally recorded on May...
READ MORE
MEMBERS ONLY
How to Best Position Yourself For a Rocky Market Ahead

by John Hopkins,
President and Co-founder, EarningsBeats.com
The volatility we've seen in the market of late can be linked to some recent reports showing that inflationary concerns are becoming problematic. More specifically, the Labor Department reported that CPI rose by 0.8%, while the rate of inflation over the past year climbed 4.2% in...
READ MORE
