MEMBERS ONLY

Bullish Breakouts for Financials

by David Keller,
President and Chief Strategist, Sierra Alpha Research
Last month, we recognized a bearish divergence on the chart of the 10-year Treasury Yield ($TNX). Soon after, bond prices rallied, pushing interest rates down to an ascending 50-day moving average. Now that this pullback has completed, we're seeing signs of rising rates, which has ripple effects for...
READ MORE
MEMBERS ONLY
Major Index Support and Resistance Levels
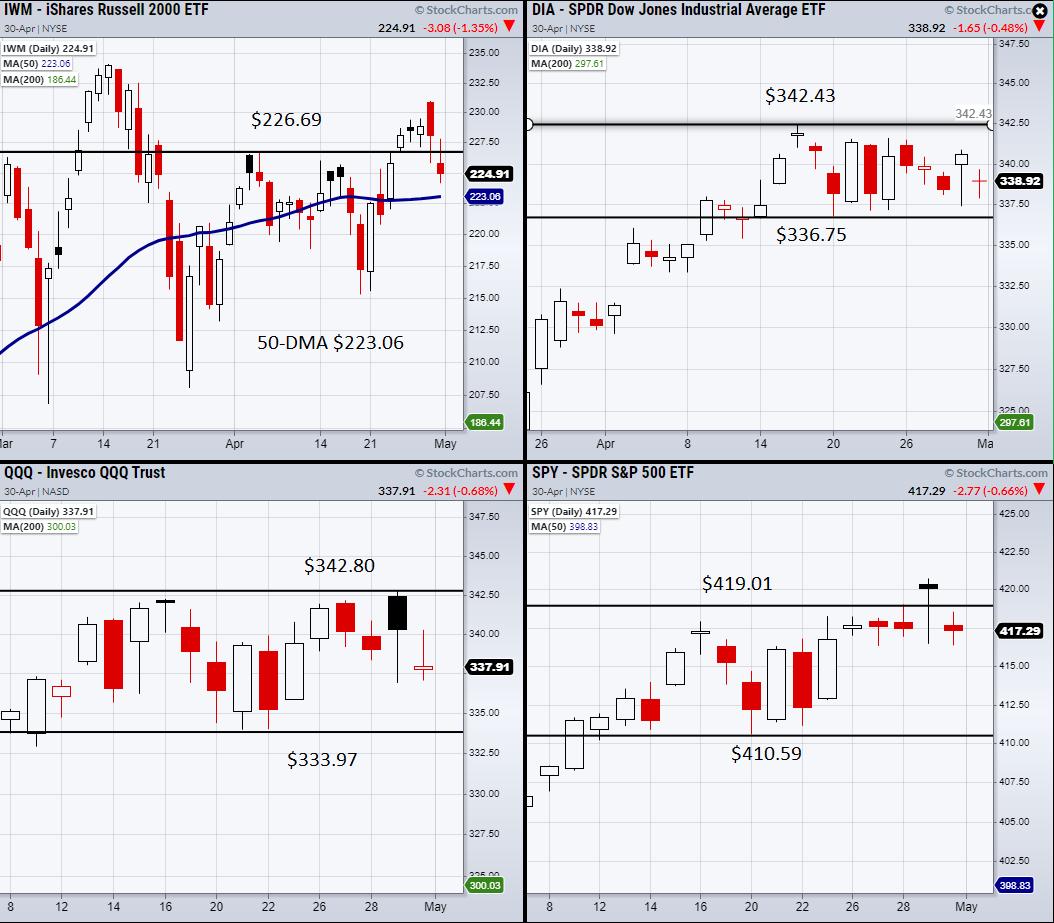
Last Thursday, the S&P 500 (SPY) and the Nasdaq 100 (QQQ) tested new highs and then gapped lower on Friday, showing that the market still had some overhead resistance. Driving reasons could be related to fears of inflation raising, as the U.S pushes to take on more...
READ MORE
MEMBERS ONLY

Take Advantage of Record Earnings!

by Mary Ellen McGonagle,
President, MEM Investment Research
In this episode of StockCharts TV'sThe MEM Edge, Mary Ellen highlights the best ways to take advantage of companies responding to strong earnings. She also shares recovery plays as the U.S. economy continues to reopen amid strong consumer confidence
This video was originally recorded on April 30th,...
READ MORE
MEMBERS ONLY
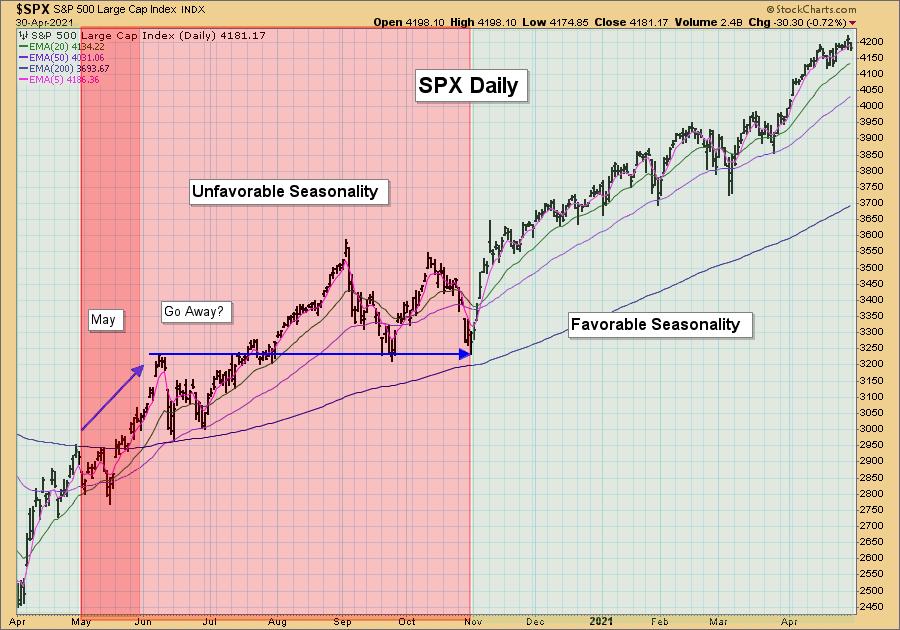
Sell in May and Go Away? - Greg Schnell in Monday's Free Trading Room!

by Erin Swenlin,
Vice President, DecisionPoint.com
We've all heard the saying, "Sell in May and Go Away." This describes a phenomena that implies that investors, in preparation for summer, will sell in May and then take a break from the market over the summer. If only it were that easy!
2020 was...
READ MORE
MEMBERS ONLY
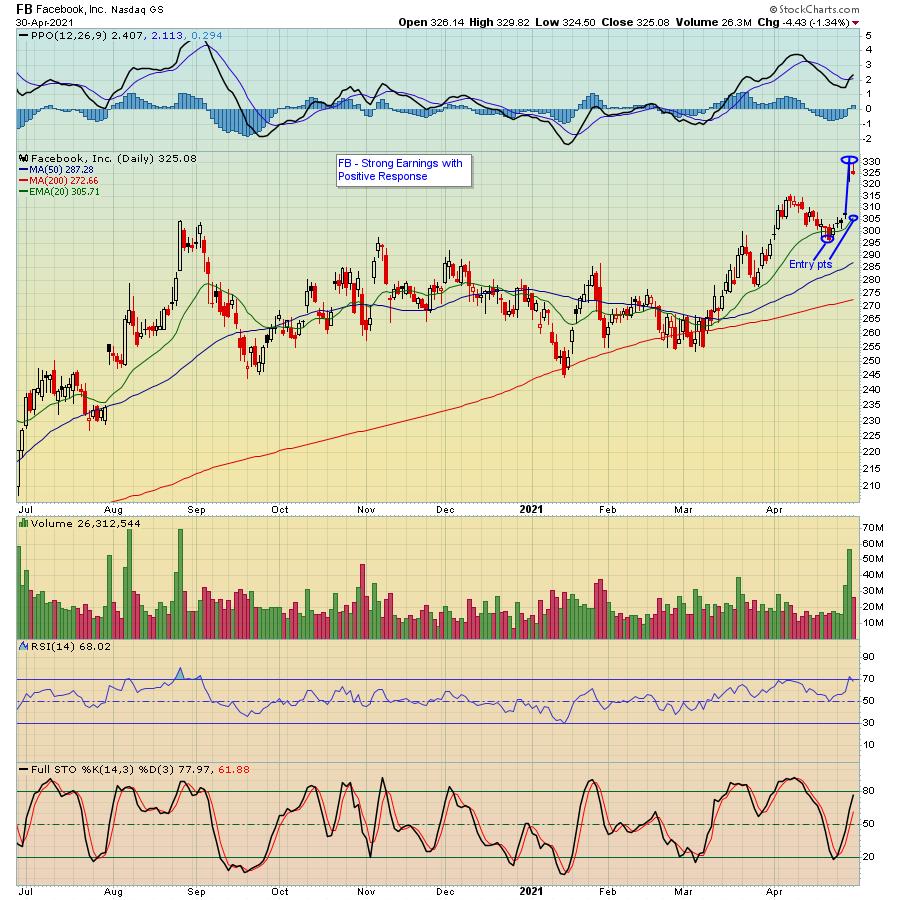
Strong Earnings = Fresh Opportunities to Make Money

by John Hopkins,
President and Co-founder, EarningsBeats.com
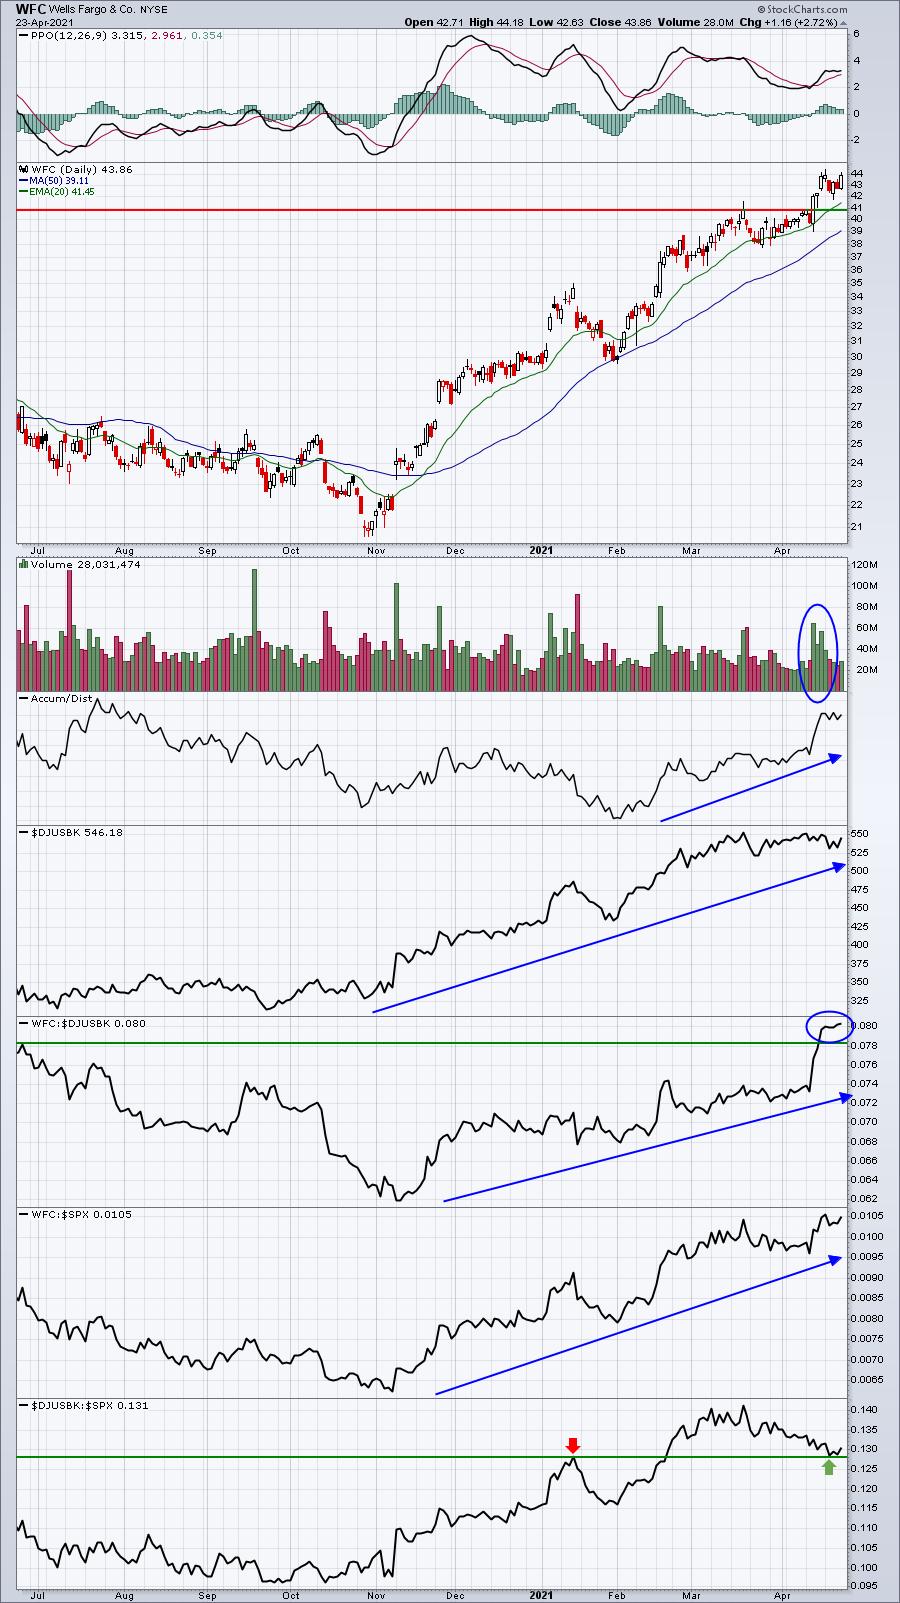
Last week was chock-full of blockbuster earnings reports, including AAPL, AMZN, FB, GOOGL and MSFT. Together, those five companies have a combined market cap of over $8 trillion. That's a lot of earnings fire power! Overall, the five companies in total had superb earnings including top line, bottom...
READ MORE
MEMBERS ONLY
Semis Lose Their Shine

by Arthur Hill,
Chief Technical Strategist, TrendInvestorPro.com
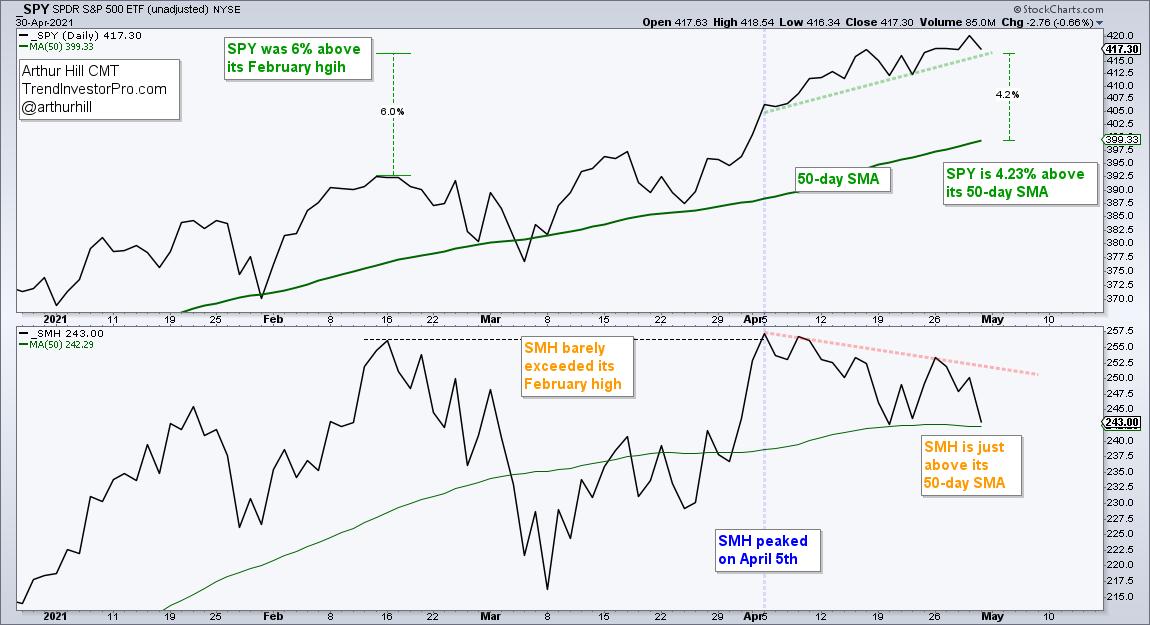
The long-term trend for the Semiconductor ETF (SMH) remains up, but the ETF is coming under some selling pressure and underperforming the broader market. While this is not enough reason to turn long-term bearish, it does increase the odds of corrective period in the coming weeks.
First, let's...
READ MORE
MEMBERS ONLY

Your Dashboard To Profits In 2021: Stock Market Mastery ChartPack - Update #31 (Q1 / 2021)

by Grayson Roze,
Chief Strategist, StockCharts.com

by Gatis Roze,
Author, "Tensile Trading"
Welcome to a virtual SWAT team of elite charts and essential organized routines. This Stock Market Mastery ChartPack is now 15 years in existence. Eight years ago we made it available to the public but prior to that, I used it in my college investment courses. The point being, that...
READ MORE
MEMBERS ONLY

AMAZON TESTS OLD HIGH ON STRONG EARNINGS -- THE NASDAQ TESTING SEPTEMBER HIGH -- SLIGHT NEGATIVE DIVERGENCE FOR THE SPX -- SELL IN MAY?

by John Murphy,
Chief Technical Analyst, StockCharts.com
AMAZON RALLIES ON STRONG EARNINGS... Amazon was the last of the big five tech stocks that reported earnings this week. And it reported strong quarterly profits as did the other big tech stocks. Of those four, Facebook and Alphabet gained ground while Apple and Microsoft pulled back on the strong...
READ MORE
MEMBERS ONLY
Chartwise Women: More Upside for These Big Movers
by Mary Ellen McGonagle,
President, MEM Investment Research
by Erin Swenlin,
Vice President, DecisionPoint.com
In this week's edition of Chartwise Women, Mary Ellen and Erin review stocks that have had explosive moves after reporting strong earnings. From there, they share how to pinpoint upside potential, as well how to use a pullback for entry points.
This video was originally recorded on April...
READ MORE
MEMBERS ONLY
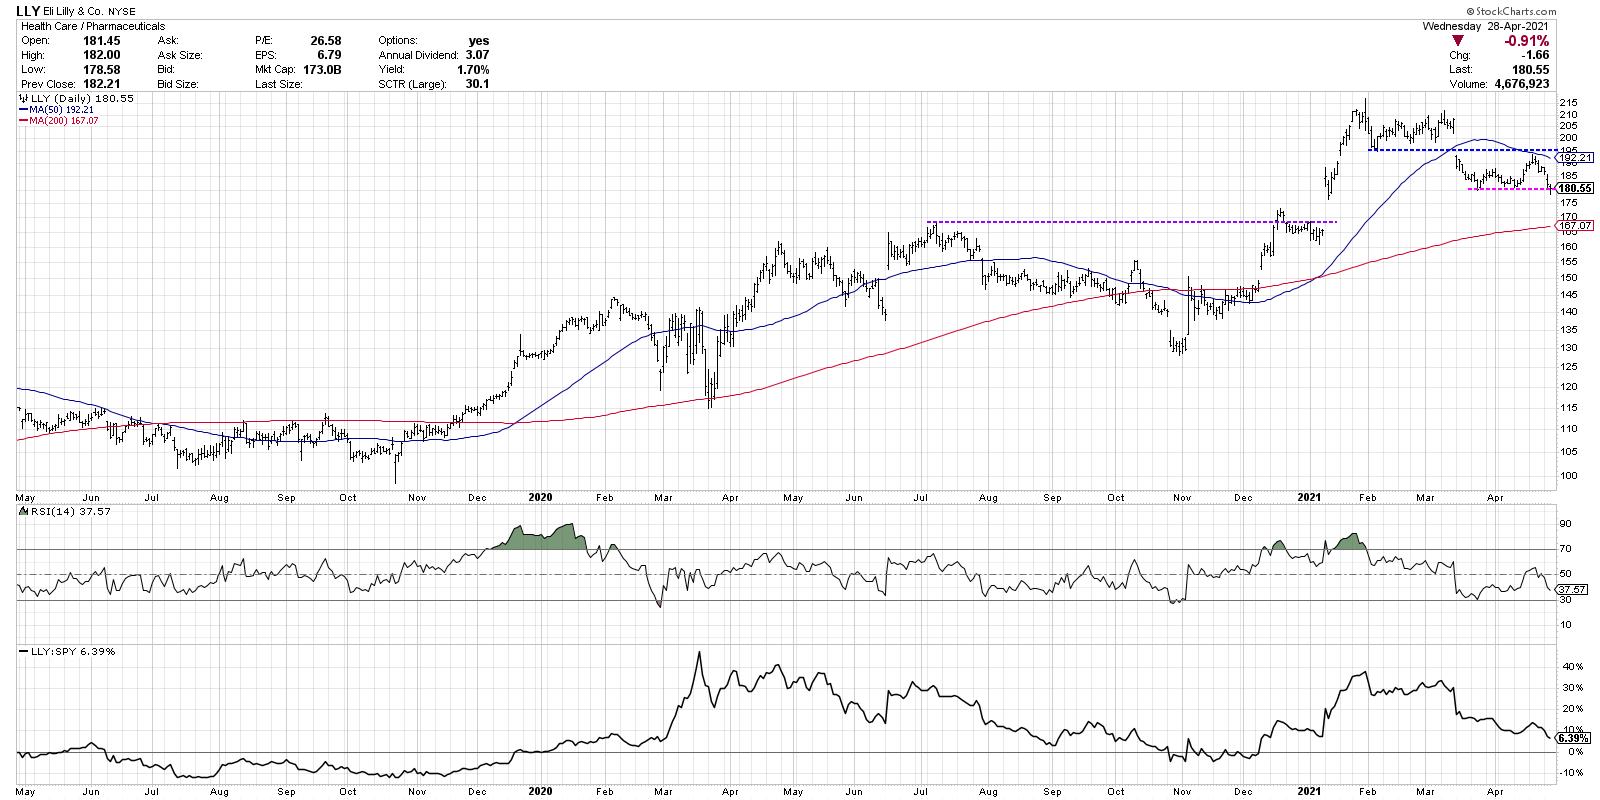
Eli Lilly: Perfect Example of Price Distribution
by David Keller,
President and Chief Strategist, Sierra Alpha Research
I look at hundreds of charts every single day. Every once in a while, I come upon a chart that I feel should be in future textbooks on technical analysis. One chart that seems to provide a perfect example of best practices in price analysis and investor behavior.
This week&...
READ MORE
MEMBERS ONLY
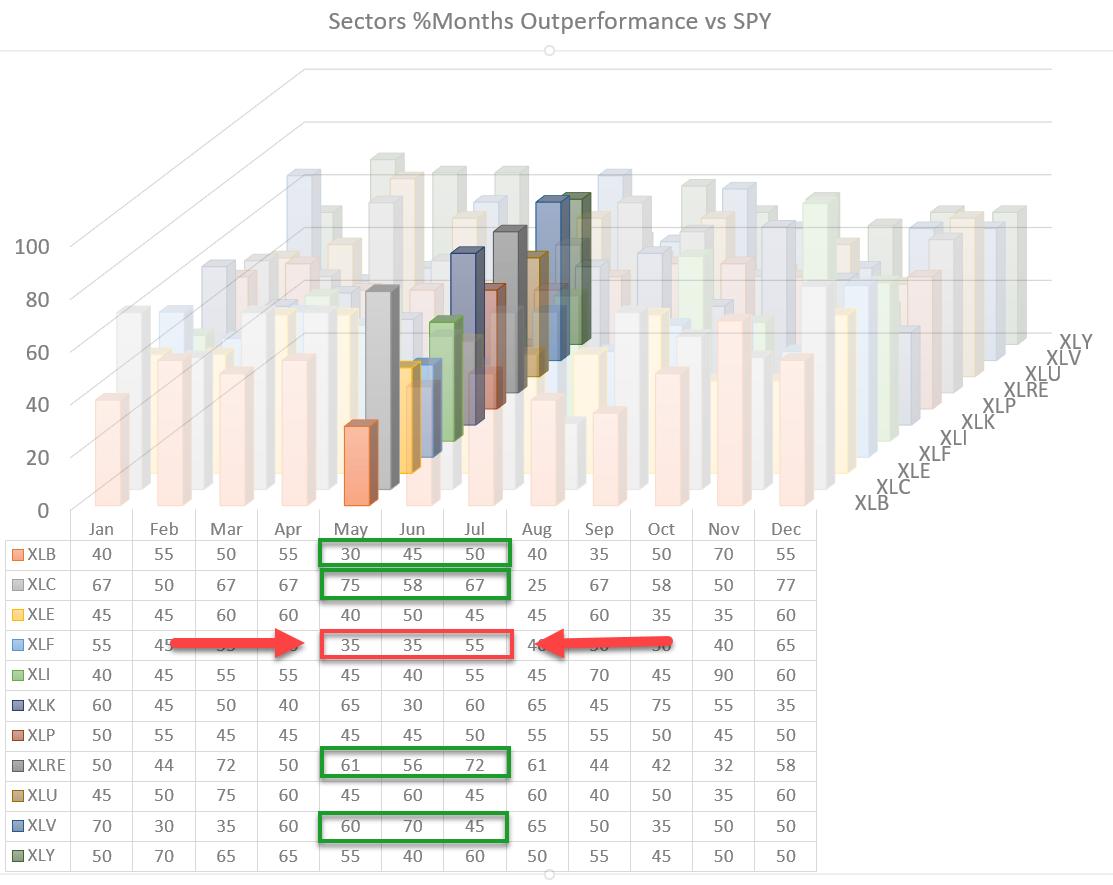
Seasonality Shows Weakness Ahead For Financials

by Julius de Kempenaer,
Senior Technical Analyst, StockCharts.com
Looking at the 3D visualization for US sectors going into May, one sector stands out negatively. That sector is Financials, the fourth largest sector at ~11% of market cap.
For May and June, the historical record is that the Financial sector outperforms the S&P 500 only 35% of...
READ MORE
MEMBERS ONLY
Has Earnings Season Slowed Market Volatility?
The first half of Wednesday saw minimal movement in the major indices, due in large part to the anticipation for the FOMC minutes that were later released at 2pm ET. However, like the prior FOMC report, it stuck to the same slate of ideas. Interest rates will stay near zero...
READ MORE
MEMBERS ONLY
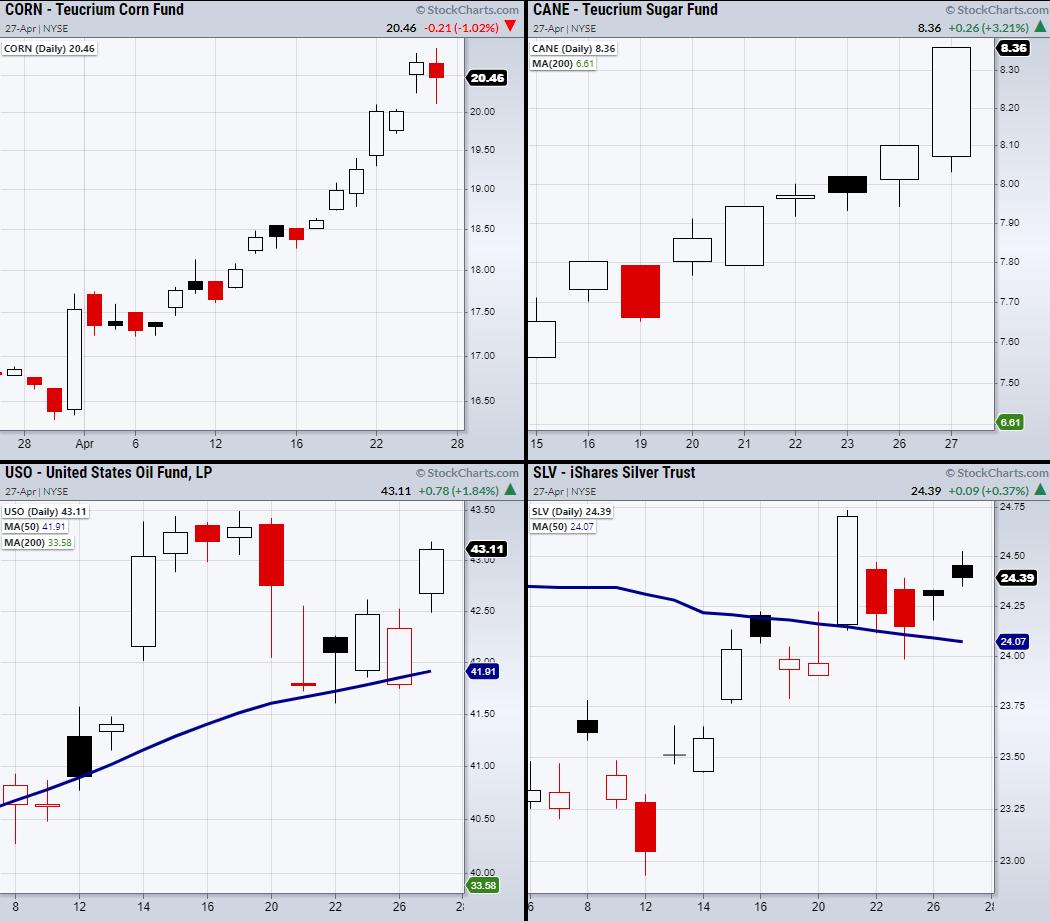
Are Rising Commodities Causing Investors to Worry About Inflation?
This week, three of the major indices, including the Nasdaq 100 (QQQ), Dow Jones (DIA) and S&P 500 (SPY), have been lingering near highs without the ability to break out. However, food commodities, such as corn (CORN), sugar (CANE), soybeans (SOYB) and more, have seen a consistent rise...
READ MORE
MEMBERS ONLY

TESLA DROPS AFTER RECORD EARNINGS -- BIG TECHS REPORT THIS WEEK
by John Murphy,
Chief Technical Analyst, StockCharts.com
TESLA DROPS AFTER REPORTING RECORD EARNINGS... How stocks react to earnings reports often tells us something about their technical condition. Tesla (TSLA) is a good example. Two weeks ago I showed Tesla rising decisively above its 50-day moving average which suggested that the stock might be bottoming. That interpretation is...
READ MORE
MEMBERS ONLY

Sector Spotlight: Seasonal Stars Aligning
by Julius de Kempenaer,
Senior Technical Analyst, StockCharts.com
It's all about tails on this edition of StockCharts TV's Sector Spotlight. For the last Tuesday of the month, I examine the seasonal patterns for sectors and compare them to the current rotations on Relative Rotation Graphs. Five sectors are worth a further investigation based on...
READ MORE
MEMBERS ONLY
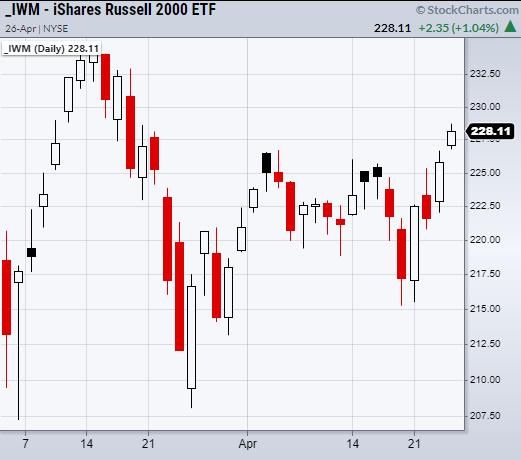
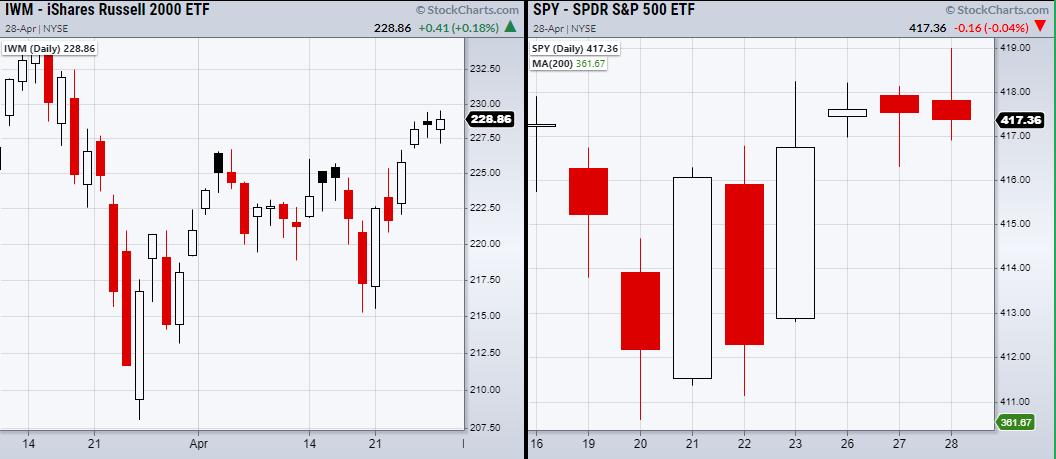
Is the Russell 2000 (IWM) Back on Track to New Highs?
On Sunday, we concluded that if most of the major indices could clear to new highs, along with the Russell 2000 (IWM) breaking out of resistance from $226.69, the market had the potential to make a powerful move up. However, while none of the indices broke out to new...
READ MORE
MEMBERS ONLY

DP TV: Market Needs Strong Participation
by Erin Swenlin,
Vice President, DecisionPoint.com
In this episode of DecisionPoint, Erin takes the wheel and steers us through the broad market using "participation" as her guide. She details what "participation" means and how DecisionPoint indicators measure it. The market still is showing strong participation with price, but not momentum. The Dollar...
READ MORE
MEMBERS ONLY

Commodities are Breaking Out All Over

by Martin Pring,
President, Pring Research
The Fed has pumped a lot of money into the system -- and that liquidity has to go somewhere. We know a lot of it has already been flowing into stocks. Now it looks like it's time for commodities to participate. So much money, combined with bottlenecks in...
READ MORE
MEMBERS ONLY
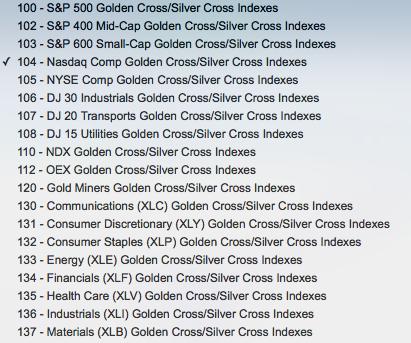
Nasdaq Internals Are Truly Dismal

by Carl Swenlin,
President and Founder, DecisionPoint.com
A DecisionPoint IT Trend Model (ITTM) BUY signal is generated when the 20EMA crosses up through the 50EMA, what we call a "Silver Cross." A few years ago we developed the Silver Cross Index, which tracks the percentage of stocks in a given index that have a silver...
READ MORE
MEMBERS ONLY
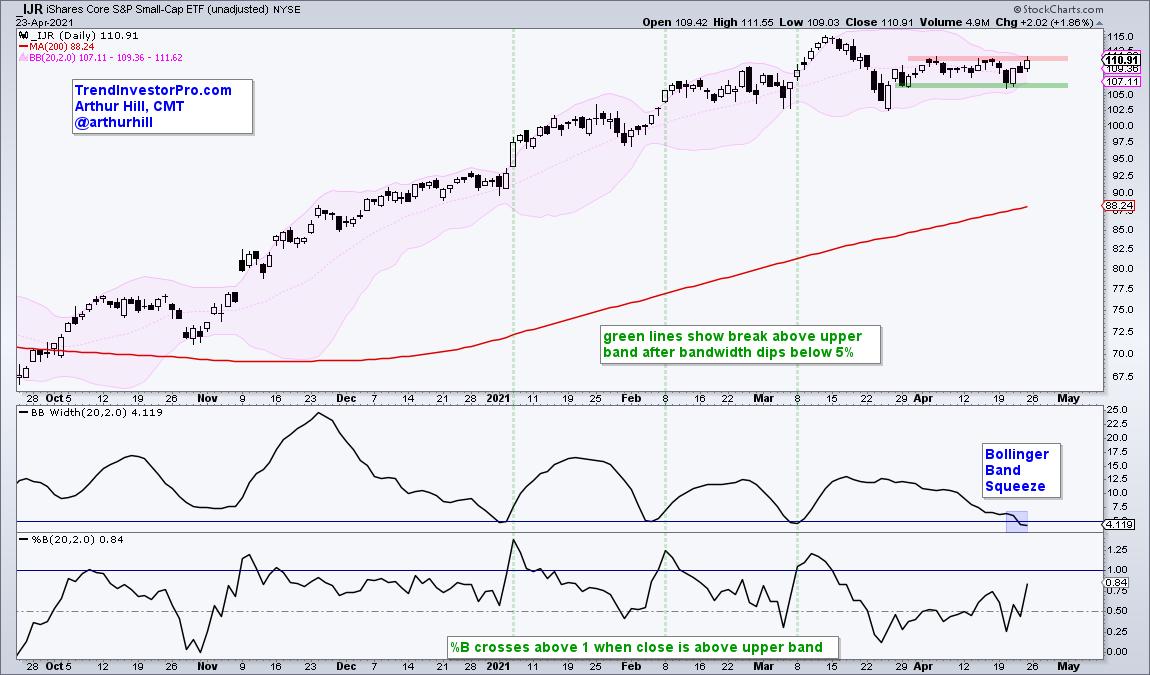
Small-caps Keep Everyone Guessing - Here's Mine
by Arthur Hill,
Chief Technical Strategist, TrendInvestorPro.com
The S&P SmallCap 600 SPDR (IJR) and Russell 2000 ETF (IWM) are lagging the market, but they are still in uptrends and the noose is tightening. Today we will look at the volatility contraction in IJR and the loss of trend in IWM, and then show what to...
READ MORE
MEMBERS ONLY
How To Keep Up With Hundreds Of Daily Earnings Reports

by Tom Bowley,
Chief Market Strategist, EarningsBeats.com
Right now, we're seeing dozens of companies report quarterly results each day. That's going to change this week as hundreds of companies get set to report earnings every day. How can you keep up with all of it? Well, StockCharts.com's platform provides the...
READ MORE
MEMBERS ONLY

NIO Takes First Few Steps to Reverse Downtrend
by Tom Bowley,
Chief Market Strategist, EarningsBeats.com
Once a previously-leading stock begins a journey to the downside, you want to be careful pulling the buy trigger too soon. These downtrends can last awhile, so expecting a quick recovery and buying a pullback can create a lot of short-term pain in your pocketbook. The better option is to...
READ MORE
MEMBERS ONLY

Week Ahead: NIFTY Mildly Violates This Important Pattern Support; May Relatively Underperform Broader Indices

by Milan Vaishnav,
Founder and Technical Analyst, EquityResearch.asia and ChartWizard.ae
In a week where the trading range stayed narrower than the earlier week, the Indian equities saw a corrective decline. The current week was also a truncated one with just four trading sessions. The headline index saw itself oscillating in a 375-point range. Though the range stayed less wide, the...
READ MORE
MEMBERS ONLY
Earnings Drive Equity Prices; Here Are My Two Favorite Earnings Reports This Quarter
by Tom Bowley,
Chief Market Strategist, EarningsBeats.com
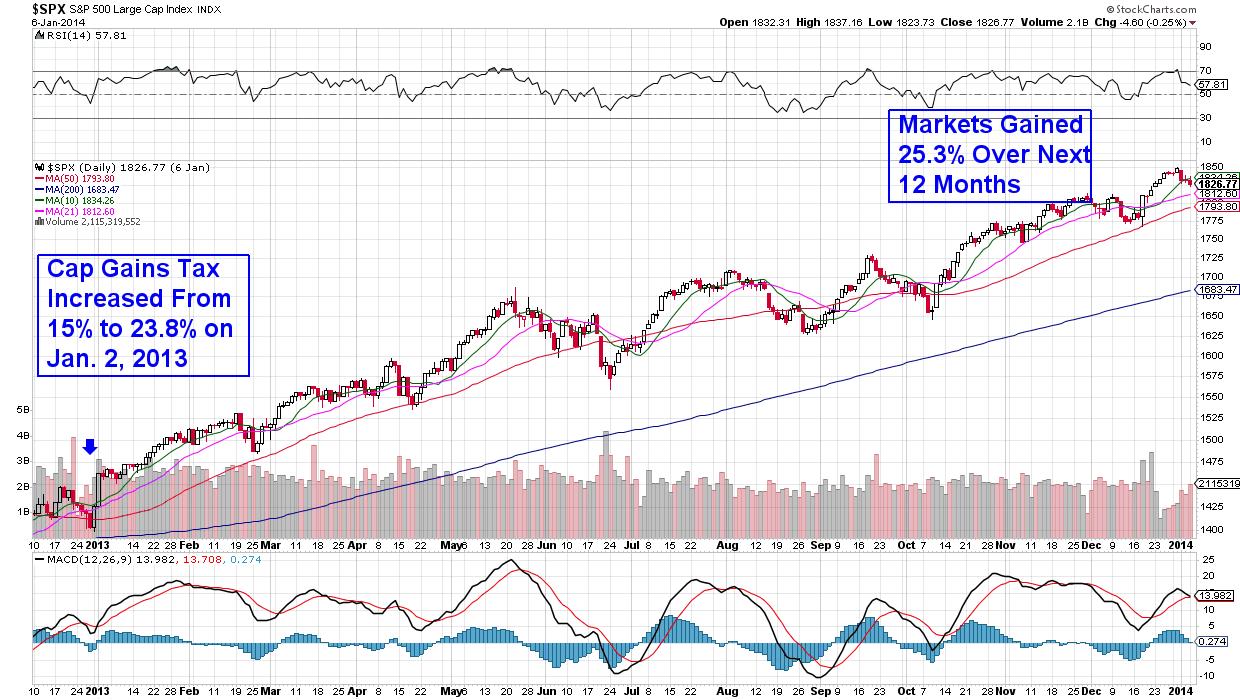
Over the long haul, earnings and Fed policy have more to do with stock market direction than anything. Focus on these two and you'll be just fine. Tune everything else OUT. President Biden's possible tax hike on capital gains was a problem..... for an hour on...
READ MORE
MEMBERS ONLY
Will a Capital Gains Tax Take the Markets Down?
by Mary Ellen McGonagle,
President, MEM Investment Research
Next week, in a speech to Congress, Biden is likely to detail the tax plan he outlined during his campaign. Reports suggest that the capital-gains tax rate on people earning more than $1 million a year would increase from 20% to 39.6%. That would be the highest tax rate...
READ MORE
MEMBERS ONLY
Are the Major Indices Poised for a Powerful Up Move Monday?
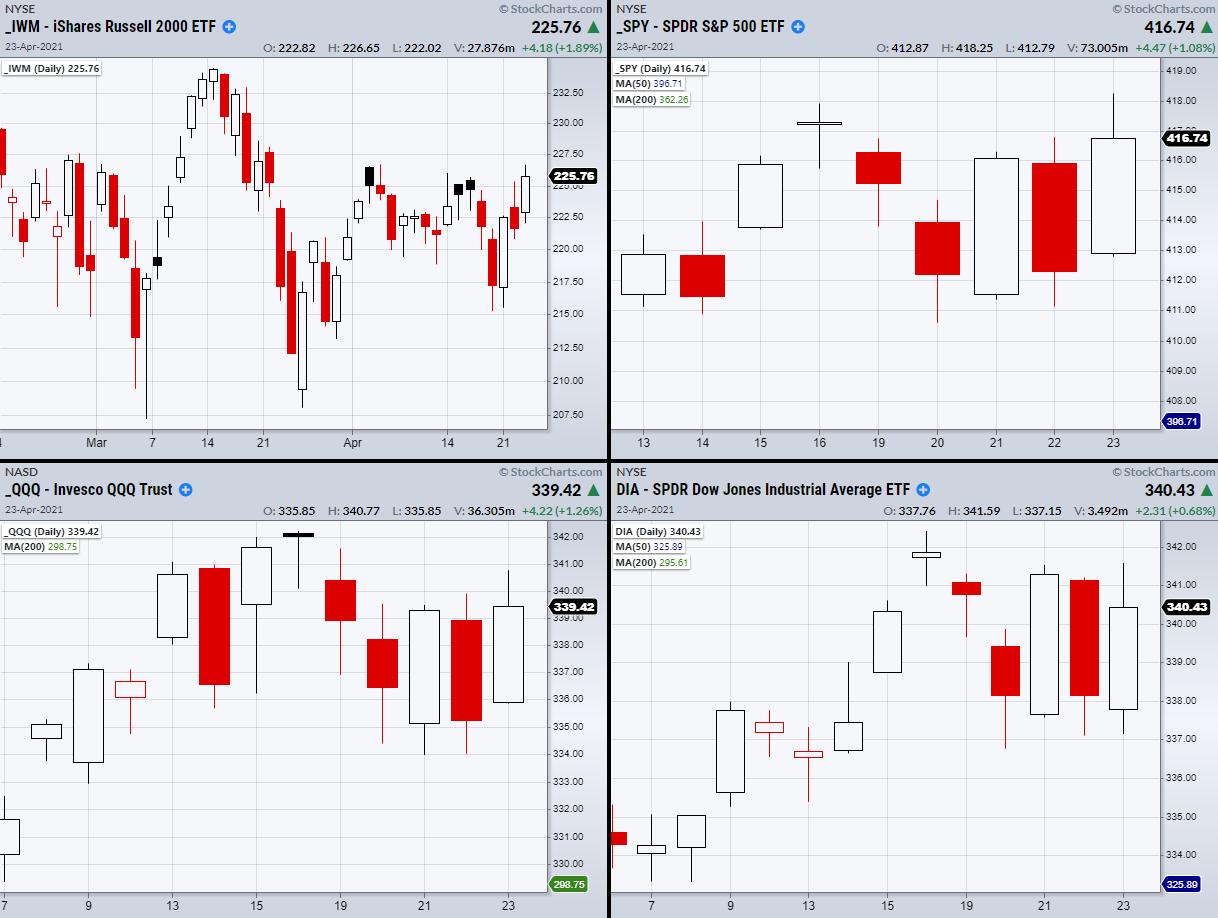
The Russell 2000 (IWM), Nasdaq 100 (QQQ), Dow Jones (DIA) and S&P 500 (SPY) all have the potential to make large moves Monday, if they clear their resistance levels together.
This month, the SPY, QQQ and DIA were able to make substantial gains. Currently, they sit close to...
READ MORE
MEMBERS ONLY
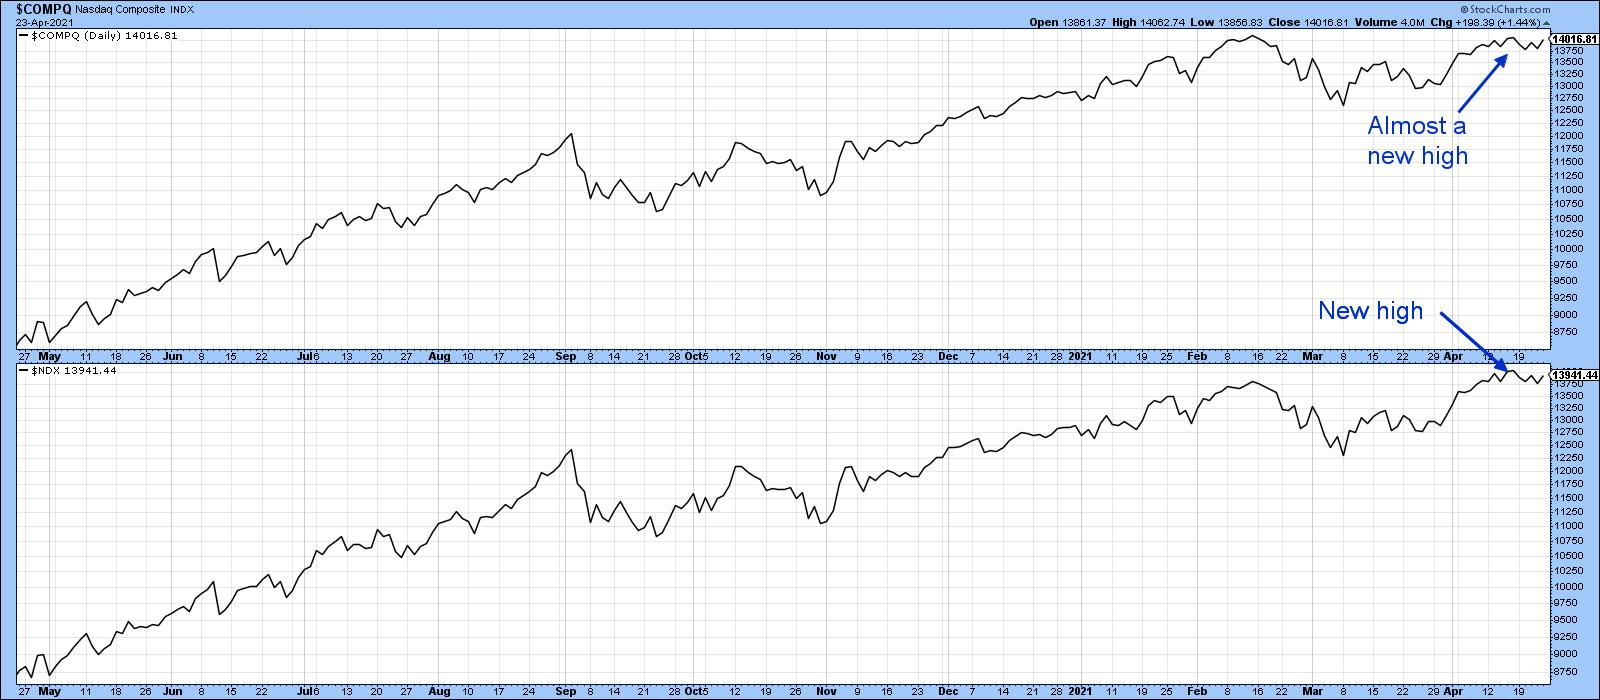
Has the NASDAQ Lost its Mojo?
by Martin Pring,
President, Pring Research
The NASDAQ Composite peaked on February 16, sold off and subsequently rallied back to the February high last week. Chart 1 shows that it just missed the earlier peak by a smidgen, whereas the NASDAQ 100 (in the lower window) did marginally take out its February high. Taken together, the...
READ MORE
MEMBERS ONLY
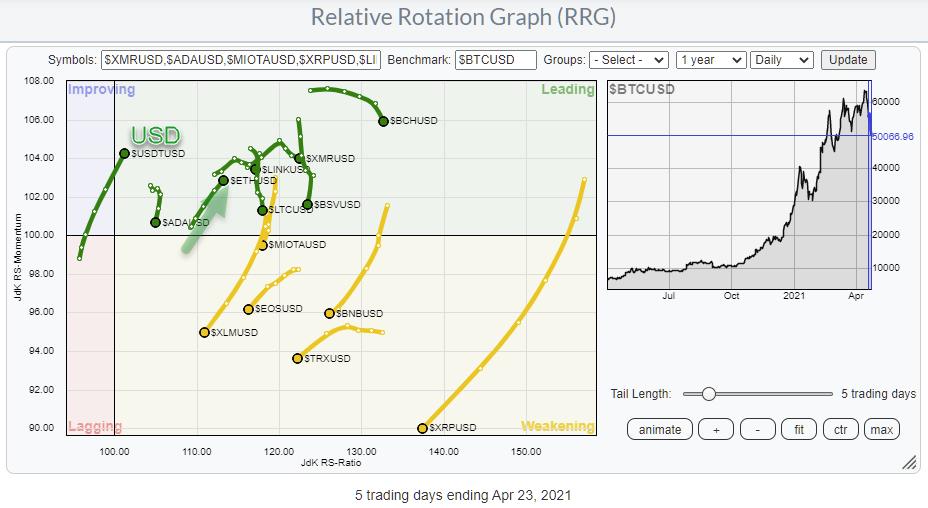
Forget Bitcoin, There is a New Kid on The Block(chain)
by Julius de Kempenaer,
Senior Technical Analyst, StockCharts.com
Another wild ride in crypto space this week. Bitcoin dropped almost 10% in value against the US Dollar in the past five days, while market darling DOGE lost a whopping 27%, as did TRON, Bitcoin SV, EOS and a few other major coins.
If you are ever looking for action,...
READ MORE
MEMBERS ONLY
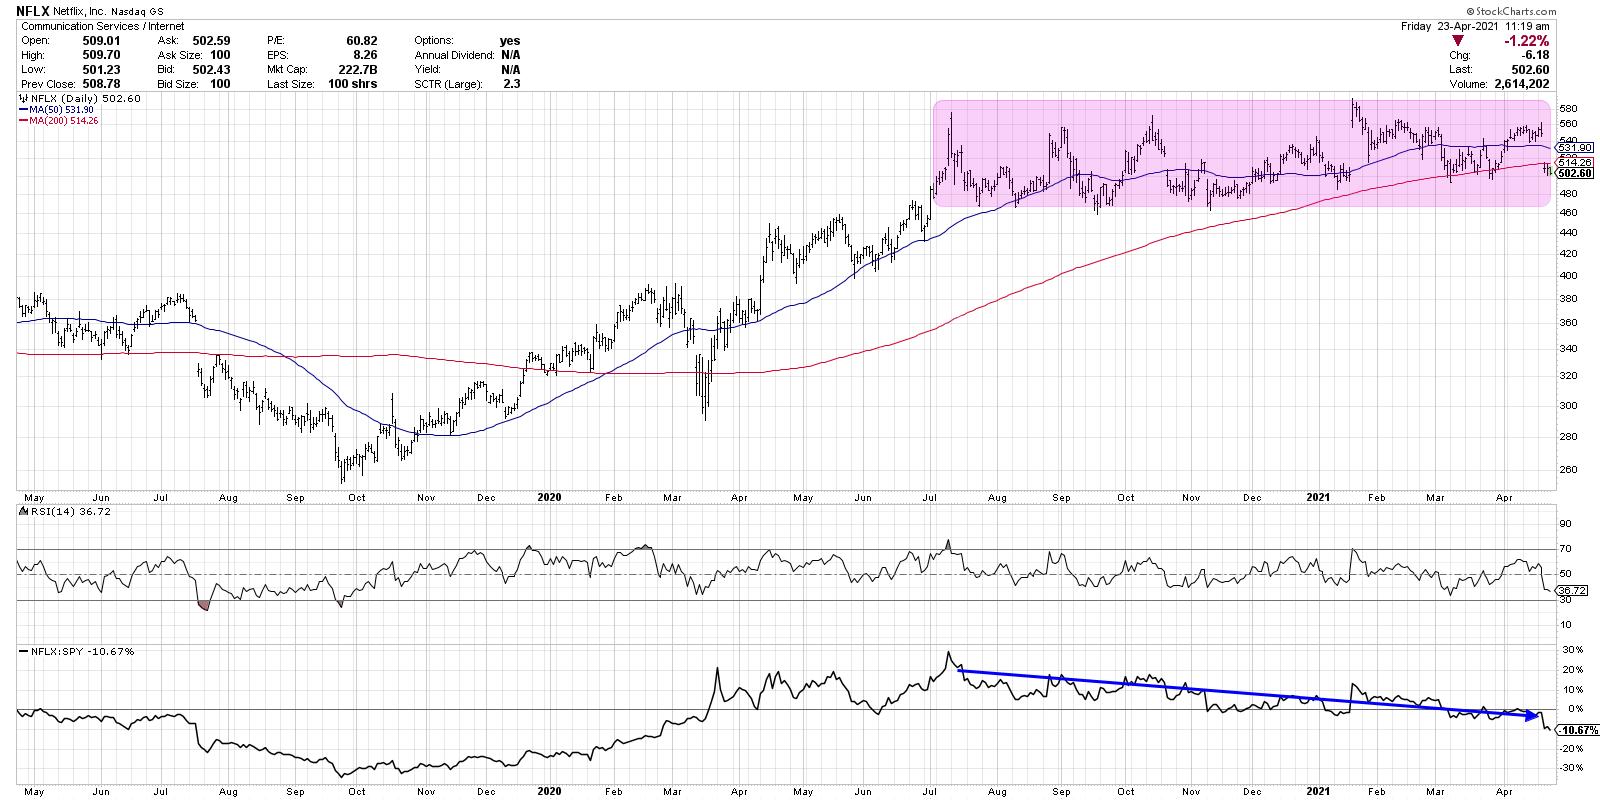
The Streaming Wars: T vs. NFLX
by David Keller,
President and Chief Strategist, Sierra Alpha Research
It's been a heavy earnings week, with many stocks gapping higher or lower based on investors' reactions to their quarterly results. With two particular stocks, AT&T (T) and Netflix (NFLX), this week was less about their ability to grow earnings and more about their potential...
READ MORE
MEMBERS ONLY

TEN-YEAR YIELD TESTS 50-DAY AVERAGE -- SMALL CAPS STABILIZE -- BITCOIN UNDER PRESSURE
by John Murphy,
Chief Technical Analyst, StockCharts.com
TEN-YEAR TREASURY YIELD TESTS 50-DAY AVERAGE... The decline in bond yields over the last month has helped boost stock prices, and technology stocks in particular. Chart 1, however, shows the 10-Year Treasury Yield testing its 50-day moving average. The major trend of bond yields remains higher with expectations for higher...
READ MORE
MEMBERS ONLY
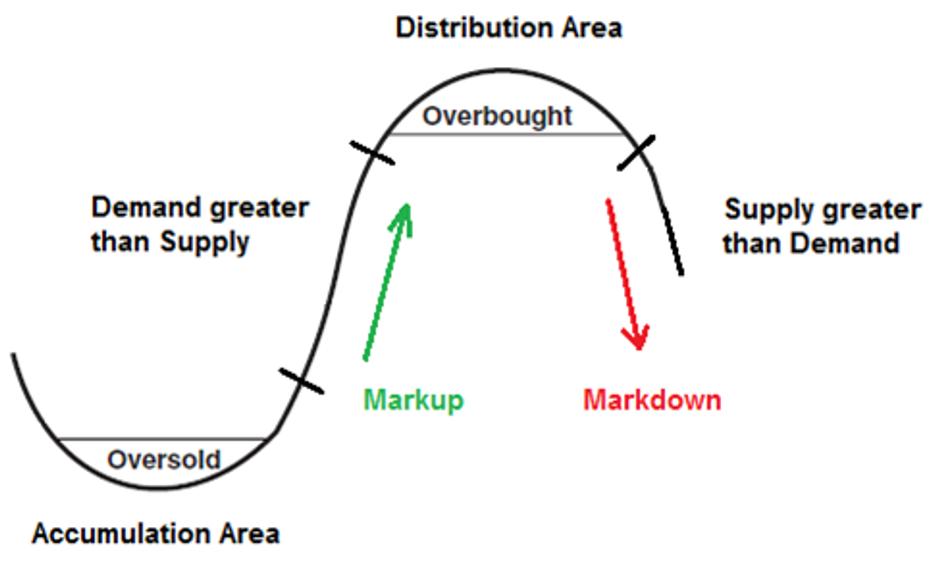
Identify Campaign Setups with the Wyckoff Method

by Bruce Fraser,
Industry-leading "Wyckoffian"
Campaign Investing is a specialized process. The tools of the Wyckoff Method are very adaptable to the practice of Campaigning. Wyckoff is fractal, working effectively in multiple timeframes. In the case of Campaigning the longer time periods are evaluated. The goal is to identify the pre-conditions to the emergence of...
READ MORE
MEMBERS ONLY
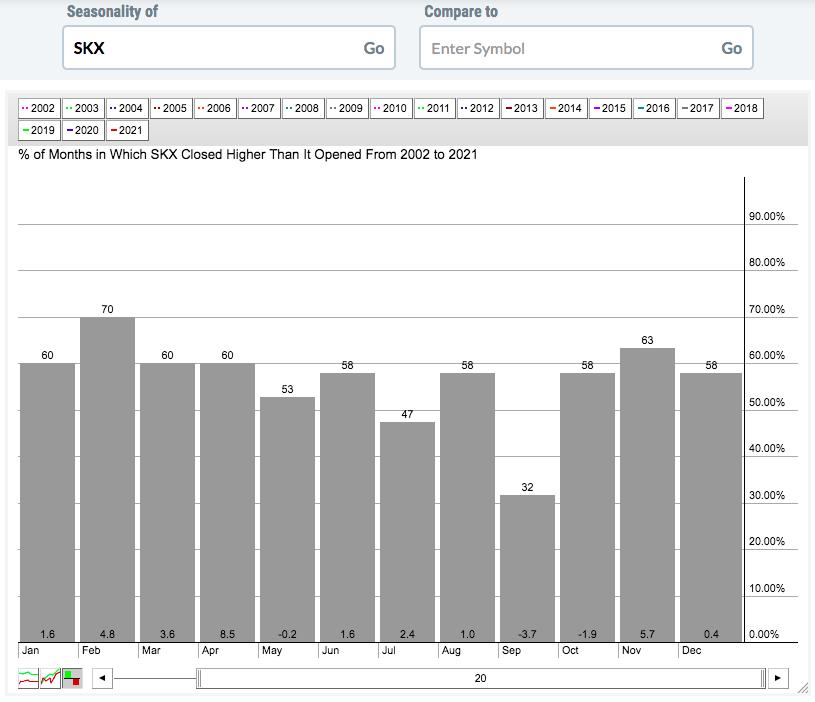
For Skechers (SKX), This Is Where The Rubber Meets The Road
by Tom Bowley,
Chief Market Strategist, EarningsBeats.com
If you held Skechers (SKX) into its quarterly earnings report, which was delivered after the bell on Thursday, congratulations! It was truly a blowout report, like so many others. Wall Street, however, has chosen to reward SKX and its shareholders with the stock up more than 16% at last check....
READ MORE
MEMBERS ONLY
Chartwise Women: Small Caps Begin to Emerge
by Mary Ellen McGonagle,
President, MEM Investment Research
by Erin Swenlin,
Vice President, DecisionPoint.com
In this week's edition of Chartwise Women, Mary Ellen and Erin review the recent move back into riskier Biotechs and Small Caps. They also share how you can uncover top candidates as they reverse their downtrends, while also revealing their top picks. Finally, the pair look at top...
READ MORE
MEMBERS ONLY

XLB and XLI Show Strong Rotations, But What About the Industries Inside?
by Julius de Kempenaer,
Senior Technical Analyst, StockCharts.com
Currently, two sectors stand out on the Relative Rotation Graph for sectors -- Industrials and Materials. Both tails are pushing further into the leading quadrant after a rotation through weakening and back into leading. Such a rotation usually signals a new up-leg in an already established rising relative trend. If...
READ MORE
MEMBERS ONLY

Has the NASDAQ Lost its Mojo?
by Martin Pring,
President, Pring Research
The NASDAQ Composite peaked on February 16, sold off and subsequently rallied back to the February high last week. Chart 1 shows that it just missed the earlier peak by a smidgen, whereas the NASDAQ 100 (in the lower window) did marginally take out its February high. Taken together, the...
READ MORE
MEMBERS ONLY
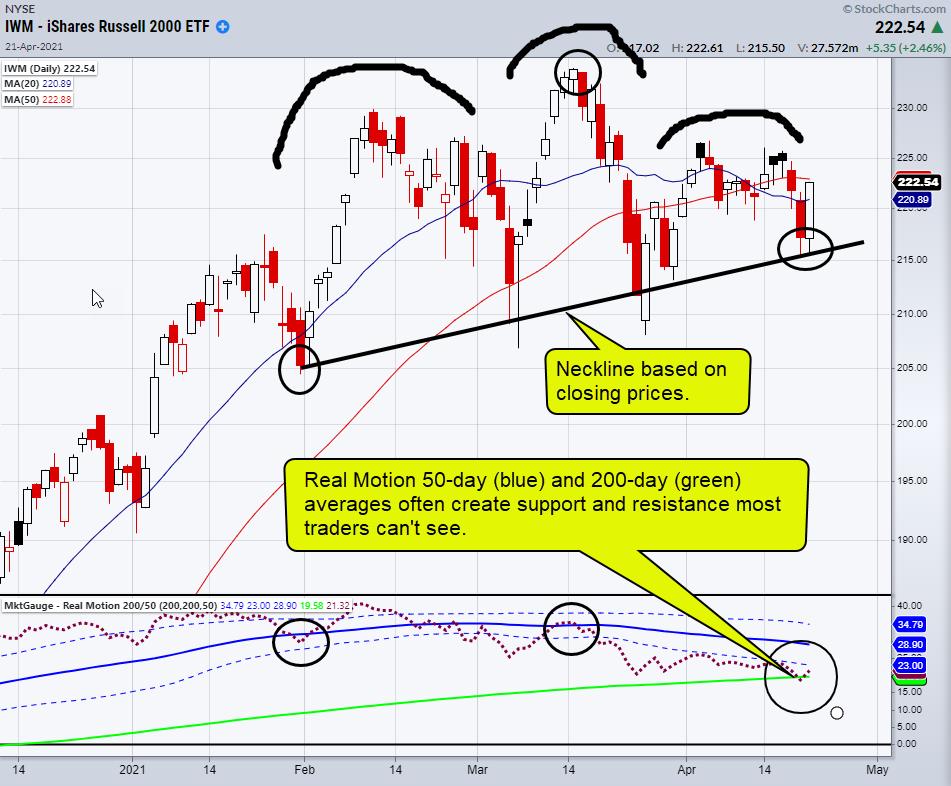
Saved By Hidden Support
On Wednesday, the major indices along with key sectors held pivotal support areas.
In the chart above, we can see that the small-cap index Russell 2000 (IWM) has put in some work to create a head-and-shoulders chart pattern. A head-and-shoulder pattern has 3 peaks, with the outside two being close...
READ MORE
MEMBERS ONLY

STOCKS MAINTAIN UPTRENDS -- THE NASDAQ COMPOSITE HAS HAS YET TO REACH A NEW HIGH
by John Murphy,
Chief Technical Analyst, StockCharts.com
DOW AND S&P 500 MAINTAIN UPTRENDS... Stocks snapped a two-day losing streak today and are maintaining their current uptrend. Chart 1 shows the Dow Industrials trading well above their 20-day moving average which keeps their short-term uptrend intact. Chart 2 shows the S&P 500 doing the...
READ MORE
MEMBERS ONLY

Hunting Hot IPOs

by Dave Landry,
Founder, Sentive Trading, LLC
In this edition of Trading Simplified, Dave shows you how to find hot IPOs to trade; not so much finding the right one right now, but how to find them and what to look for. He also shows you two of his favorite patterns for trading IPOs. He continues his...
READ MORE
MEMBERS ONLY
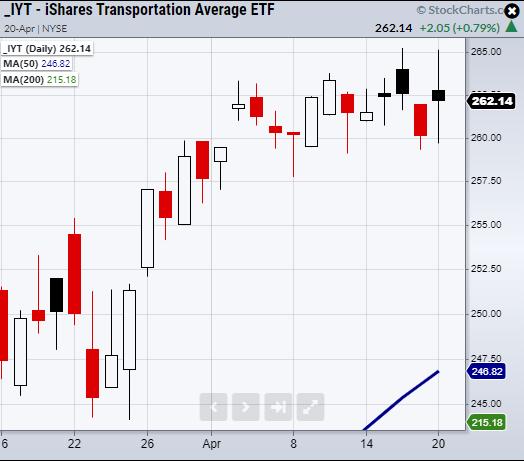
Is the Transportation Sector (IYT) the Market's Silver Lining?
On Tuesday, the transportation sector closed green on the day, while the rest of the Economic Modern Family closed red.
The most prominent break of support came from the Russell 2000 (IWM) and the Regional Banking sector (KRE). IWM fell under support at $218, while KRE fell below its 50-day...
READ MORE
MEMBERS ONLY
Sector Spotlight: The Tale of the Tails
by Julius de Kempenaer,
Senior Technical Analyst, StockCharts.com
It's all about tails on this edition of StockCharts TV's Sector Spotlight. After a short look at last week's rotations for asset classes and sectors, I dive into the meaning of the tails on the Relative Rotation Graphs. What do they represent? How to...
READ MORE
