MEMBERS ONLY
This Time-Tested Theory is Screaming To Buy NOW

by Tom Bowley,
Chief Market Strategist, EarningsBeats.com
I know it was a rough week last week; I only need to take one look at my own portfolio to figure that out. But the stock market doesn't go up in a straight line. There will ALWAYS be pullbacks. But be careful which "stories" you...
READ MORE
MEMBERS ONLY
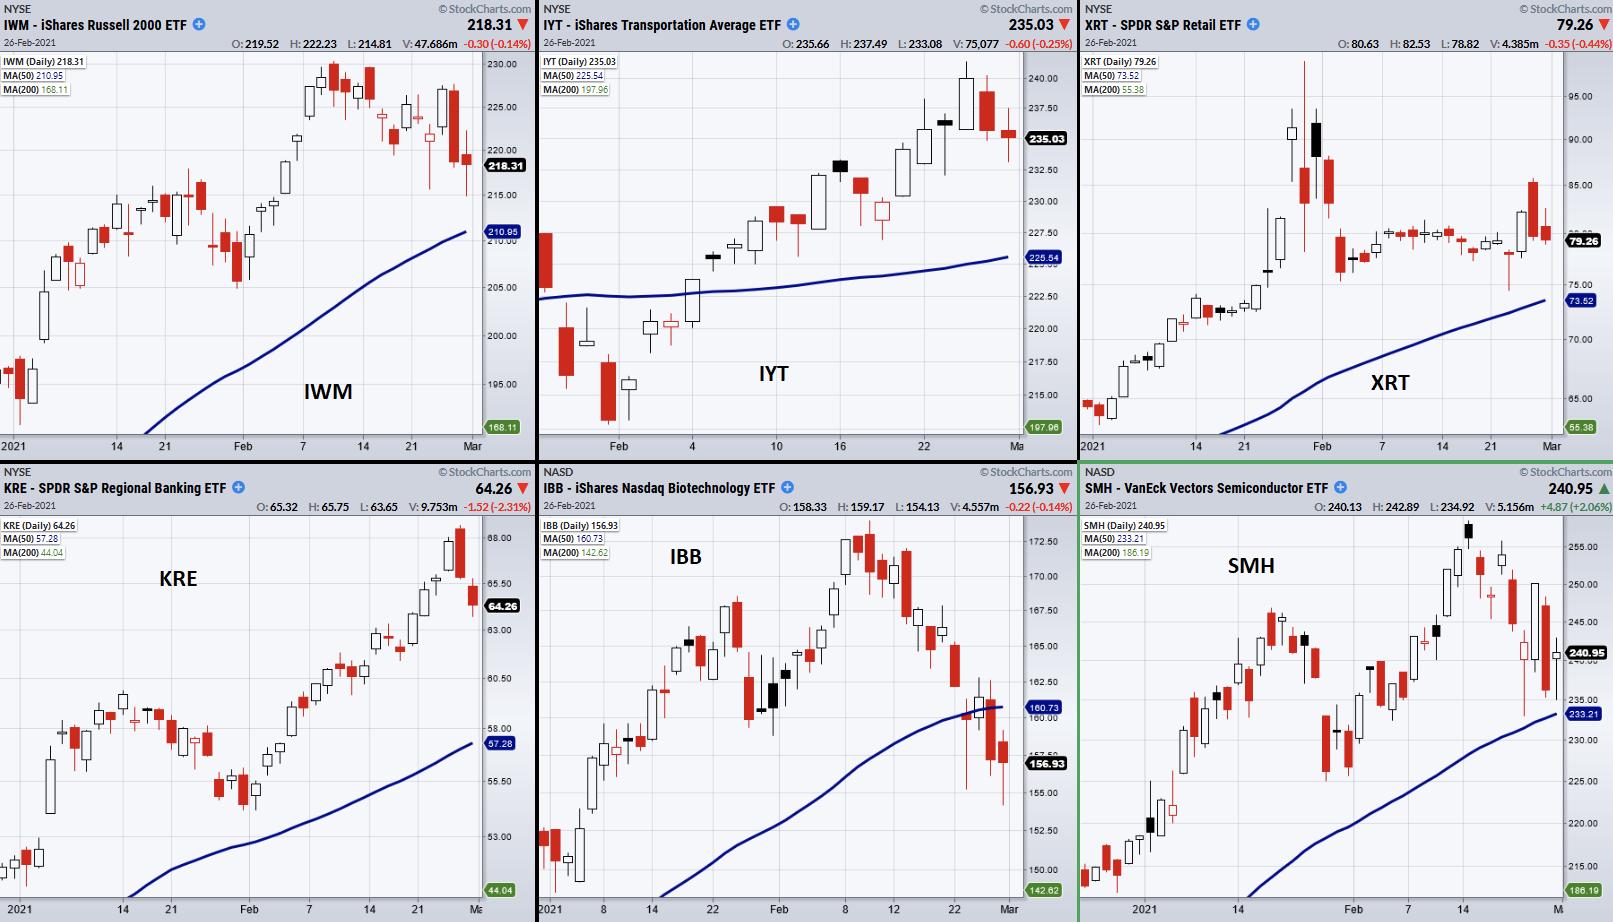
Using the Economic Modern Family to Plan Ahead
With all but one member of the Economic Modern Family in a bullish phase, should we be worried? Or does Monday hold the next piece of pivotal price action?
Before we attempt to answer this question, we should first know where each member stands and if anyone sits in a...
READ MORE
MEMBERS ONLY

Where's Support in this Tough Market?

by Mary Ellen McGonagle,
President, MEM Investment Research
In this episode of StockCharts TV'sThe MEM Edge, Mary Ellen reviews areas of the market and stocks that will help buffer you from the selloff in Growth stocks. She also covers eye-opening base breakouts in a tough market environment.
This video was originally recorded on February 26th, 2021....
READ MORE
MEMBERS ONLY
When the Tails are Diverging, Opportunities Arise

by Julius de Kempenaer,
Senior Technical Analyst, StockCharts.com
Last week, Friday 2/19, Tom Bowley invited me to be his guest in a webinar he did with EarningsBeats.com.
Of course, I talked about RRG in general and we applied it to international markets, crypto-currencies and US sectors. All good fun. After I presented my bit on sectors...
READ MORE
MEMBERS ONLY

Chartwise Women: Shortcuts to Spot Top Performers
by Mary Ellen McGonagle,
President, MEM Investment Research

by Erin Swenlin,
Vice President, DecisionPoint.com
In this week's edition of Chartwise Women, Erin and Mary Ellen show how you can find the best performers in the market using Relative Strength and the StockCharts Technical Rank (SCTR). Erin educates us on what "price relative" is and how to include it on your...
READ MORE
MEMBERS ONLY

SPIKE IN BOND YIELDS PUSHES STOCKS LOWER -- QQQ TRADES BELOW 50-DAY LINE

by John Murphy,
Chief Technical Analyst, StockCharts.com
10-YEAR YIELD REACHES 1.50%... The 10-Year Treasury yield is spiking above 1.50% today for the first time in a year. The size and speed of the yield advance is putting downside pressure on stocks, and technology stocks in particular. Chart 1 shows the Invesco QQQ Trust trading below...
READ MORE
MEMBERS ONLY

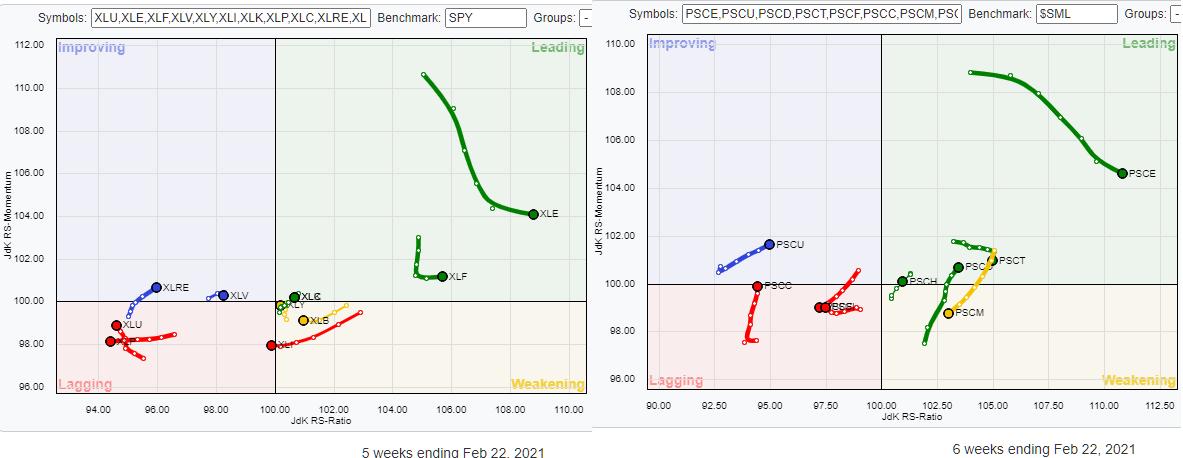
Value Small Caps Are Breaking to New Highs
by Julius de Kempenaer,
Senior Technical Analyst, StockCharts.com
One of the predefined RRGs allows you to bring up a universe of growth, value and size indexes, and this can help you to spot how the various parts of the market are positioned against each other and how they are rotating.
Ths small RRG shows the tail of the...
READ MORE
MEMBERS ONLY

The Importance of the 50-Day Moving Average
On Tuesday, we talked about a reversal chat pattern in the Nasdaq 100 (QQQ) that was created from the price clearing over the 50-day moving average. Although today began with price under the 50-DMA, QQQs turned around, closing over Tuesdays high. Hence, the reversal pattern has confirmed right by a...
READ MORE
MEMBERS ONLY

ROTATION FROM GROWTH TO VALUE CONTINUES AS TREASURY YIELDS HIT ANOTHER HIGH FOR THE YEAR
by John Murphy,
Chief Technical Analyst, StockCharts.com
ROTATION FROM GROWTH TO VALUE... One of the side-effects of rising bond yields has been a rotation out of technology-dominated growth shares into more cyclical value shares. Chart 1 shows the S&P 500 Growth iShares (IVW) pulling back over the last week and trying to stay above its...
READ MORE
MEMBERS ONLY

Sector Spotlight: Seasonal Surprise for XLRE
by Julius de Kempenaer,
Senior Technical Analyst, StockCharts.com
In this edition of StockCharts TV's Sector Spotlight, since it's the last Tuesday of the month, I dive into the seasonal outlook for the month(s) ahead. Communication Services seems on track with its current rotation on the Relative Rotation Graph. But a surprise could be...
READ MORE
MEMBERS ONLY

QQQ Just Made a Rare Chart Pattern
On Tuesday, the Nasdaq 100 (QQQ) broke the 50-day moving average before the end-of-day rally brought it back over. This created a reversal pattern we like to call an expansion day.
An expansion day is formed when a large range day crosses over a major moving average, in this case...
READ MORE
MEMBERS ONLY

Five Confidence Relationships Hit Multi-Year Resistance; Breakout Would Signal Much Higher Stock Prices

by Martin Pring,
President, Pring Research
Many confidence relationships I follow have been confined to multi-year trading ranges, as investors have consistently swung between optimism and fear. The latest data show that many have rallied sharply and reached the upper region of this rangebound activity. That either means it's time to regroup and launch...
READ MORE
MEMBERS ONLY

Communication Services on Seasonal Track
by Julius de Kempenaer,
Senior Technical Analyst, StockCharts.com
Looking at the 3-D seasonality chart above, most of the sectors have a 50/50 history of outperforming SPY in the coming month of March.
Both Communication Services and Consumer Discretionary are showing an upcoming string of months that are historically strong for them. XLC starts with 62% in March,...
READ MORE
MEMBERS ONLY

DP TV: Hot Sectors and Industry Groups
by Erin Swenlin,
Vice President, DecisionPoint.com

by Carl Swenlin,
President and Founder, DecisionPoint.com
In this episode of DecisionPoint, Carl and Erin present their unique analysis of the market. Carl concentrates on the SPY and "The Big Four" - Dollar, Gold, Crude Oil and Bonds. Erin zeroes in on the best sectors going into the next week, then focuses in on the...
READ MORE
MEMBERS ONLY
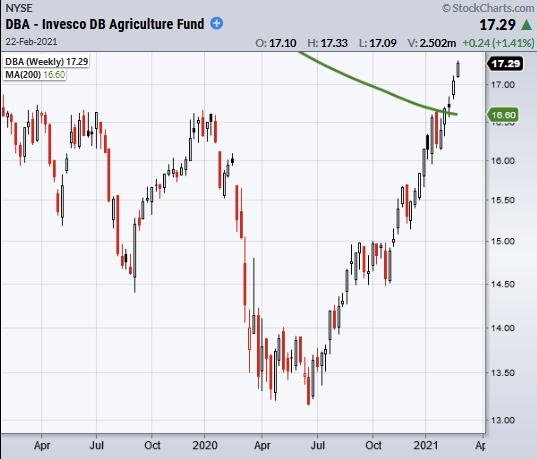
The Soft Commodities Make a Big Move
The pandemic has brought a multitude of supply chain disruptions reaching not only into the tech space, but also into the agricultural space.
The Invesco Agricultural Fund (DBA) recently cleared major resistance at 16.87 from the 200-week moving average, plus resistance going back from highs of 2019. Participating in...
READ MORE
MEMBERS ONLY
It's DRAFT Day! Another Quarter Is In The Books
by Tom Bowley,
Chief Market Strategist, EarningsBeats.com
This is an exciting day for EarningsBeats.com and its members. It's the day when we select the 10 equal-weighted stocks for each of our 4 portfolios - Model, Aggressive, Income, and Strong AD. Portfolio results-to-date have been superb and you can check out our holdings the past...
READ MORE
MEMBERS ONLY
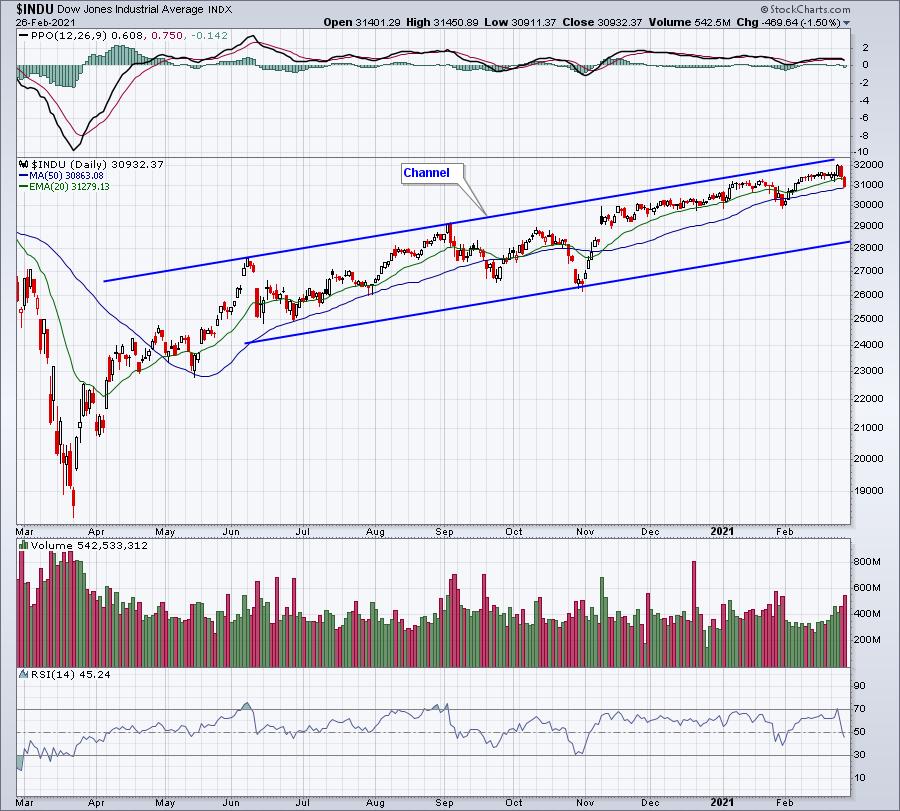
A Major Theme That Will Carry Equities Higher
by Tom Bowley,
Chief Market Strategist, EarningsBeats.com
I believe the bull market vs. bear market debate has ended. We've been through a trade war, 100-year pandemic, an economic shutdown, a very divisive political battle, mountains of debt, etc., and where do we stand? At an all-time high. That should convince you that we're...
READ MORE
MEMBERS ONLY
Big Market Shift Underway?
by Mary Ellen McGonagle,
President, MEM Investment Research
In this episode of StockCharts TV'sThe MEM Edge, Mary Ellen shares new groups that are coming into favor while recently leading areas come under pressure. She also reviews currently attractive stocks, as well as how to tell if your stock is pulling back or has more downside ahead....
READ MORE
MEMBERS ONLY

Two Growing Sectors with Huge Potential
Despite worry of a pending market correction, talks of stimulus and an infrastructure package paired with a supportive Federal Reserve helped boost market morale this week. However, specific sectors which suffered are now looking to make a comeback and, with correct positioning, anyone can jump on the trend train.
From...
READ MORE
MEMBERS ONLY
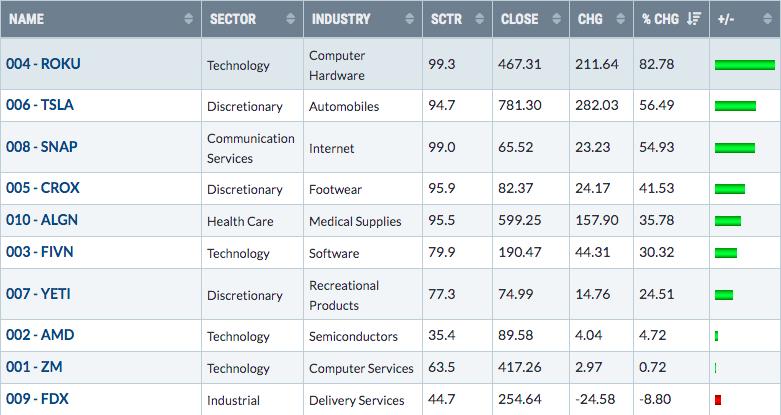
Want a Semiconductor? Try This One Instead of That One
by Erin Swenlin,
Vice President, DecisionPoint.com
Semiconductors are outperforming the market, but not all Semiconductors are enjoying the strong rally that's been ongoing since September. Some of the more popular names have underperformed within their industry group and against the SPX. However, two are outshining the rest and have room to move higher.
Looking...
READ MORE
MEMBERS ONLY
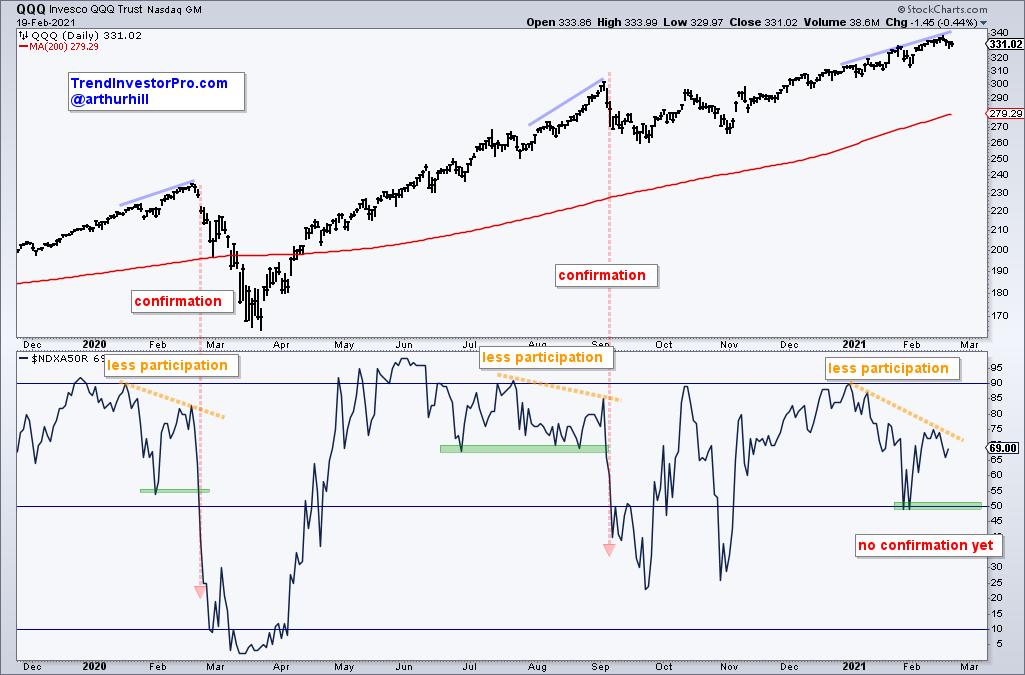
A Medium-term Breadth Indicator Waves the Caution Flag

by Arthur Hill,
Chief Technical Strategist, TrendInvestorPro.com
The Nasdaq 100 has been on a tear the last few months with a move to new highs, but a medium-term breadth indicator is not keeping pace here in February. This indicator is simply flashing the yellow caution sign right now and we have yet to see an actual signal...
READ MORE
MEMBERS ONLY

TRANSPORTS HIT NEW HIGHS -- WHILE UTILITIES REMAIN WEAK
by John Murphy,
Chief Technical Analyst, StockCharts.com
DOW TRANSPORTS HIT NEW RECORD...While looking through today's sector charts, I was struck by the differing performance between transportation stocks and utilities. And that difference should carry good news for stocks in general. Chart 1 shows the Dow Jones Transportation Average rising into record territory today. It&...
READ MORE
MEMBERS ONLY
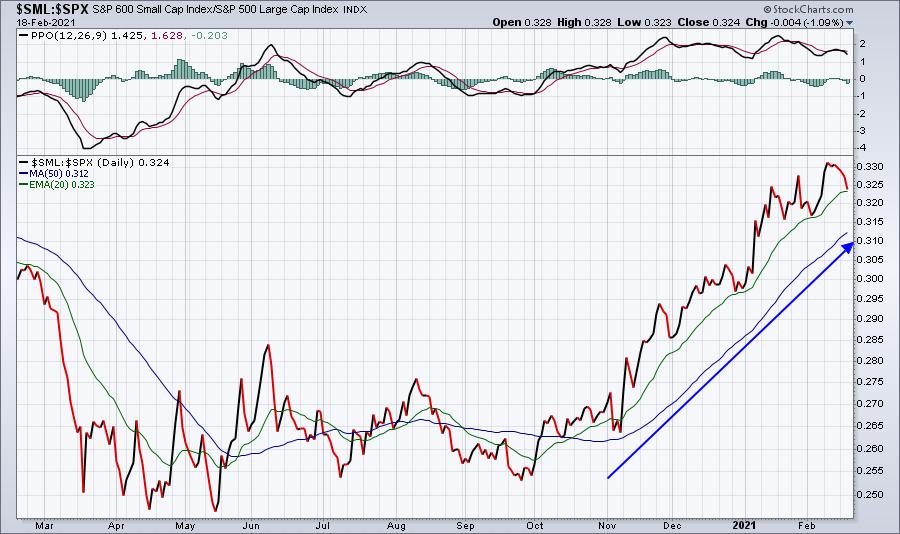
Rotation To Small Caps Continues
by Tom Bowley,
Chief Market Strategist, EarningsBeats.com
We've seen a hiccup the past few days, but overall money has rotated strongly into small caps. There are a couple ways to visualize this rotation. I tend to use price relative charts so that I can view the relative momentum on a historical basis. To do this,...
READ MORE
MEMBERS ONLY
Chartwise Women: Exciting Recovery Stock Momentum
by Mary Ellen McGonagle,
President, MEM Investment Research
by Erin Swenlin,
Vice President, DecisionPoint.com
In this week's edition of Chartwise Women, Mary Ellen and Erin share their wishlist plans for the eventual post-pandemic period and the stocks that tie in with their dream trips! They also review their favorite Oil stocks, as well as the recently strong rally in Energy.
This video...
READ MORE
MEMBERS ONLY
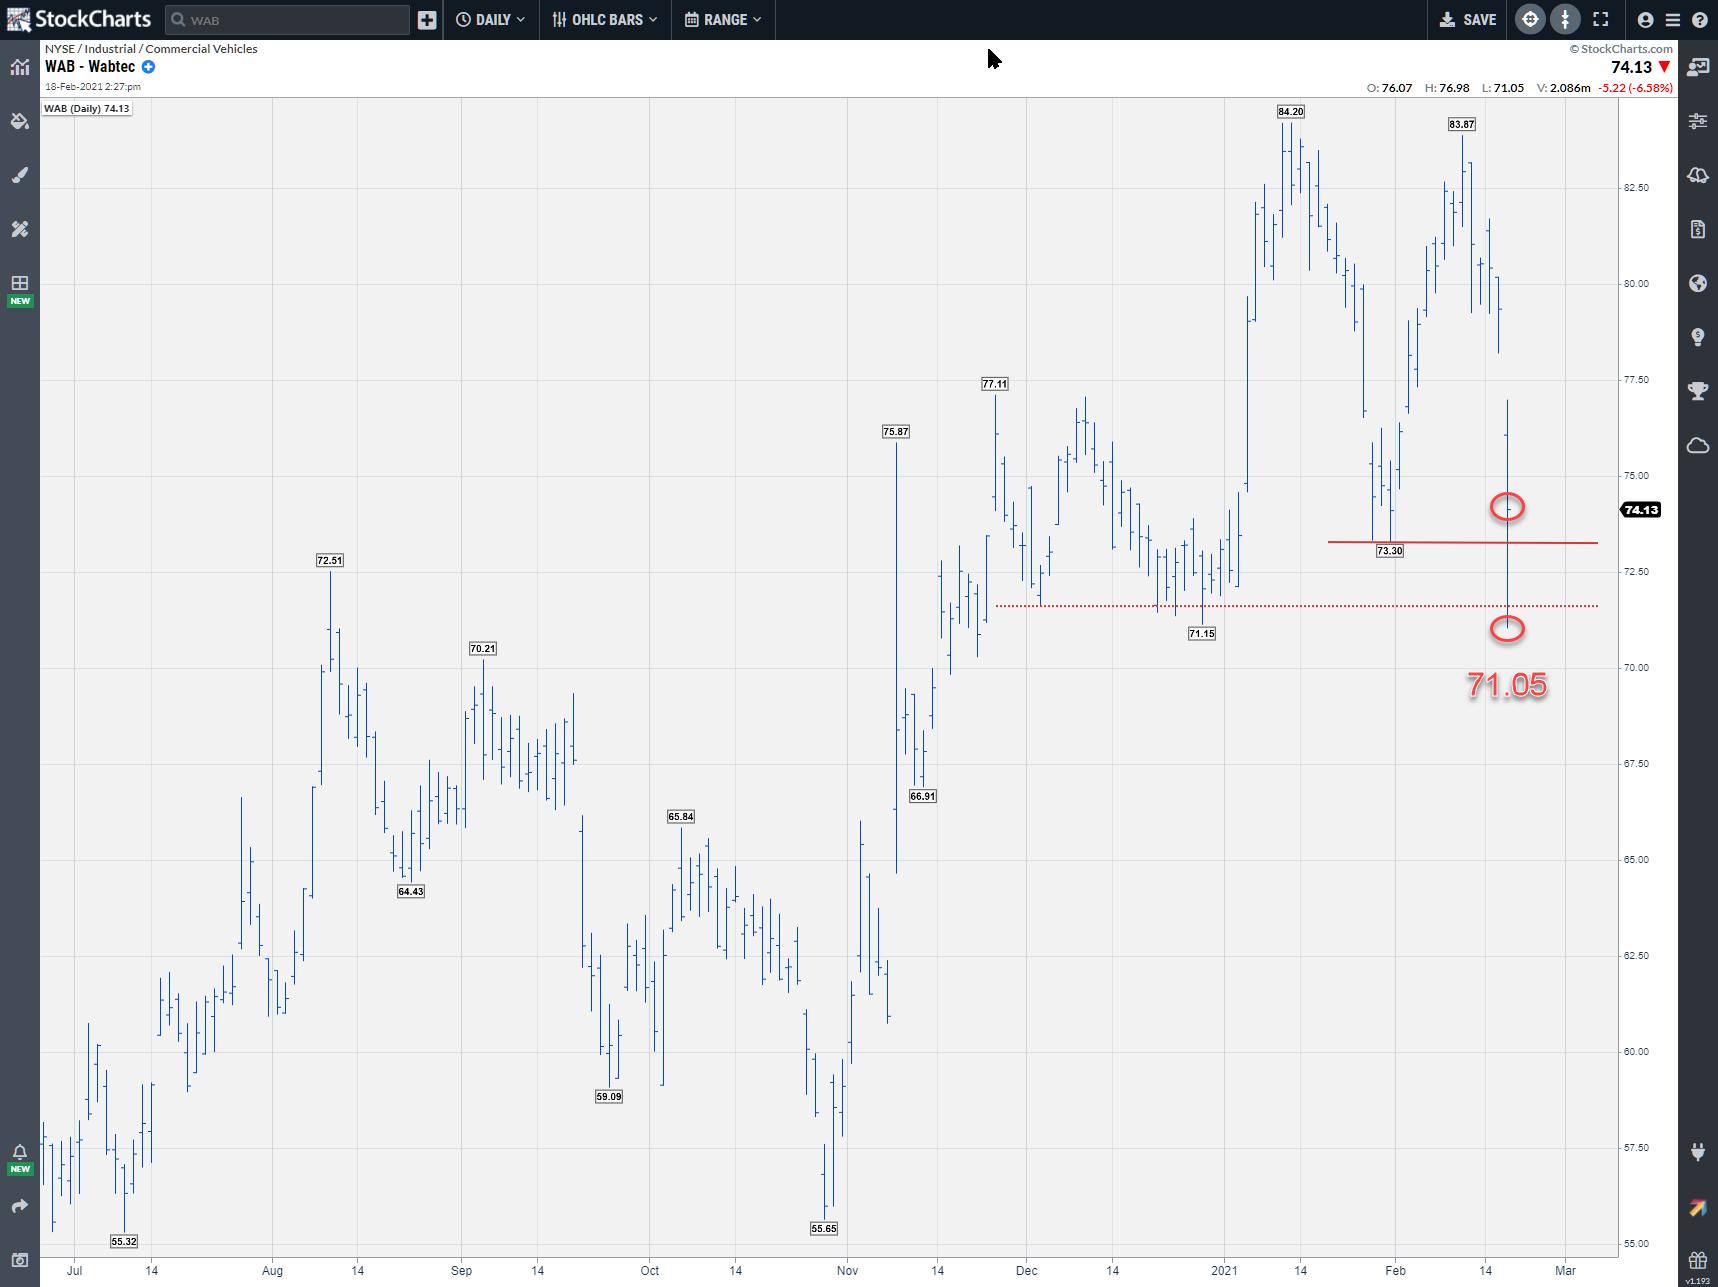
WAB Triggers Turtle Soup Buy Setup
by Julius de Kempenaer,
Senior Technical Analyst, StockCharts.com
One of the BIG improvements or advantages in ACP is the fact that I can run a scan in the side-bar, then immediately click on the symbol to bring up the chart.
One of the scans that I use frequently is the 'Turtle Soup" scan on intraday data....
READ MORE
MEMBERS ONLY
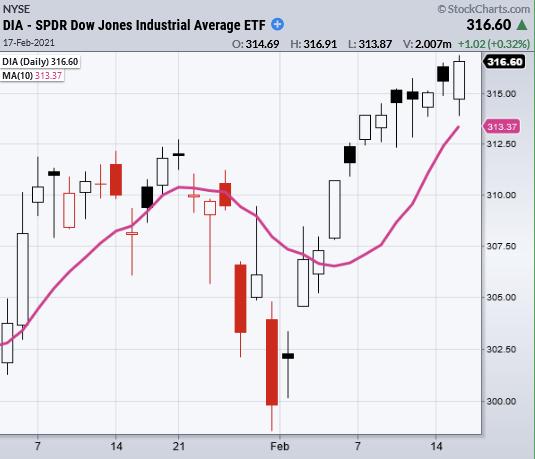
Where are the Market's Key Support Levels?
Wednesday could be a pivotal day for the market. With a gap down in the major indices, the market continued to sell-off until finding some late-day support, especially in the Dow, which closed green.
A key to what happens from here over the next few days could be decided on...
READ MORE
MEMBERS ONLY

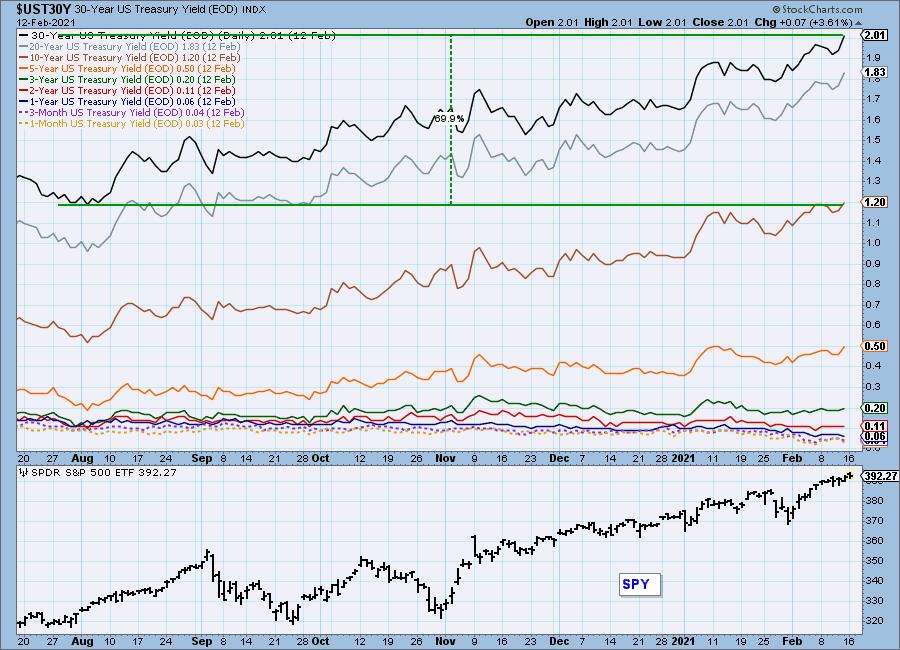
10-YEAR TREASURY YIELD IS NEARING SOME OVERHEAD RESISTANCE BARRIERS
by John Murphy,
Chief Technical Analyst, StockCharts.com
POTENTIAL BOND YIELD RESISTANCE...The recent upmove in bond yields is attracting the attention of bond and stock holders. It's obviously negative for bond prices. But it could lead to some selling of stocks if bond yields were to climb too far too fast. So let's...
READ MORE
MEMBERS ONLY

Is Oil Just Getting Started?
News surfaced Tuesday about stress on oil production from the recent temperature drop in the U.S. Because water is involved in oil production, it can freeze equipment, thereby halting the process. Does this mean oil will continue to increase in price from a temporary weather condition? Possibly, but, by...
READ MORE
MEMBERS ONLY
Sector Spotlight: This Bull Has Legs to Run
by Julius de Kempenaer,
Senior Technical Analyst, StockCharts.com
In this edition of StockCharts TV's Sector Spotlight, after a review of last week's rotations in asset classes and sectors, I take a deep dive into the Sector Rotation Model, bringing together all different elements of the Sector Rotation Model using Relative Rotation Graphs to gauge...
READ MORE
MEMBERS ONLY

RISING BOND YIELDS BOOST FINANCIALS -- BANK SPDRS TOUCH NEW RECORDS
by John Murphy,
Chief Technical Analyst, StockCharts.com
FINANCIAL SPDR HITS NEW RECORD...Energy and financials are the day's two strongest sectors. Freezing temperatures across the U.S. are pushing energy prices higher today and energy stocks along with them. Financials are also having a strong day courtesy of another jump in Treasury bond yields. Chart...
READ MORE
MEMBERS ONLY
"It's not nice to fool Mother Nature!"
by Carl Swenlin,
President and Founder, DecisionPoint.com
In the venerable
Click here to register in advance for the recurring free DecisionPoint Trading Room! Recordings are available!
Happy Charting! - Carl
Technical Analysis is a windsock, not a crystal ball.
Helpful DecisionPoint Links:
DecisionPoint Alert Chart List
DecisionPoint Golden Cross/Silver Cross Index Chart List
DecisionPoint...
READ MORE
MEMBERS ONLY
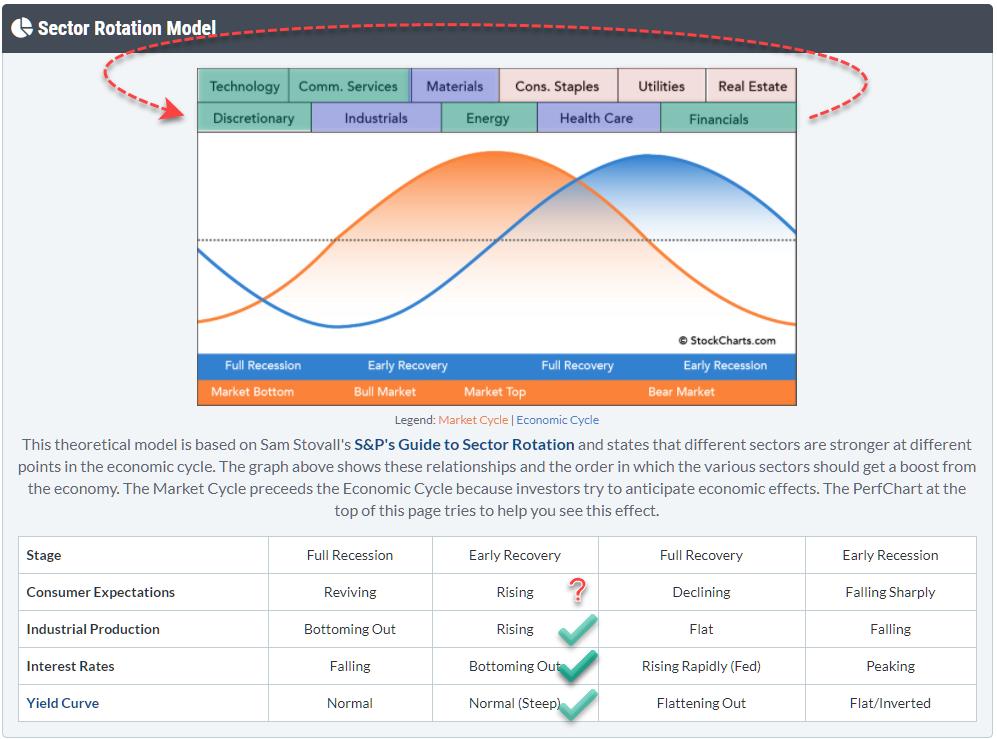
Using RRG to Find a Match Between Theory and Reality
by Julius de Kempenaer,
Senior Technical Analyst, StockCharts.com
This article appeared in last weekend's ChartWatchers newsletter with the title "Sector Rotation Model Suggests Bull Market in Stocks Ongoing". As I feel that it is one of the more important/better articles showing how to use Relative Rotation Graphs in combination with other analysis techniques,...
READ MORE
MEMBERS ONLY
DP TV: Golden Cross & Silver Cross Indexes
by Erin Swenlin,
Vice President, DecisionPoint.com
In 2020, Carl Swenlin developed two new indicators - the Golden Cross & Silver Cross indexes that many aren't aware of. These powerful indicators help you determine "participation" in rallies and declines within an index or sector. We can use them to determine relative strength amongst...
READ MORE
MEMBERS ONLY

Forget the Speculation and Uncertainty as these Short-Term Indicators are Bullish
by Martin Pring,
President, Pring Research
A few weeks ago I wrote an article entitled "Only a Fool Tries to Call a Correction in a Bull Market, So Here Goes!" Okay, so we did get a 4% drop in the Dow over a seven day period, but hardly anything worth worrying about. It reiterated...
READ MORE
MEMBERS ONLY

An Industrials ETF with More Juice than XLI
by Arthur Hill,
Chief Technical Strategist, TrendInvestorPro.com
Not all ETFs are created equal and the name does not always tell the entire story. One would think that the Industrials SPDR (XLI) and the Industrials iShares (IYJ) are similar in makeup and performance. This is not the case because one has a clear edge over the other.
The...
READ MORE
MEMBERS ONLY

Why Friday's Drop On VIX Below 20 Is Significant
by Tom Bowley,
Chief Market Strategist, EarningsBeats.com
Happy Valentine's Day!
The Volatility Index ($VIX) is one of the sentiment indicators that I pay close attention to. So many sentiment readings deal with "feelings", which I tend to discard. I want to know what is actually going on with THE MONEY. Don't...
READ MORE
MEMBERS ONLY

Week Ahead: Overstretched NIFTY Needs to Note These Technical Factors; RRG Charts Show These Sectors Favorably Placed

by Milan Vaishnav,
Founder and Technical Analyst, EquityResearch.asia and ChartWizard.ae
Following a strong earlier week, the previous week saw some extension of the up move as the NIFTY ended on a positive note. Most of the past five sessions saw the index trading in a capped range with limited upsides. Unlike the earlier week, which had a very wide-ranging move,...
READ MORE
MEMBERS ONLY
Explaining Our Investing Methodology Prior To Our Next "DRAFT"
by Tom Bowley,
Chief Market Strategist, EarningsBeats.com
When we go through our quarterly portfolio "draft" at EarningsBeats.com, we take a top down approach. We first evaluate the overall market to determine if we're bullish, neutral, or bearish. Clearly, we're bullish. The S&P 500 closed at an all-time high...
READ MORE
MEMBERS ONLY
Supply-Demand Issues Are Pushing Stocks In This Group Much Higher
by Mary Ellen McGonagle,
President, MEM Investment Research
The markets are continuing to hit a new high amid stimulus hopes and a slowly improving economy. Add an accommodative Federal Reserve and the rolling out of a Covid-19 vaccine worldwide, and it's certainly easy to make a case for this bull market.
Select areas are faring much...
READ MORE
MEMBERS ONLY
Using Short-Term Momentum to Define the Primary Trend Direction of Stocks, Bonds and the Dollar
by Martin Pring,
President, Pring Research
They say that a rising tide lifts all boats, and so it is with freely traded markets. In the boating world, you can spot a rising tide with a steadily rising boat, but, with markets, the simplest approach is to observe a series of rising peaks and troughs. However, there...
READ MORE
