MEMBERS ONLY

Short Stoppers: From GameStop to Silver

by Erin Swenlin,
Vice President, DecisionPoint.com

by Carl Swenlin,
President and Founder, DecisionPoint.com
In this episode of DecisionPoint, Carl begins with the topic of the GameStop (GME) short kill, coining the phrase "Short Stoppers" - and news suggests that the Short Stoppers are moving their interest to Silver. Carl looks at the Silver chart and discusses the implications. Erin takes a...
READ MORE
MEMBERS ONLY
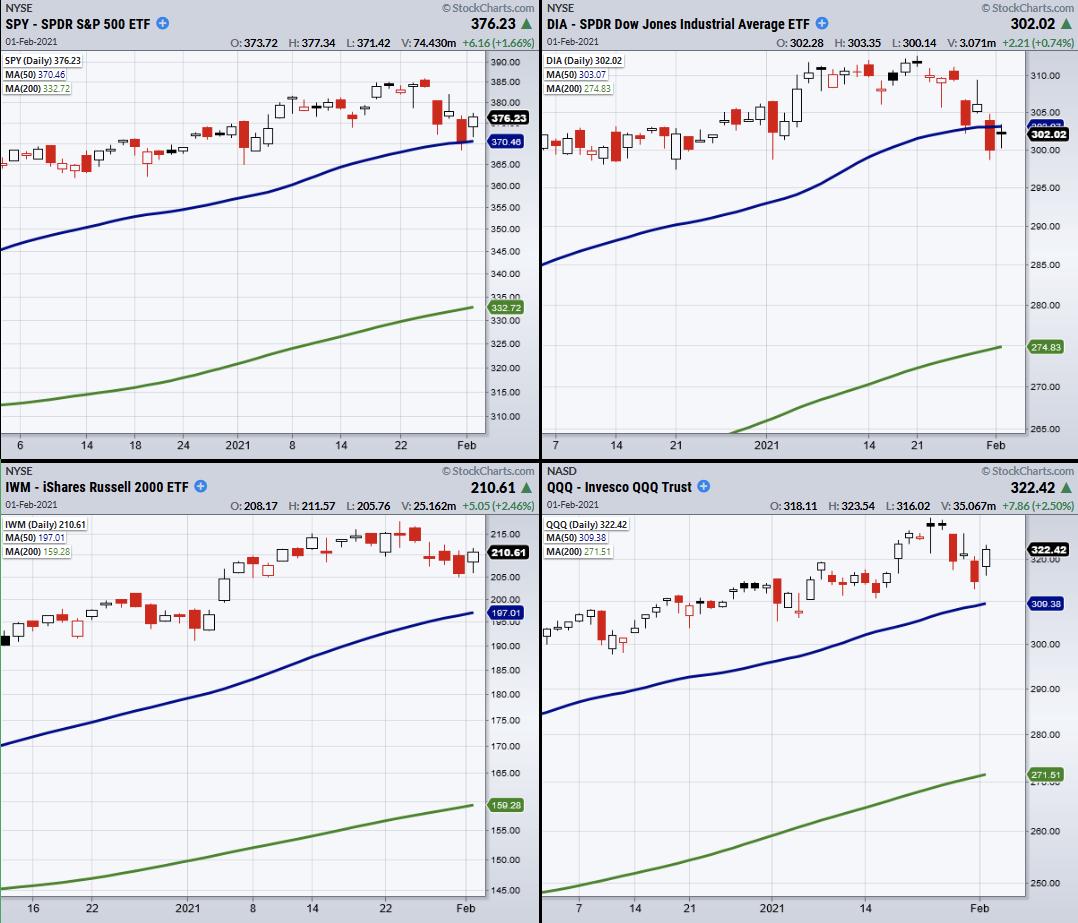
Mixed Technical Picture in the Market Indices
Dow Jones (DIA) sits alone under the 50-day moving average, while his friends, Russell 2000 (IWM), Nasdaq 100 (QQQ) and S&P 500 (SPY) cleared Friday's highs and remain above their 50-DMAs. Though only the DIA ended under the 50-day moving average, it still had an inside...
READ MORE
MEMBERS ONLY

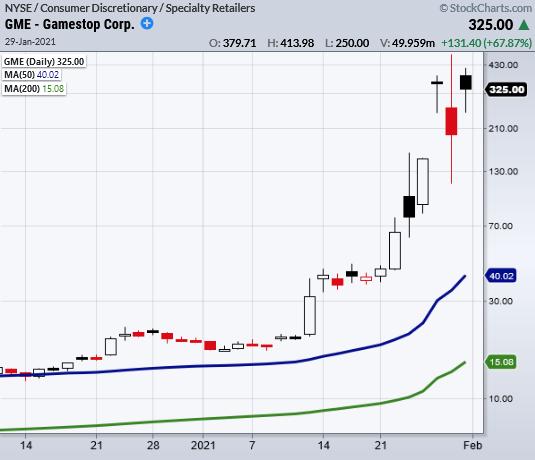
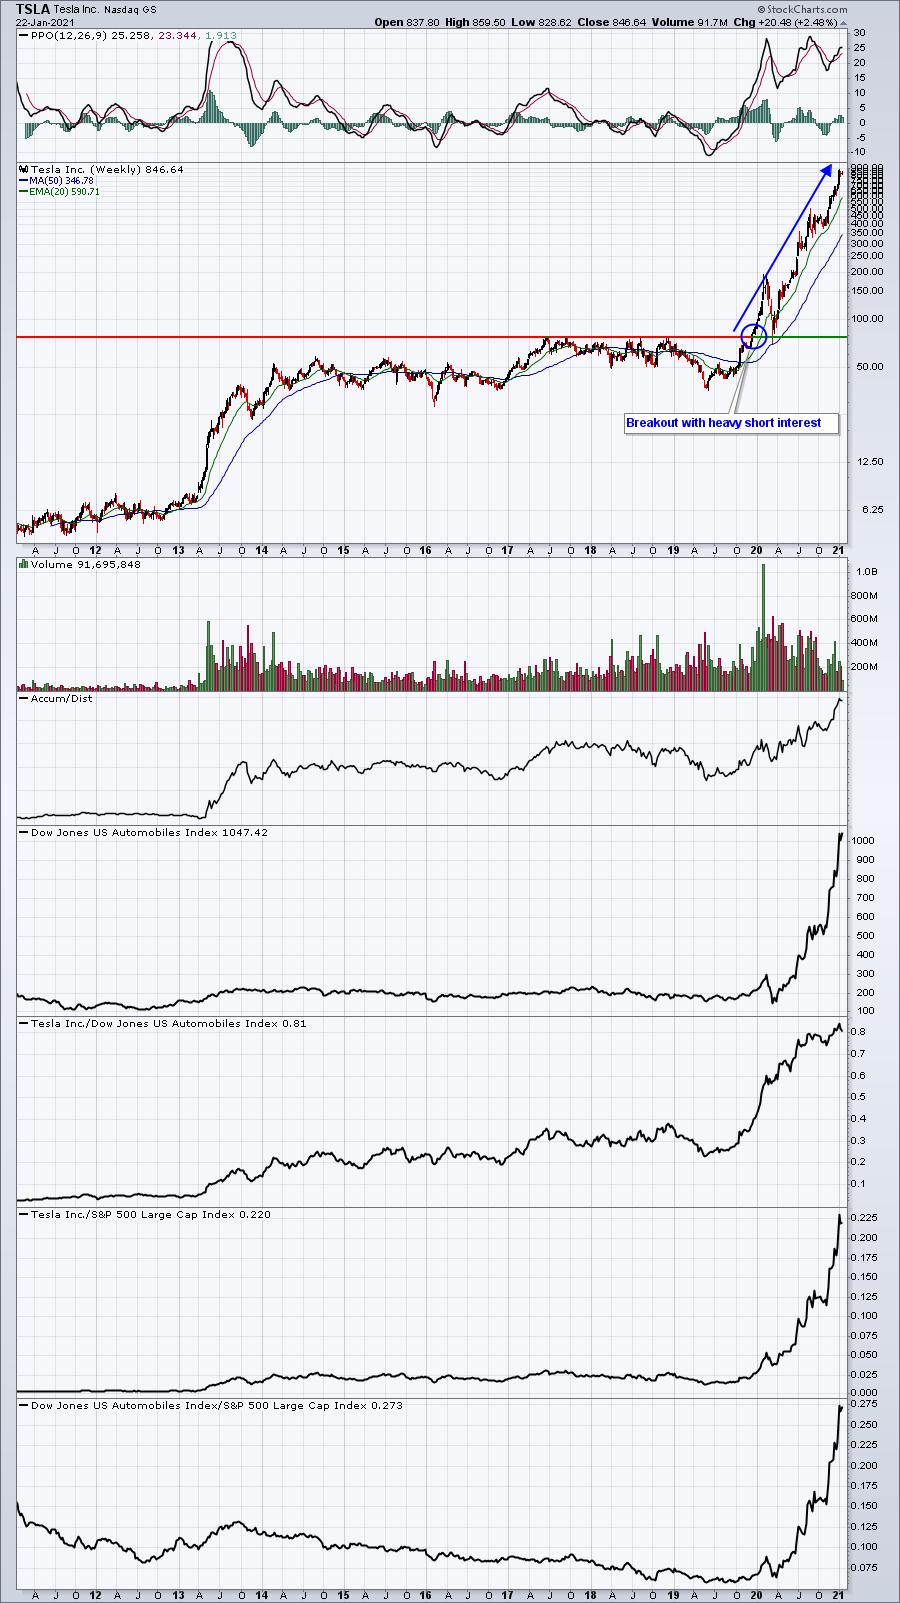
Gamestop (GME) "Short Stoppers" Move On to Silver
by Erin Swenlin,
Vice President, DecisionPoint.com
I have had many people (my children included) ask me about the GameStop phenomena. Carl called them "gamestoppers", but decided that "Short Stoppers" was a more apt name given they have moved on to other targets.
There is something alluring about putting the "big guys&...
READ MORE
MEMBERS ONLY

TECHNOLOGY LEADING MARKET HIGHER -- A LOOK AT THE BIGGEST TECHS -- SILVER SQUEEZE?

by John Murphy,
Chief Technical Analyst, StockCharts.com
TECHNOLOGY STOCKS LEAD MARKET HIGHER ... Technology stocks are the strongest sector in a strong market day. The Technology SPDR (XLK) is trading nearly 3% higher today. The biggest tech stocks are also having a strong day. Chart 1 shows Apple gaining nearly 2% while keeping its uptrend intact. Chart 2...
READ MORE
MEMBERS ONLY

Advance-Decline Lines Suggest Further Downside

by David Keller,
President and Chief Strategist, Sierra Alpha Research
I've spoken recently of the bearish divergences emerging from breadth indicators, including the anemic new 52-week highs list, as well as a breakdown in the percent of stocks trading above their 50-day moving averages.
As we recorded Friday's episode of The Final Bar, it appeared that...
READ MORE
MEMBERS ONLY

Reddit or Not, Short Sellers Get Squeezed

by Bruce Fraser,
Industry-leading "Wyckoffian"
Richard D. Wyckoff was on a mission to discover the ‘Real Rules of the Game' for success on Wall Street. He understood that public investors and traders were not profitable in their speculative activities and, in fact, were being preyed upon by large stock market operators. Mr. Wyckoff devoted...
READ MORE
MEMBERS ONLY

SOXX Follows Overbought Extreme with Outsized Decline

by Arthur Hill,
Chief Technical Strategist, TrendInvestorPro.com
Last weekend's post showed the Semiconductor ETF (SOXX) with a 10 day overbought streak and several ETFs with even bigger overbought streaks. These streaks came to an end this week as SOXX fell 6.21%, its biggest weekly decline since mid March. As measured by Normalized ROC, this...
READ MORE
MEMBERS ONLY
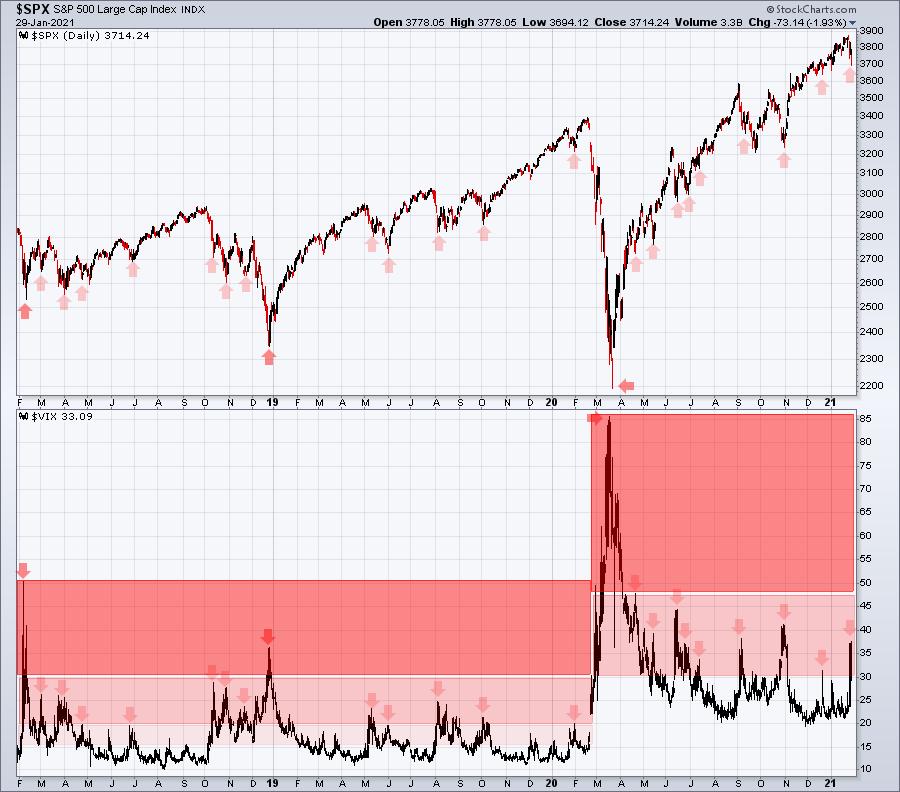
Let The VIX Mark The Bottom

by Tom Bowley,
Chief Market Strategist, EarningsBeats.com
There are a number of sentiment indicators in the stock market, but I prefer those that indicate the panic taking place "at the moment", rather than those depicting "feelings". So I've always used the Volatility Index ($VIX) and equity only put call ratio ($CPCE)...
READ MORE
MEMBERS ONLY

Week Ahead: Markets Approaches Union Budget on a Relatively Lighter Note; Prefer These Sectors for a Better Risk-Reward Proposition

by Milan Vaishnav,
Founder and Technical Analyst, EquityResearch.asia and ChartWizard.ae
In what remained one of the worst weekly and monthly performances in recent times, the Indian equity markets witnessed heavy profit-taking throughout the week. The markets had a phenomenal run over the previous months; however, over the past week, it had shown some signs of taking a breather. The past...
READ MORE
MEMBERS ONLY
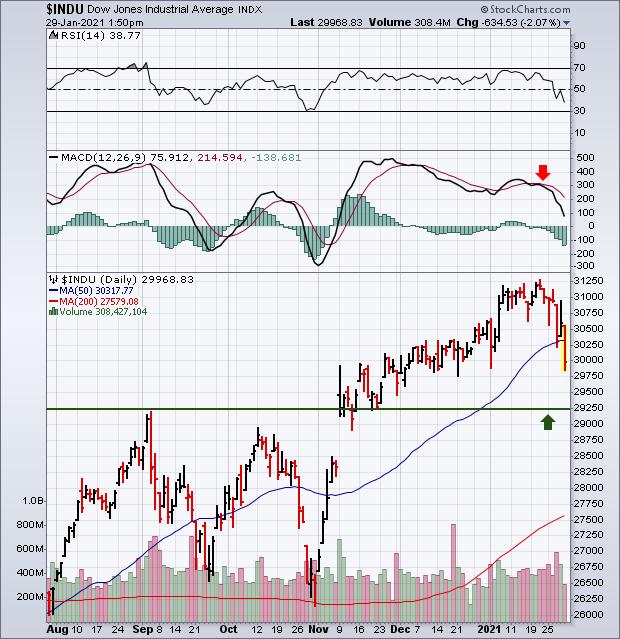
GameStop Mania May Be Contributing to Selling
by John Murphy,
Chief Technical Analyst, StockCharts.com
Stock indexes remain under pressure again today and are pressuring moving average lines. Chart 1 shows the Dow Industrials falling below its 50-day moving average for the first time since early November. It may be headed for a test of a potential support line drawn over its early September high....
READ MORE
MEMBERS ONLY
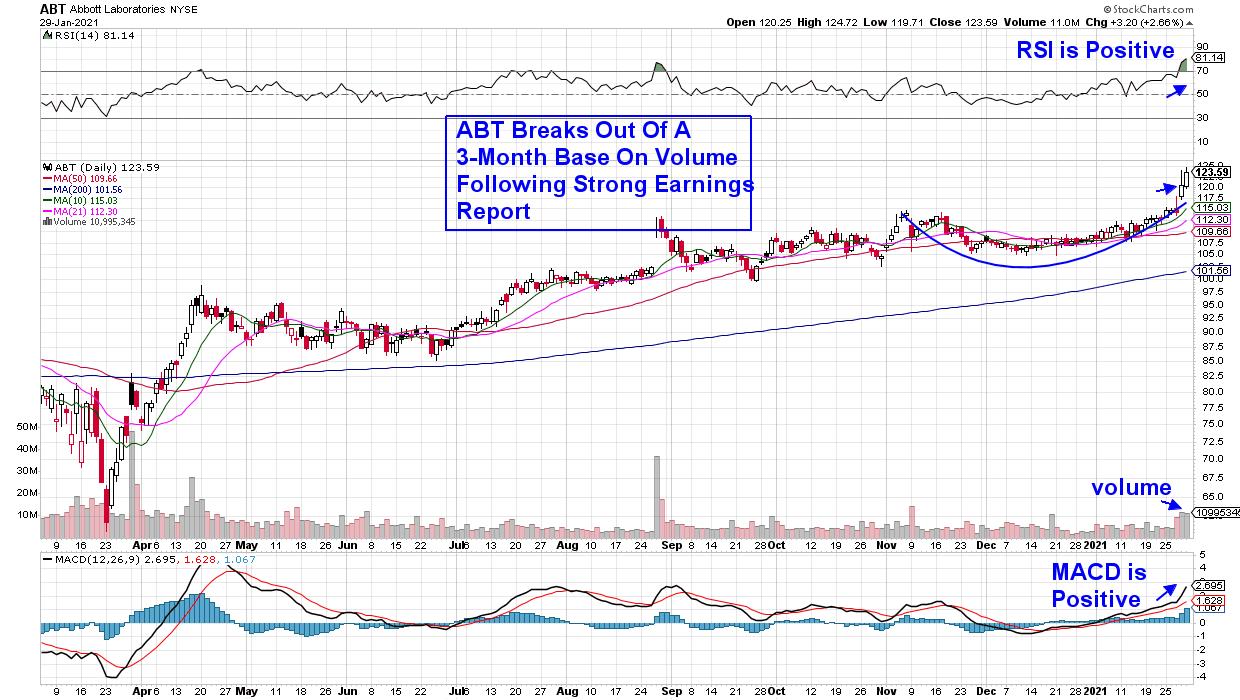
Regardless Where the Markets Head, These Stocks are Poised to Trade Higher

by Mary Ellen McGonagle,
President, MEM Investment Research
This week's 3.2% decline in the S&P 500 has this Index closing at a very important area of support, as investor confidence has been shaken amid discouraging Fed comments and weak economic data. Throw in a mixed start to earnings season with cautious outlooks from...
READ MORE
MEMBERS ONLY
Advance Decline Lines Flash Warning
by David Keller,
President and Chief Strategist, Sierra Alpha Research
I've spoken recently of the bearish divergences emerging from breadth indicators,including the anemic new 52-week highs list, as well as a breakdown in the percent of stocks trading above their 50-day moving averages.
As we recorded Friday's episode of The Final Bar, it appeared that...
READ MORE
MEMBERS ONLY
WallStreetBets Storms the Financial Bastille
Out of the corner of my eye, a message pops up on my screen saying "Hold the line! Selling here means Wall Street wins!"
This is one of thousands of posts found on big social media platforms, which spurred from a Reddit page known as r/WallStreetBets (WSB)...
READ MORE
MEMBERS ONLY

Is the Market's Uptrend Over?
by Mary Ellen McGonagle,
President, MEM Investment Research
In this episode of StockCharts TV'sThe MEM Edge, Mary Ellen reviews the broader markets, as well as underlying sectors to reveal where the weakness is and what to be on the lookout for going forward. She also shares defensive stocks that are poised to trade higher, as well...
READ MORE
MEMBERS ONLY
STOP Looking For Reasons to Exit The Best Bull Market of Our Lifetime
by Tom Bowley,
Chief Market Strategist, EarningsBeats.com
Just stop.
Listen, the two key drivers to the long-term direction of the stock market are (1) earnings growth and (2) monetary policy. That's it. The rest is completely noise that you need to tune out.
Most humans are innately pessimistic. It's how we're...
READ MORE
MEMBERS ONLY

Finding Winners in a Pool of Mud

by Julius de Kempenaer,
Senior Technical Analyst, StockCharts.com
At the start of this week in my weekly StockCharts TV show Sector Spotlight, I discussed the re-emerging strength of Consumer Discretionary and Technology stocks.
In the second half of the week, markets started to shift a bit and, as usual, the question is whether this down move, which we...
READ MORE
MEMBERS ONLY

Nearly Every Stock Market Question Can Be Answered By The Tensile Trading ChartPack - Update #30 (Q4 / 2020)

by Grayson Roze,
Chief Strategist, StockCharts.com

by Gatis Roze,
Author, "Tensile Trading"
Willie Sutton, the notorious bank robber from the 1920s and 30s, was asked once by a reporter why he robbed banks. He famously replied, "Because that's where the money is." Similarly in my seminars, blogs and books, I've preached for years that achieving consistent...
READ MORE
MEMBERS ONLY

WEEKLY SECTOR RANKING SHOWS MORE CAUTION
by John Murphy,
Chief Technical Analyst, StockCharts.com
STOCKS TURN MORE DEFENSIVE...With stocks under pressure this week, it makes sense to see its eleven market sectors taking a more defensive turn as well. Chart 1 ranks the eleven market sectors from the strongest at the top to the weakest on the bottom. The first thing to notice...
READ MORE
MEMBERS ONLY

STOCKS REMAIN UNDER PRESSURE -- SOME MOVING AVERAGE LINES ARE BEING BROKEN -- GAMESTOP MANIA MAY BE CONTRIBUTING TO SELLING
by John Murphy,
Chief Technical Analyst, StockCharts.com
STOCKS TEST MOVING AVERAGE LINES... Stock indexes remain under pressure again today and are pressuring moving average lines. Chart 1 shows the Dow Industrials falling below its 50-day moving average for the first time since early November. It may be headed for a test of a potential support line drawn...
READ MORE
MEMBERS ONLY
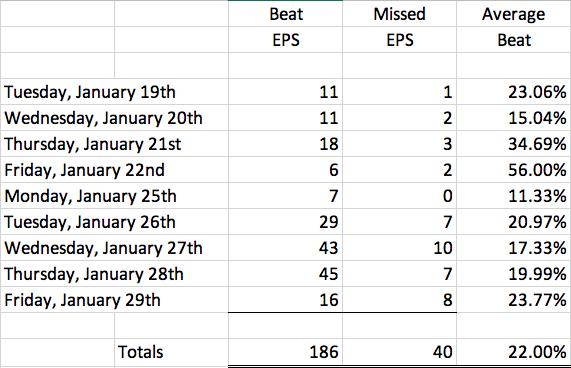
3 Small Semiconductor Stocks Looking To Report Blowout Earnings
by Tom Bowley,
Chief Market Strategist, EarningsBeats.com
You can usually tell whether a strong earnings report is upcoming simply by the way a stock is trading prior to earnings. Wall Street has one major advantage over the rest of us. They contact management teams throughout the quarter and they have a fairly strong idea how business conditions...
READ MORE
MEMBERS ONLY

Chartwise Women: Time to Play Defense in the Market
by Mary Ellen McGonagle,
President, MEM Investment Research
by Erin Swenlin,
Vice President, DecisionPoint.com
In this week's edition of Chartwise Women, Erin and Mary Ellen bring in a football theme, as it is likely time to start playing defense in your portfolio. Erin reviews sector rotation and where the markets are currently. Both share their favorite "defensive plays" and discussed...
READ MORE
MEMBERS ONLY
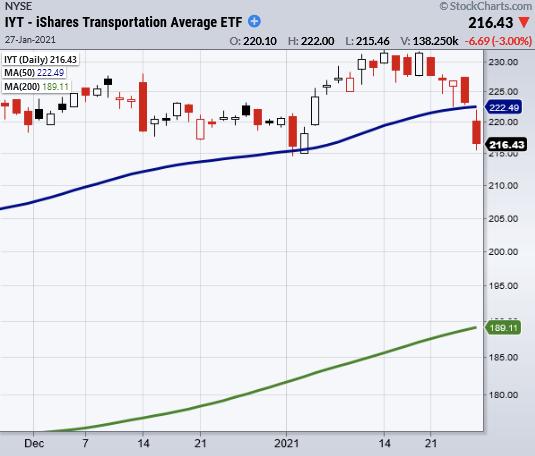
Has Transportation (IYT) Confirmed a Warning Signal?
The GameStop (GME) saga continues as a Reddit page known as r/WallStreetBets and its members of small-time traders have pushed GME through another round of all time highs. Their influence and constant stream of messages throughout social media have reached even Elon Musk, who posted a tweet late Tuesday...
READ MORE
MEMBERS ONLY

Long-Term Interest Rates Getting Close to an Upside Breakout

by Martin Pring,
President, Pring Research
The Fed has pledged to keep short-term rates around zero for an extended period. That's certainly in their power, and Chart 1, which features the 3-month Libor, indicates no sign of life. There is also quite a distance between the latest plot and its 12-month MA. At this...
READ MORE
MEMBERS ONLY

STOCKS UNDERGO SOME PROFIT-TAKING -- SOME MACD DIVERGENCES TO WATCH
by John Murphy,
Chief Technical Analyst, StockCharts.com
DAILY MACD LINES SHOW NEGATIVE DIVERGENCE... Stocks are undergoing some profit-taking today in a market that looks stretched on the upside. One of the factors that concerns me is the relatively weak performance by daily MACD lines. Chart 1 overlays the MACD lines on a daily chart of the S&...
READ MORE
MEMBERS ONLY

A Simple Trick for Buying Short Squeezes Like BBBY and GME
Short squeezes and high-risk trades have been all the rage in the media, with stocks like GameStop (GME) and Bed Bath & Beyond (BBBY) flying up to unthinkable daily prices. But how can you profit from a short squeeze if you think a company is being targeted by a large...
READ MORE
MEMBERS ONLY

Sector Spotlight: AMZN Ready to Lead Rotation
by Julius de Kempenaer,
Senior Technical Analyst, StockCharts.com
In this edition of StockCharts TV's Sector Spotlight, I look at current rotations in asset classes and sectors and highlight some changes in relative movements against the S&P 500 index. After the break, I bring up my 3-D visualization of (sector) seasonality and see if any...
READ MORE
MEMBERS ONLY

(Big) Tech is Back on Track
by Julius de Kempenaer,
Senior Technical Analyst, StockCharts.com
The Relative Rotation Graph for US sectors shows an interesting clustering of sectors close to the benchmark at the start of this week. I have highlighted this cluster in the RRG above.
The chart below zooms in on those three sectors that are more or less overlaid on each other...
READ MORE
MEMBERS ONLY
DP TV: Homebuilders and Solar Sizzling
by Erin Swenlin,
Vice President, DecisionPoint.com
by Carl Swenlin,
President and Founder, DecisionPoint.com
In this episode of DecisionPoint, Carl covers the major market and gave his take on the current conditions for the "Big Four"--Dollar, Gold, Oil and Bonds. A new Price Momentum Oscillator (PMO) SELL Signal has appeared on Oil. Erin analyzes the hot Home Builder industry group and...
READ MORE
MEMBERS ONLY

How to Time Your Market Entries and Avoid FOMO
Monday was a roller coaster ride for traders, with a steep late morning selloff followed by a steady wave of buying until the closing bell.
Highly volatile days can be great for making quick trades, but can also come with increased risk, as we saw. The fast-moving pace can easily...
READ MORE
MEMBERS ONLY

Participation Mixed and Not Encouraging
by Carl Swenlin,
President and Founder, DecisionPoint.com
We like to monitor broad market participation, asking how many stocks are actually taking part in a market advance. A good way to do this is to track the percentage of S&P 500 stocks that are above their 20EMA (short-term), 50EMA (medium-term), and 200EMA (long-term). On the chart...
READ MORE
MEMBERS ONLY
The Bull Market Is Punishing Those Who Do Not Believe
by Tom Bowley,
Chief Market Strategist, EarningsBeats.com
I have written countless articles on the art of buying stocks in a short squeeze or on the verge of being in a short squeeze. The results can be truly astounding. I'm going to walk you through three recent short squeezes. If you owned ANY of these three...
READ MORE
MEMBERS ONLY

Truncated Week Ahead: NIFTY to Continue Profit-Taking at Higher Levels; RRG Chart Shows Sectors Sharply Paring Relative Momentum
by Milan Vaishnav,
Founder and Technical Analyst, EquityResearch.asia and ChartWizard.ae
In the previous week's note, it was mentioned that the markets have shown first signs of fatigue as they marked the high point of 14653. This was the point where profit-taking bouts emerged. Over the week that went by, the markets did make some incremental highs; however, they...
READ MORE
MEMBERS ONLY
Only a Fool Tries to Call a Correction in a Bull Market, So Here Goes!
by Martin Pring,
President, Pring Research
Last week, I recorded a 40-minute presentation with my friend Bruce Fraser on the 2021 outlook. It's currently being featured on StockCharts TVand calls for a significant extension to the bull market. We present a number of long-term charts featuring several indicators whose bullish signals have consistently been...
READ MORE
MEMBERS ONLY
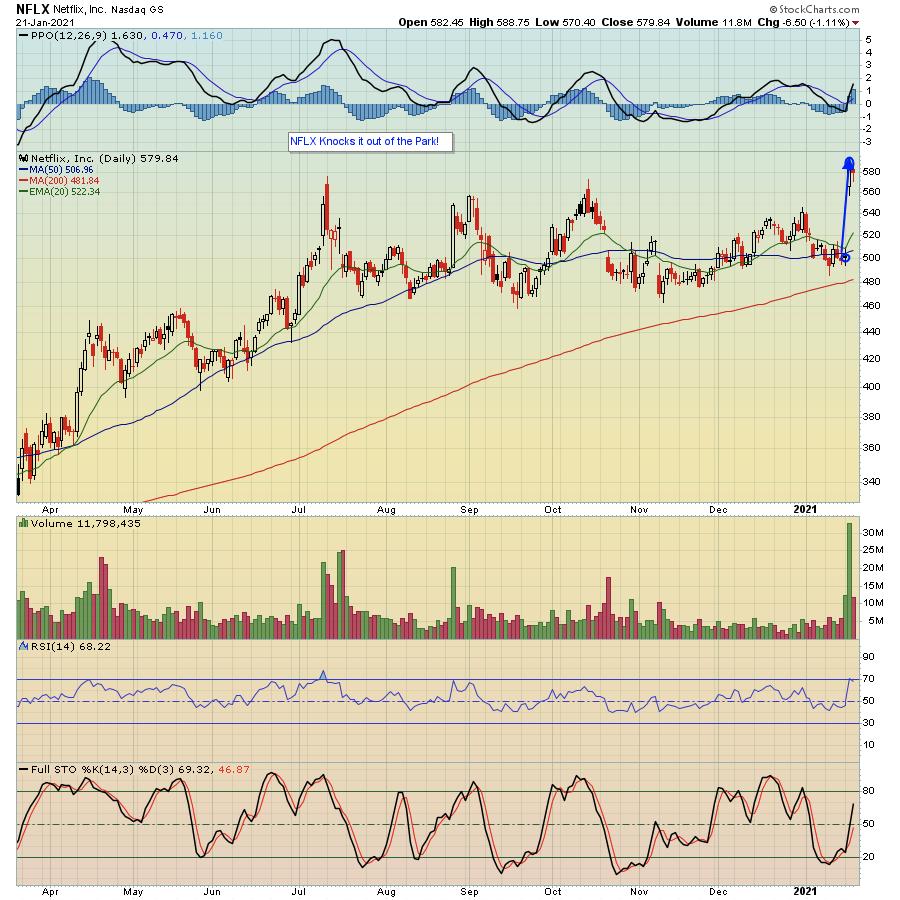
NFLX Knocks it Out of the Park - Who Will Be Next?

by John Hopkins,
President and Co-founder, EarningsBeats.com
Earnings season is off to the races, with Netflix (NFLX) flexing its muscles last week as it beat expectations all the way around, rising 18% at its peak the day after its numbers were released.
Netflix isn't the only company to report strong earnings. JP Morgan (JPM) and...
READ MORE
MEMBERS ONLY
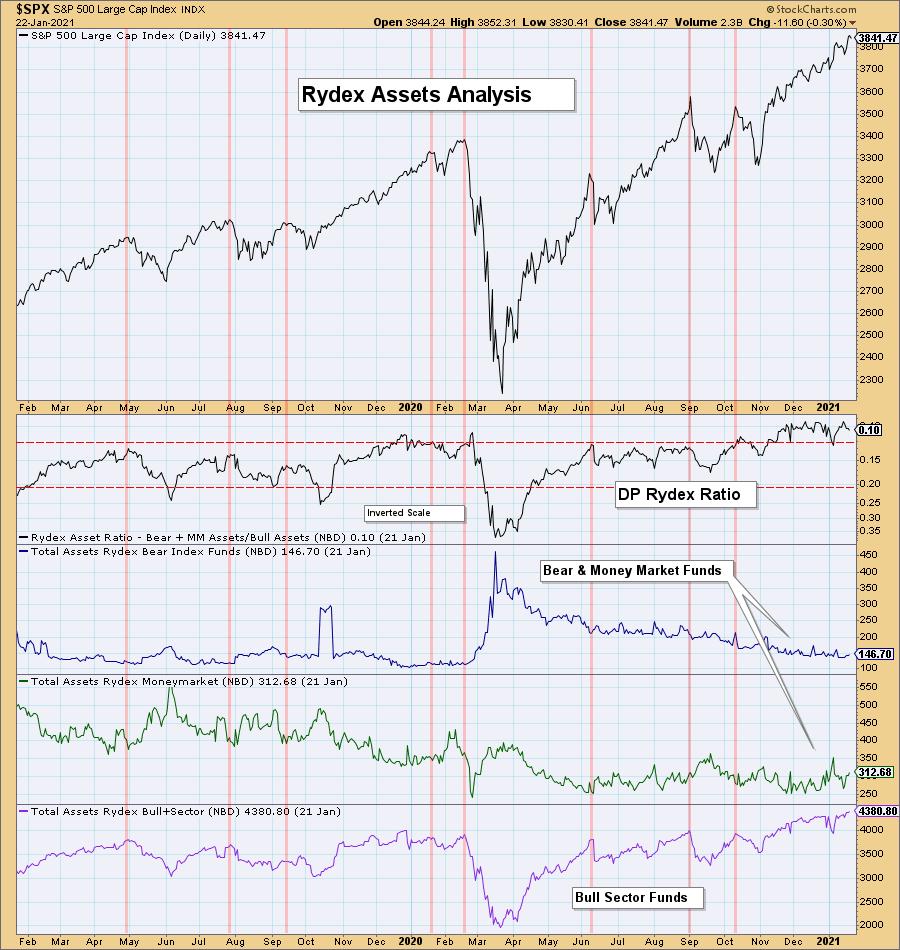
Rydex Ratio Hits Historically Low Reading - Danger...
by Erin Swenlin,
Vice President, DecisionPoint.com
I believe it is time to revisit the Rydex Ratio sentiment chart. A few DecisionPoint.com subscribers have noticed how overbought it has become; I wrote about it in last week's DP Weekly Wrap for subscribers of the DP Alert. Thursday night (1/14), after the latest asset...
READ MORE
MEMBERS ONLY
What's Pushing These Stocks Higher?
by Mary Ellen McGonagle,
President, MEM Investment Research
In this episode of StockCharts TV'sThe MEM Edge, Mary Ellen shares what's pushing stocks much higher after they release their earnings reports and why. She also reviews last week's move away from cyclicals, as well as stocks that have just broken out of a...
READ MORE
MEMBERS ONLY

Is the Negative Momentum Divergence in Transportation a Warning Sign?
Recently, our proprietary momentum indicator RealMotion, seen in the chart above, has shown a divergence in momentum and price for the transportation sector (IYT).
While the price of IYT currently sits above the 50-day moving average, it has broken the 50-DMA on momentum. However, the warning only holds weight if...
READ MORE
MEMBERS ONLY

SOXX and other ETFs with Extended Overbought Conditions
by Arthur Hill,
Chief Technical Strategist, TrendInvestorPro.com
The Semiconductor ETF (SOXX) and several other ETFs are on a serious roll in 2021. For the fourth time since 2009, 14-day RSI was above 70 for ten or more days. This is an exceptional streak, but SOXX is not alone and there are even longer streaks. The following list...
READ MORE
MEMBERS ONLY

BITCOIN TESTS UNDERLYING SUPPORT LEVELS
by John Murphy,
Chief Technical Analyst, StockCharts.com
BITCOIN RETESTS JANUARY LOW... Bitcoin remains in a downside correction that started earlier in January. And it's testing some important support levels. The daily bars in Chart 1 show bitcoin testing a couple of support levels formed earlier in the month (horizontal lines). It's also nearing...
READ MORE
MEMBERS ONLY
Chartwise Women: New Year, New Leading Sectors
by Mary Ellen McGonagle,
President, MEM Investment Research
by Erin Swenlin,
Vice President, DecisionPoint.com
In this week's edition of Chartwise Women, Mary Ellen and Erin examine what's driving the rotation into new sectors and how you can take advantage. They also delve into the top industries within these leading sectors, as well as individual stocks.
This video was originally broadcast...
READ MORE
