MEMBERS ONLY

DROP IN BOND YIELDS MAY BE BOOSTING TECHNOLOGY SHARES

by John Murphy,
Chief Technical Analyst, StockCharts.com
DROP IN BOND YIELDS CASTS DOUBT ON STIMULUS SPENDING...After rising over the last two months, bond yields fell sharply today. The 10-Year Treasury yield on Tuesday reached the highest level since early June on expectations for more stimulus spending and the resulting need to finance that spending by...
READ MORE
MEMBERS ONLY

What You Need to Know Now

by Dave Landry,
Founder, Sentive Trading, LLC
In this edition of Trading Simplified, Dave continues to show his methodology in action, with a focus on positioning for greatness - creating "free" positions with longer-term potential. He then discusses signals that you need to be watching in the overall market both now and in the future....
READ MORE
MEMBERS ONLY

TECH-DRIVEN NASDAQ MARKET LEADS STRONG STOCK RALLY -- HEALTHCARE SPDR HITS NEW RECORD -- SO DO HEALTH INSURERS
by John Murphy,
Chief Technical Analyst, StockCharts.com
STOCKS HAVE ANOTHER STRONG DAY... Major stock indexes are trading sharply higher as we await the results of the presidential election. Increased expectations for a divided government may be helping fuel today's strong stock reaction. The three charts below show the three major stock indexes rising above their...
READ MORE
MEMBERS ONLY

Sector Spotlight: Yield Curve Steepening Accelerates

by Julius de Kempenaer,
Senior Technical Analyst, StockCharts.com
In this edition of Sector Spotlight, as it is the first Tuesday of the new month, I take a look at the monthly charts for asset classes and US sectors. Most of the (strong) monthly trends are still intact. The long-term chart of the 10-2 yield curve, in...
READ MORE
MEMBERS ONLY

Monthly Charts, Bars or Lines?
by Julius de Kempenaer,
Senior Technical Analyst, StockCharts.com
On the first Tuesday of every month, I have a segment in Sector Spotlight in which I look at the completed monthly charts for the previous month. It forces me to sit down and look at the market from a longer-term perspective and make up my mind about trends...
READ MORE
MEMBERS ONLY

STOCKS HAVING A STRONG ELECTION DAY -- ALL SECTORS ARE IN THE BLACK -- BANKS AND FINANCIALS LEAD ON HIGHER TREASURY YIELDS
by John Murphy,
Chief Technical Analyst, StockCharts.com
STOCK INDEXES ARE HAVING A STRONG ELECTION DAY... Stocks are rallying for the second day in a row after finding support near their September lows. Chart 1 shows the Dow Industrials bouncing impressively off their 200-day moving average. Chart 2 shows the S&P 500 also rallying for...
READ MORE
MEMBERS ONLY

Here's A Sector And A Stock That You Don't Want To Ignore In November

by Tom Bowley,
Chief Market Strategist, EarningsBeats.com
I have a huge preference for owning companies that are leaders within their industry and the industry itself is a leader. So it's very hard for me to argue against a company like Deere & Company (DE), which has been showing leadership attributes among commercial vehicles & trucks...
READ MORE
MEMBERS ONLY

DP TV: Volume Ratio Climactic Indicators

by Erin Swenlin,
Vice President, DecisionPoint.com

by Carl Swenlin,
President and Founder, DecisionPoint.com
In this episode of DecisionPoint, after analyzing current market conditions with the DecisionPoint indicators with Erin, Carl introduces us to some indicators he's rediscovered for recognizing climactic conditions - the UP/DOWN Volume Ratio and DOWN/UP Volume Ratio, developed by Dr. Martin Zweig in his book Winning on...
READ MORE
MEMBERS ONLY
Does the Market Have FOMO?
A day before the election carries a lot of emotion and confusion for investors. You can see this in the market movement today, as the major indices did not align before the day's close.
The Nasdaq 100 (QQQ) closed down for the day while, both the S&...
READ MORE
MEMBERS ONLY

Offense Continues To Lead Defense, But High Volatility Remains The "New Normal" | Your Daily Five (11.02.20)

by Grayson Roze,
Chief Strategist, StockCharts.com
So I'm the lucky guy who gets to host "Your Daily Five" the day before election night. What a time to step in for a new show!
It's been a fascinating few weeks for markets, which of course is only fitting given all of...
READ MORE
MEMBERS ONLY

Week Ahead: Upsides in NIFTY To Stay Capped; RRG Chart Highlights Divergence Between These Two Banking Groups

by Milan Vaishnav,
Founder and Technical Analyst, EquityResearch.asia and ChartWizard.ae
After struggling near the 12000-12025 zones for two weeks, the Indian equities finally gave out following global weakness, ending the week on a negative note. In comparison to the week prior, the NIFTY had a wider trading range to deal with. In the previous weekly note, it was mentioned...
READ MORE
MEMBERS ONLY
Big Tech Stocks Weaken
by John Murphy,
Chief Technical Analyst, StockCharts.com
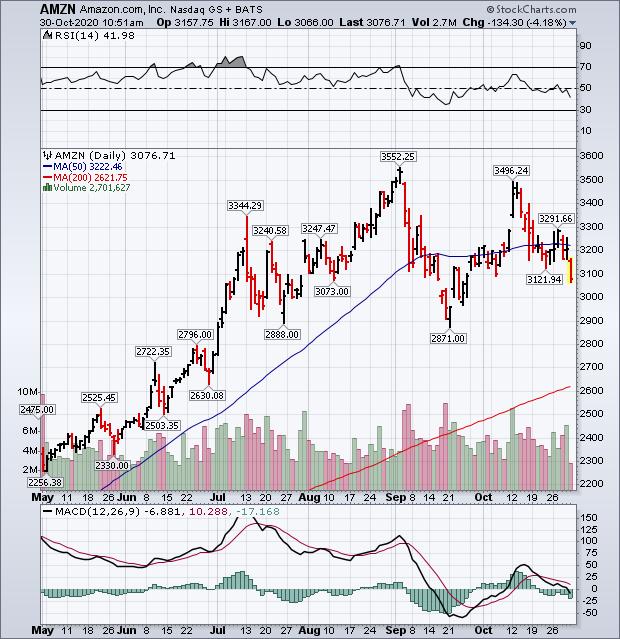
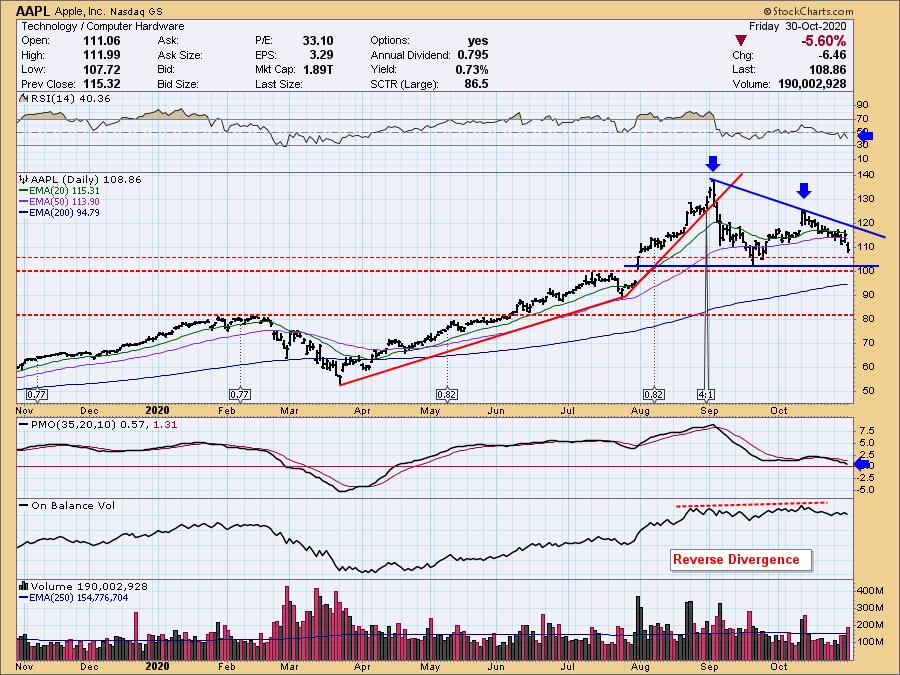
Four of the biggest tech stocks are weakening today after several of them reported decent earnings. And they're weighing on the rest of the market. Chart 1 shows Amazon.com (AMZN) falling to the lowest level in a month. Chart 2 shows Apple (AAPL) doing the same. Chart...
READ MORE
MEMBERS ONLY
Two Companies in Internet Sector Report Blowout Numbers - Who Will Be Next?

by John Hopkins,
President and Co-founder, EarningsBeats.com
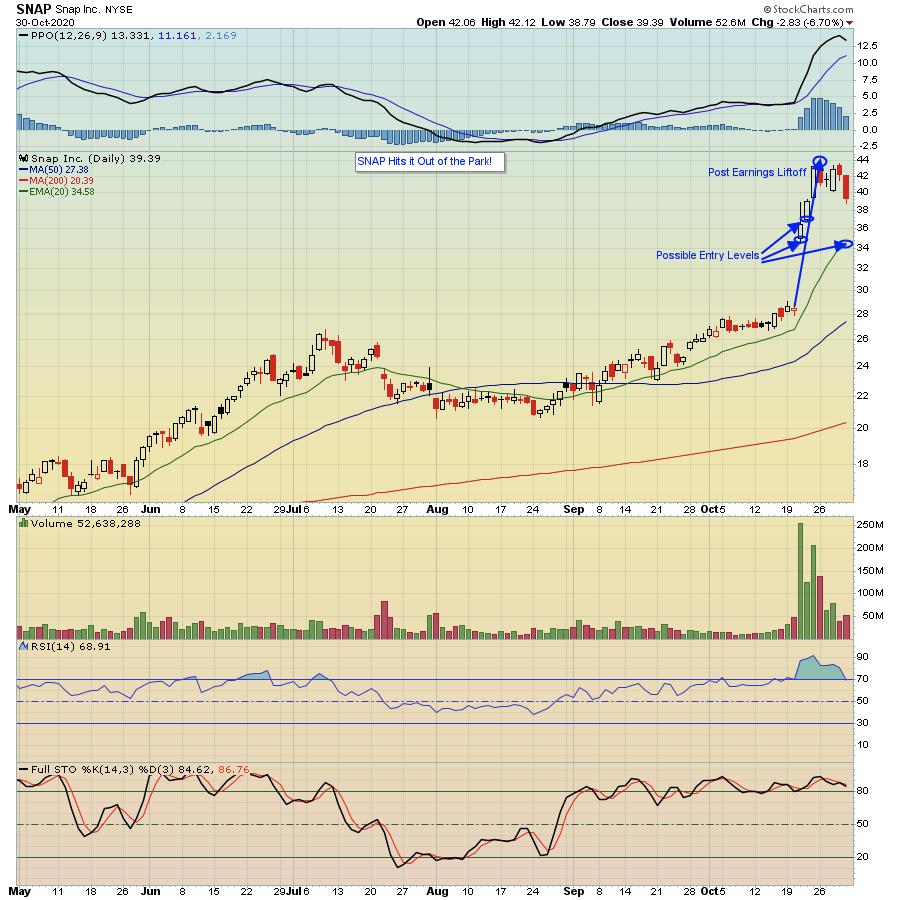
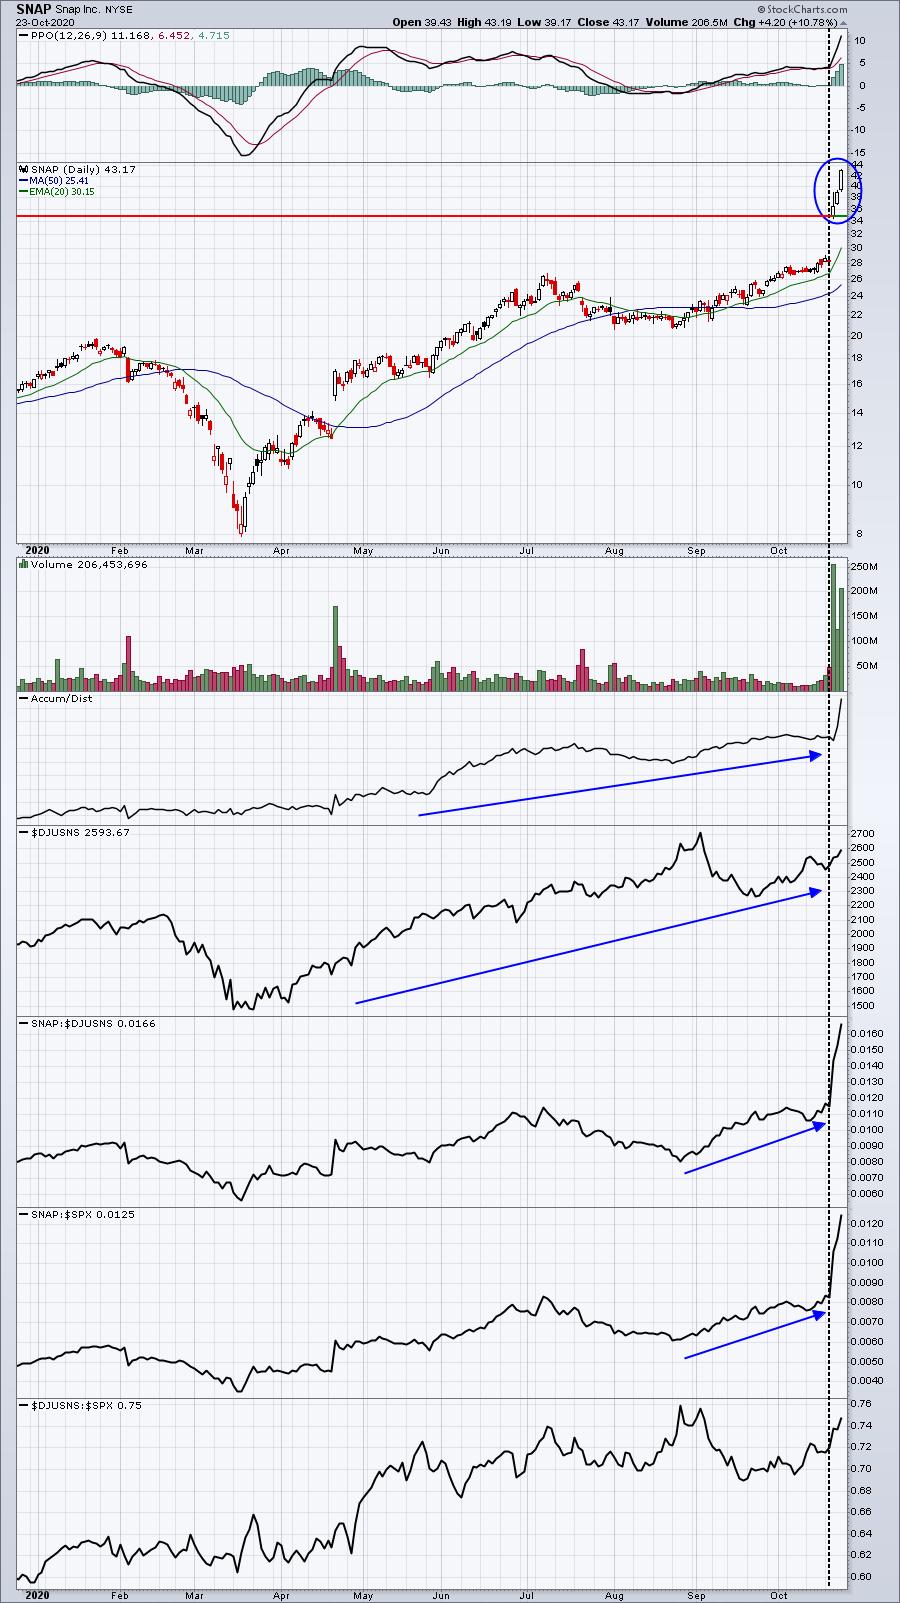
Earnings season is in full swing and, so far, we've seen some really solid results. That might seem counterintuitive, given the bloodbath of late; however, two companies that recently knocked it out of the park were Snap (SNAP) and Pinterest (PINS).
In the case of SNAP, you can...
READ MORE
MEMBERS ONLY

Will the Markets Find Support?

by Mary Ellen McGonagle,
President, MEM Investment Research
In this episode of StockCharts TV'sThe MEM Edge, Mary Ellen shares what to be on the look out for with the broader markets. She also reviews top candidates should Biden win the election, as well as attractive COVID-19-related stocks that have reported strong earnings.
This video...
READ MORE
MEMBERS ONLY

Will the Economy Hold Going Into this Holiday Season?
There are multiple reasons we could face a very tough holiday season.
For one, a second surge in COVID could tighten restrictions on brick-and-mortar businesses. Delayed financial aid can cause more business shutdowns as many businesses were expecting support through these slow months.
Delayed stimulus for individuals and...
READ MORE
MEMBERS ONLY

Broad Selling Pressure, but Not Enough to Tip the Scales

by Arthur Hill,
Chief Technical Strategist, TrendInvestorPro.com
Breadth indicators, such as Advance-Decline Percent, measure the participation behind a move in the underlying index. Sometimes participation is so strong that it tips the scales and signals the start of an extended move. For example, 10-day EMA of SPX AD% triggered a bearish breadth thrust on February...
READ MORE
MEMBERS ONLY
S&P 10: Lots of Toppy Charts
by Erin Swenlin,
Vice President, DecisionPoint.com
These are the ten stocks in the S&P 500 with the highest market capitalization, and they will have a significant effect on the movement of that market index. A quick review will show that they are all going through a topping process, which could prove to be an...
READ MORE
MEMBERS ONLY

BIG TECH STOCKS WEAKEN -- DOW RETESTS 200-DAY AVERAGE
by John Murphy,
Chief Technical Analyst, StockCharts.com
BIG TECH STOCKS WEAKEN... Four of the biggest tech stocks are weakening today after several of them reported decent earnings. And they're weighing on the rest of the market. Chart 1 shows Amazon.com (AMZN) falling to the lowest level in a month. Chart 2 shows Apple (AAPL)...
READ MORE
MEMBERS ONLY

Chartwise Women: Big Names, Big Gains
by Mary Ellen McGonagle,
President, MEM Investment Research
by Erin Swenlin,
Vice President, DecisionPoint.com
Today is "Throwback Thursday"! In this week's edition of Chartwise Women, Erin and Mary Ellen look at companies that have "stood the test of time" through excellent management and their ability to pivot in an ever-changing environment. How have car manufacturers maintained relevance?...
READ MORE
MEMBERS ONLY

High Levels of Fear Argue for a Limited Decline Before a Big Move Higher

by Martin Pring,
President, Pring Research
This week's sell-off has been pretty scary. However, it has not yet ruptured the primary uptrend that began in March. In that respect, Chart 1 shows that the PPO for the S&P Composite, using 6- and 15-month EMAs as parameters, remains well above its...
READ MORE
MEMBERS ONLY
Can the Market Be Saved?
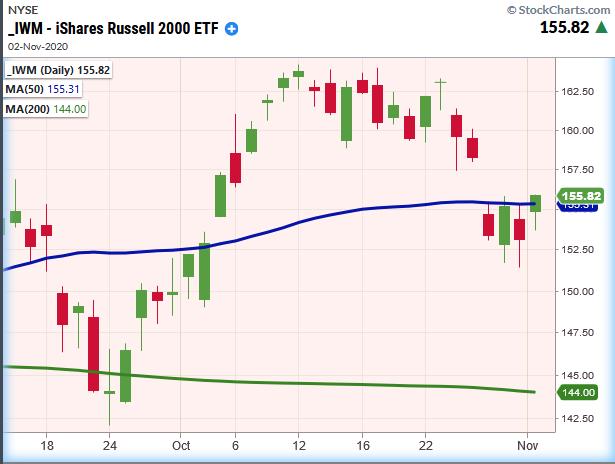
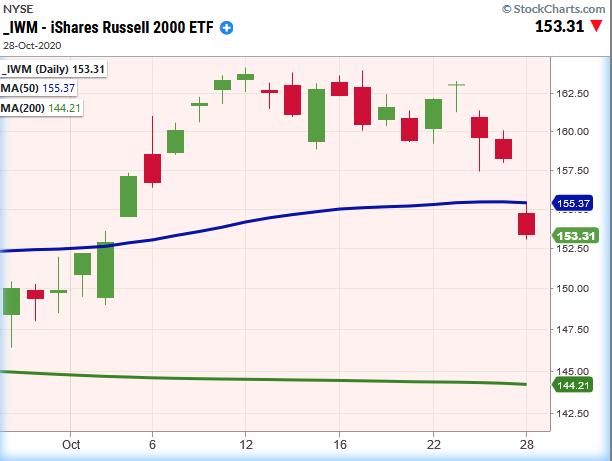
On Tuesday, we talked about an inside day pattern building consolidation for the next move. That pattern did not disappoint. QQQ and IWM gapped lower, closing in an unconfirmed caution phase, while the SPY and DIA have already confirmed a caution phase.
A caution phase is when the 50-day...
READ MORE
MEMBERS ONLY
The One Setup to Trade
by Dave Landry,
Founder, Sentive Trading, LLC
In this edition of Trading Simplified, Dave follows on the one pattern you would pick to set up a trade, diving into the topic fully after touching on the subject in the previous episode. Also, he looks at past Mystery Charts, discussing which ones worked vs. which did not.
This...
READ MORE
MEMBERS ONLY

SEPTEMBER LOWS ARE BEING THREATENED BY STOCK SELLOFF-- VIX REACHES FOUR-MONTH HIGH
by John Murphy,
Chief Technical Analyst, StockCharts.com
DOW TESTS ITS SEPTEMBER LOW... Monday's message suggested that the breaking of 50-day averages increased the odds for a test of September lows. The Dow is already there. Chart 1 shows the Dow Industrials sitting right on their September low near 26,500. And not too far...
READ MORE
MEMBERS ONLY

Today's Technical Pattern Says it All
Today the market was indecisive.
The four major indices closed with an inside day pattern. An inside day is a two-day price pattern where the high and low from the second day doesn't extend past the price range of the first day. You can see this on...
READ MORE
MEMBERS ONLY
Sector Spotlight: Asset Rotation on Same 2016 Track
by Julius de Kempenaer,
Senior Technical Analyst, StockCharts.com
In this edition of Sector Spotlight, I review asset and sector rotations of the last week, then move on to my monthly segment on seasonality and whether or not it matches with current rotations. Materials, Industrials, Energy and Real Estate seem on track for a performance in line with their...
READ MORE
MEMBERS ONLY

Seasonality is Pointing to Outperformance for Materials and Industrials in November
by Julius de Kempenaer,
Senior Technical Analyst, StockCharts.com
We are approaching the month of November, which, this year, also means election month. In last week's edition of the ChartWatchers Newsletter, I wrote an article. Presidential Rotation, on how the rotations for Stocks vs. Bonds are now looking similar to the rotation seen around the same time...
READ MORE
MEMBERS ONLY

When This Index Breaks Out, Wall Street Will Be Declaring The End Of The Pandemic
by Tom Bowley,
Chief Market Strategist, EarningsBeats.com
I've created 5 User-Defined Indexes (UDI) here at StockCharts.com. I use these UDIs to track our four equal-weighted portfolios - Model, Aggressive, Income, and Strong AD - and one other pandemic-related index. Our flagship Model portfolio handled yesterday's selling pretty well and currently stands...
READ MORE
MEMBERS ONLY

Dollar vs. Gold and a Look at Gold Miners
by Erin Swenlin,
Vice President, DecisionPoint.com
I promised during the DecisionPoint Show today that I would look at the Dollar v. Gold. Well in my haste reviewing all of the big names reporting earnings this week, it fell by the wayside. Consequently, I will give you the Dollar and Gold sections from today's subscriber-...
READ MORE
MEMBERS ONLY
DP TV: Prepare for Big Earnings This Week
by Erin Swenlin,
Vice President, DecisionPoint.com
In this episode of DecisionPoint, all major market indexes on the DecisionPoint Scoreboards triggered Price Momentum Oscillator (PMO) SELL Signals. Flying solo this week, Erin reviews these signal changes and gives your her analysis of the current market environment. Many big names are reporting earnings this week, including Facebook (FB)...
READ MORE
MEMBERS ONLY

Where and How to Go If the Market Ends
Before we talk about the recent rotation from growth into value and how that did relative to the phases, a note about managing large selloffs.
A while back, we talked about market timing based on the previous day's high and low. Watching for breakouts and breakdowns based off...
READ MORE
MEMBERS ONLY

STOCKS UNDER HEAVY PRESSURE -- 50-DAY LINES ARE BEING BROKEN -- SEPTEMBER LOWS MAY NOW BE RETESTED
by John Murphy,
Chief Technical Analyst, StockCharts.com
50-DAY LINES ARE BEING BROKEN... Stocks are under heavy selling pressure. The three charts below show three major stock indexes falling back below their 50-day moving averages. The recent rebound took stocks close to their highs formed in early September. With that rebound having failed, technical odds now...
READ MORE
MEMBERS ONLY

Is the Indian Market Facing an End of the "Risk-On" Environment Along with Other Emerging Markets? These 3 Charts Tell a Story
by Milan Vaishnav,
Founder and Technical Analyst, EquityResearch.asia and ChartWizard.ae
The first quarter of this CY 2020 was quite a disaster for the equity markets. The month of February saw the onset of the COVID-19 pandemic and the spread of coronavirus saw equity markets the world over witnessing a vertical crash everywhere, in the range of 35% to 45%...
READ MORE
MEMBERS ONLY

The Election Cycle and the Markets

by Larry Williams,
Veteran Investor and Author
It's all about the election on this special episode of Real Trading with Larry Williams. Who is going to win? Does that matter market-wise? What is going to happen? Taking a look at polls, charts and historical precedent. Larry shows what a Trump or Biden victory means...
READ MORE
MEMBERS ONLY

Watch S&P 500 Support on This Short-Term Hourly Chart
by Tom Bowley,
Chief Market Strategist, EarningsBeats.com
I expect that we'll bounce sooner rather than later, but a key short-term test is underway right now. I'm watching 3425 on the S&P 500 ($SPX) and 11600 on the NASDAQ 100 ($NDX). Both support levels are currently lost. A weak finish today...
READ MORE
MEMBERS ONLY

Week Ahead: NIFTY to Have Difficult Time Moving Past This Zone; RRG Chart Paints a Tricky Picture
by Milan Vaishnav,
Founder and Technical Analyst, EquityResearch.asia and ChartWizard.ae
While trading on expected lines, the Indian equity markets did not make any major directional moves and consolidated in a defined range. The NIFTY did not move past the previous week's high point and consolidated while resisting to that level. The trading range also remained narrower than what...
READ MORE
MEMBERS ONLY

Two of the Four Commodity Groups Stand Out
by Arthur Hill,
Chief Technical Strategist, TrendInvestorPro.com
Broad commodity ETFs are like broad index ETFs: an amalgamation of various components. Traders can improve performance by breaking these down, ignoring the weaker components and focusing on the stronger components. Let's do that with the Invesco DB Commodity ETF.
The Commodity ETF (DBC) can be broken down...
READ MORE
MEMBERS ONLY

This Technology Group Has Finally Become A Leader, Plus Two Stocks To Benefit
by Tom Bowley,
Chief Market Strategist, EarningsBeats.com
For the past few years, I've written countless articles on semiconductors ($DJUSSC), software ($DJUSSW), and computer hardware ($DJUSCR) as these three industry groups have led a powerful charge in technology. But other industry groups in this sector have failed to participate to the same degree (or even close...
READ MORE
MEMBERS ONLY
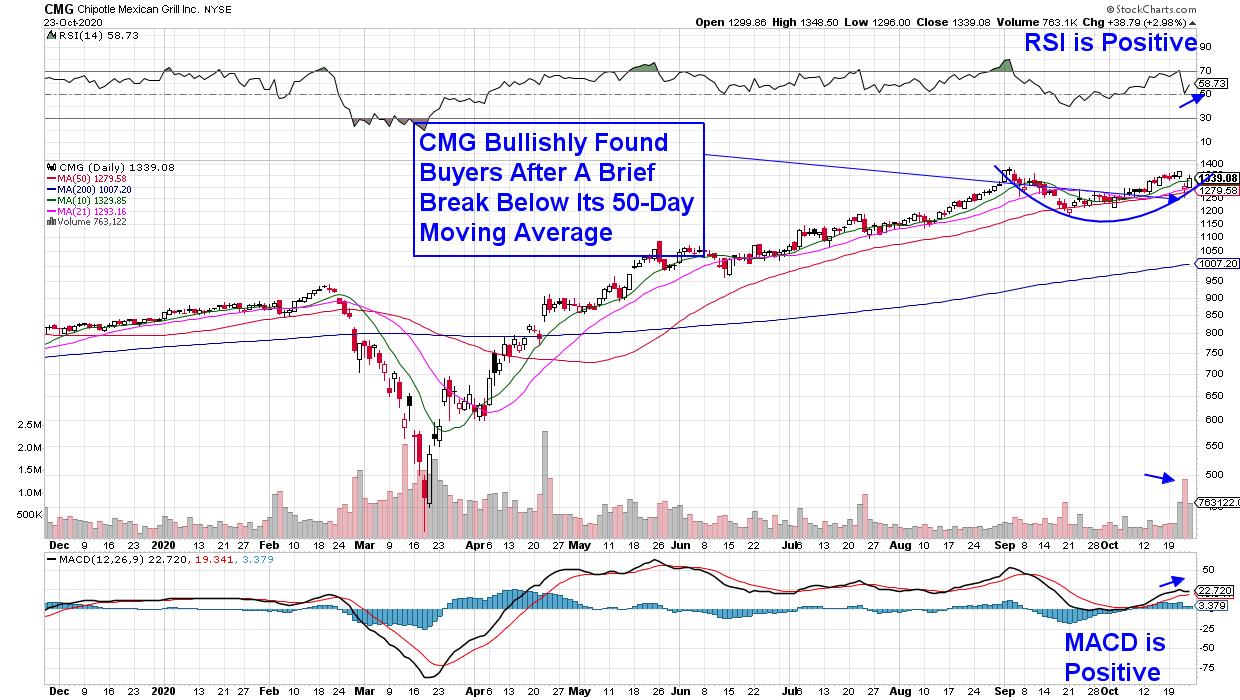
These Leading Stocks Are In Bullish Positions After Reporting Strong Earnings
by Mary Ellen McGonagle,
President, MEM Investment Research
While only a quarter of S&P 500 companies have reported 3rd quarter earnings so far, the number of companies beating EPS estimates is near record highs. And, for the most part, investors are rewarding these companies – particularly if they are signaling earnings growth into next year.
My many...
READ MORE
MEMBERS ONLY
4 Earnings Reports You Need To Be Watching
by Tom Bowley,
Chief Market Strategist, EarningsBeats.com
Earnings is what we do at EarningsBeats.com. While a lot of traders are hoping, perhaps gambling, that companies they own come through with great results, we're doing our homework to prepare for our next Top 10 Stocks webinar on November 19th. That's when we'...
READ MORE
MEMBERS ONLY
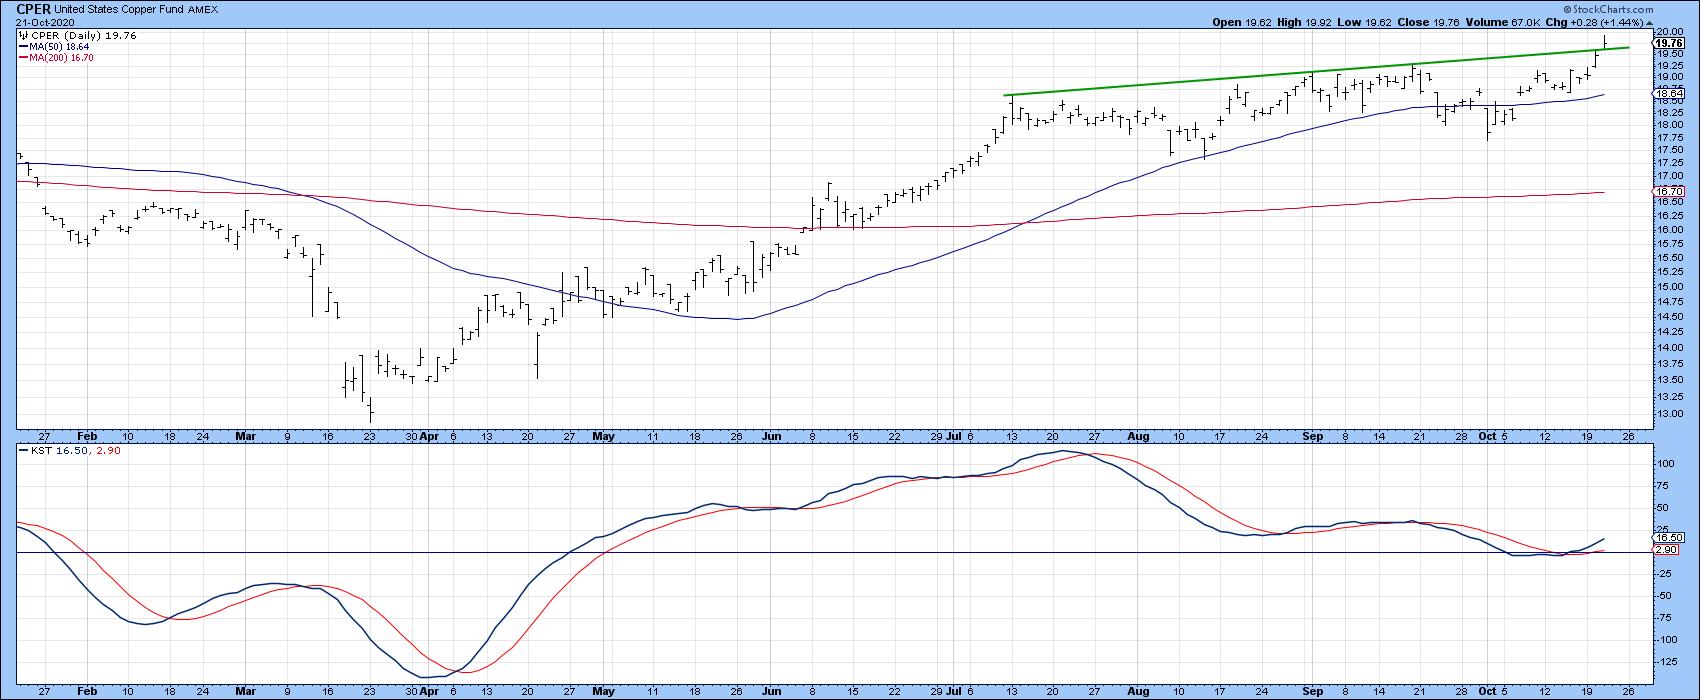
Upside Break by Copper also Has Implications for the CRB Composite and the Economy
by Martin Pring,
President, Pring Research
They say Copper is reputed to have a Ph.D. in economics because of its ability to predict turning points in the global economy. That arises because of copper's widespread applications in most sectors of the economy, from homes and factories to electronics and power generation. The implication...
READ MORE