MEMBERS ONLY
The Election Nears and the Family Holds Strong
Friday gave the thrill of a roller coaster ride, as we watched major indices run up and down throughout the day. While it's not the ride most investors look for in the market, it's the best they can get, since most amusement parks have yet to...
READ MORE
MEMBERS ONLY

Sector Rotation Shaping Up

by Mary Ellen McGonagle,
President, MEM Investment Research
In this episode of StockCharts TV'sThe MEM Edge, Mary Ellen examines money flows into newer areas of the market. She highlights how to handle stocks that report strong earnings, while also sharing a simple system that gets you in front of stocks on the move.
This video was...
READ MORE
MEMBERS ONLY

Presidential Rotation

by Julius de Kempenaer,
Senior Technical Analyst, StockCharts.com
Those of you who follow my blogs and watch Sector Spotlight on StockCharts TV will know that I regularly look at rotations among various asset classes. I talked about that subject in last week's show, focusing on the relationship between stocks and bonds, and I wanted to highlight...
READ MORE
MEMBERS ONLY

Three Takes on the Presidential Cycle

by David Keller,
President and Chief Strategist, Sierra Alpha Research
This past Monday, I asked three experts on the Presidential Cycle - Bruce Fraser, Jeff Hirsch, and Tom McClellan - to share their take on market trends around the election season. They delivered in a big way, and the result was a masterclass in how to learn from market history.
In the...
READ MORE
MEMBERS ONLY

The 7 Investing Essentials For New Investors and Recent Subscribers - ChartPack Update #29 (Q3 / 2020)

by Grayson Roze,
Chief Strategist, StockCharts.com

by Gatis Roze,
Author, "Tensile Trading"
This blog is addressed to the many thousands of recent new StockCharts subscribers. The explosive growth in our ranks suggested to me that a little welcome tutorial would be valuable. Any welcome message to an investor arena that aspires to be truthful must acknowledge upfront the "Paradox of Choice&...
READ MORE
MEMBERS ONLY

Check Out These "Diamonds in the Rough"!

by Erin Swenlin,
Vice President, DecisionPoint.com
I've decided to share today's DP Diamonds Report in our free DecisionPoint Blog to give everyone a sample of how I cull and review my "Diamonds in the Rough". For those new to the DP Diamonds Reports, on Thursday I analyze all of the...
READ MORE
MEMBERS ONLY

Chartwise Women: Innovation as a Market Driver
by Mary Ellen McGonagle,
President, MEM Investment Research
by Erin Swenlin,
Vice President, DecisionPoint.com
In this week's edition of Chartwise Women, Mary Ellen and Erin review the pandemic's impact on improving productivity among many industries as they strive to meet the demands of a changing world. They also share how you can screen for top stocks in those industries.
This...
READ MORE
MEMBERS ONLY
Three Takes on the Presidential Cycle
by David Keller,
President and Chief Strategist, Sierra Alpha Research
This past Monday, I asked three experts on the Presidential Cycle - Bruce Fraser, Jeff Hirsch, and Tom McClellan - to share their take on market trends around the election season. They delivered in a big way, and the result was a masterclass in how to learn from market history.
In the...
READ MORE
MEMBERS ONLY

10-YEAR YIELD NEARS 200-DAY AVERAGE -- REGIONAL BANKS CONTINUE TO LEAD -- HUNTINGTON BANCSHARES LOOK STRONG -- ANTHEM BREAKS OUT TO THE UPSIDE

by John Murphy,
Chief Technical Analyst, StockCharts.com
10-YEAR TREASURY YIELD NEARS 200-DAY LINE... The rally in bond yields is continuing. Tuesday's message showed the 30-Year Treasury yield climbing above its 200-day average. Chart 1 shows the 10-Year Treasury yield heading for a test of its 200-day line after rising...
READ MORE
MEMBERS ONLY

Align Technology (ALGN) Absolutely Crushes Revenue And EPS Estimates!

by Tom Bowley,
Chief Market Strategist, EarningsBeats.com
'Tis the season to look for blowout earnings reports and Align Technology (ALGN) delivered one last night. Wow! Check out ALGN's actual revenues and EPS vs. Wall Street consensus estimates:
Revenues: $734.1 million (actual) vs. $531.9 million (estimate)
EPS: $2.25 (actual) vs. $.59 (estimate)...
READ MORE
MEMBERS ONLY
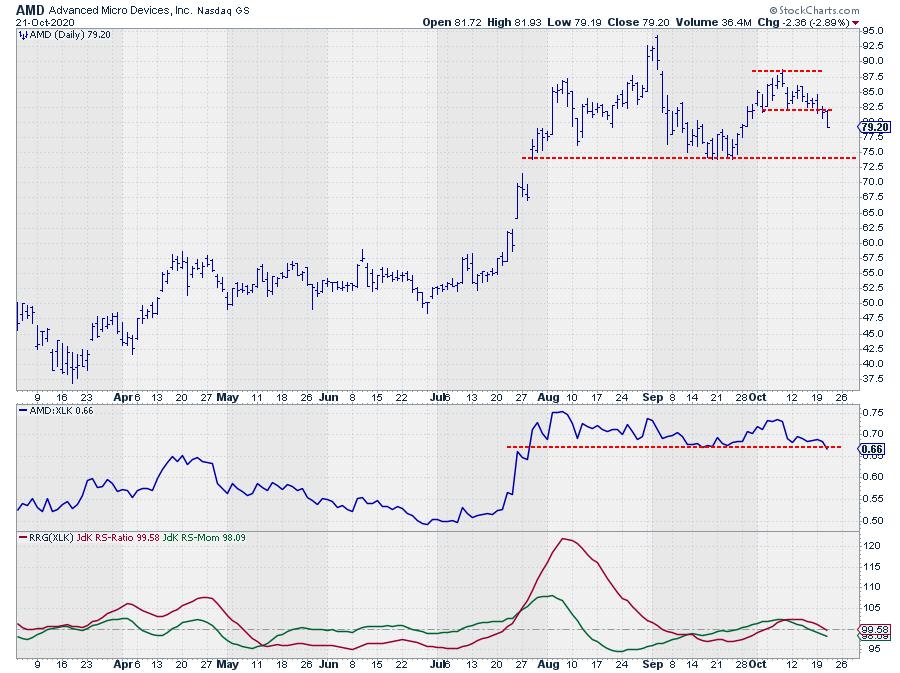
AMD is at Risk!
by Julius de Kempenaer,
Senior Technical Analyst, StockCharts.com
While going over some Relative Rotation Graphs showing the rotations for individual stocks, the tail for AMD in the Technology sector caught my attention.
AMD was one of the leading tech stocks from July to early September, almost doubling in price, but then started to fade in terms of relative...
READ MORE
MEMBERS ONLY
Can Cheap Money Entice Small Business Growth?
A growing worry of stagflation (high inflation followed by stagnant economic growth) is becoming more of a trending reality as the pandemic looks to continue into the next year. The March selloff affected major global supply chains and, if paired with rising inflation, could create an even tougher environment for...
READ MORE
MEMBERS ONLY

Upside Break by Copper also Has Implications for the CRB Composite and the Economy

by Martin Pring,
President, Pring Research
They say that Copper is reputed to have a Ph.D. in economics because of its ability to predict turning points in the global economy. That arises because of copper's widespread applications in most sectors of the economy, from homes and factories to electronics and power generation. The...
READ MORE
MEMBERS ONLY

WEAK DOLLAR BOOSTS METAL PRICES -- COPPER REACHES TWO-YEAR HIGH -- CHINA LEADS EMERGING MARKETS HIGHER
by John Murphy,
Chief Technical Analyst, StockCharts.com
DOLLAR INDEX WEAKENS...Chart 1 shows the Invesco Dollar Index (UUP) tumbling today to the lowest level since early September. And it's losing ground against all of its major trading partners in Europe and Asia. The weaker dollar has a number of intermarket implications. One of them is...
READ MORE
MEMBERS ONLY

Positioning for Greatness

by Dave Landry,
Founder, Sentive Trading, LLC
In this edition of Trading Simplified, Dave goes over a new Mystery Chart and explores how to psychologically "see" a trade. He also shares some new IPOs, plus a scan that he's been working on and is excited to share with you.
This video was originally...
READ MORE
MEMBERS ONLY

Sector Spotlight: Explosive Move in Stock/Bond Ratio Coming?
by Julius de Kempenaer,
Senior Technical Analyst, StockCharts.com
In this edition of Sector Spotlight, I look at last week's performance and rotations for asset classes and stock sectors. After the break, I move on to share my views on various levels of the investment pyramid, highlighting the possibility for an explosive move in the stock/bond...
READ MORE
MEMBERS ONLY

DISH is a New Short in the RRG L/S Basket
by Julius de Kempenaer,
Senior Technical Analyst, StockCharts.com
From time to time, I present Long/Short or Pair Trading ideas in my weekly Sector Spotlight show on StockCharts TV. During the past few months, I have started to track these ideas as a portfolio. This is by no means an advisory service or a model portfolio of any...
READ MORE
MEMBERS ONLY

RISING BOND YIELDS BOOST BANKS -- REGIONAL SPDR CLEARS 200-DAY AVERAGE -- REGIONAL BANK LEADERS INCLUDE COMERICA, REGIONS FINANCIAL, AND FITB
by John Murphy,
Chief Technical Analyst, StockCharts.com
BOND YIELDS ARE CLIMBING AGAIN... After a pullback last week, bond yields are climbing again. Chart 1 shows the 30-Year Treasury ¥ield climbing 5 basis points today to 1.60%. And it's back above its 200-day moving average. The 10-Year Treasury yield is up as...
READ MORE
MEMBERS ONLY
This Stock Should Blow Away Earnings Tomorrow Morning (Plus One That Won't)
by Tom Bowley,
Chief Market Strategist, EarningsBeats.com
Wall Street has been accumulating stocks over the past few weeks in anticipation of strong results. That doesn't necessarily mean we'll see a positive reaction to those earnings, because there's the old "buy on rumor, sell on news" adage that frequently comes...
READ MORE
MEMBERS ONLY

DP Show: Black Monday and Big Blue (IBM)
by Erin Swenlin,
Vice President, DecisionPoint.com

by Carl Swenlin,
President and Founder, DecisionPoint.com
In this episode of DecisionPoint, after reviewing the SPY and the DecisionPoint indicators, Carl gives us a history lesson on Black Monday 1987, which happened 33 years ago today! He points out warning signs that came ahead of the hatchet that had stock prices down more than 20% in one...
READ MORE
MEMBERS ONLY

Is the Market Coming to a Head?
Today, the hope that the Economic Modern Family held onto coming into the week waned a bit, as the stimulus talks stalled once again.
After the close, more headlines emerged, as the Senate is back and both sides know that, politically, some stimulus package should be passed. And that is...
READ MORE
MEMBERS ONLY

5 Reasons You Should Own This Top Stock
by Mary Ellen McGonagle,
President, MEM Investment Research
While the broader markets have been waffling due to uncertainties surrounding major issues such as the upcoming elections and the passage of a stimulus package, there have been a stealth set of underlying stocks that are breaking out of sound bases due to solid growth prospects.
Today, I'm...
READ MORE
MEMBERS ONLY
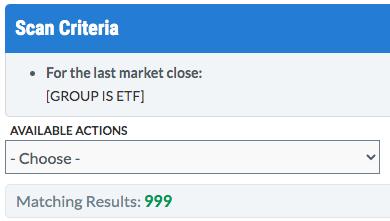
Here's How I'd Build A Portfolio Of ETFs
by Tom Bowley,
Chief Market Strategist, EarningsBeats.com
Selecting and investing in ETFs is a daunting task. I ran a very basic scan to identify all of the ETFs to consider and this is what was returned:
There were 999 ETFs returned. That's helpful. NOT! The 999 ETFs returned were listed in alphabetical order by ticker...
READ MORE
MEMBERS ONLY
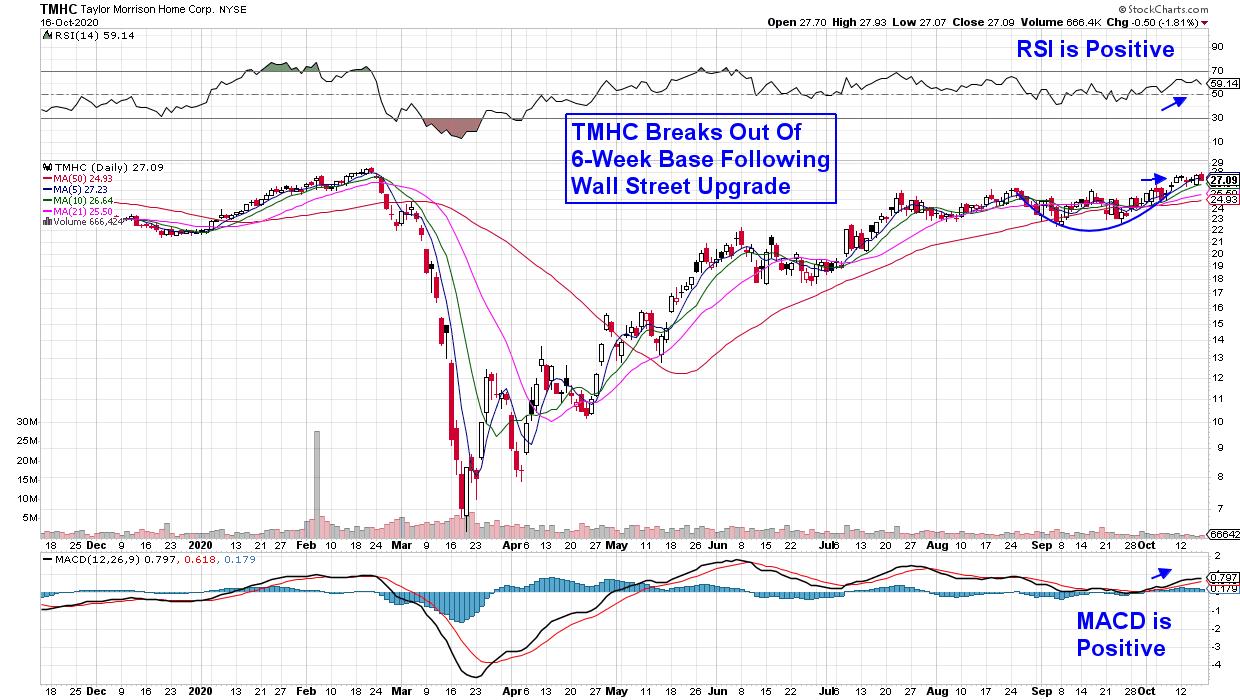
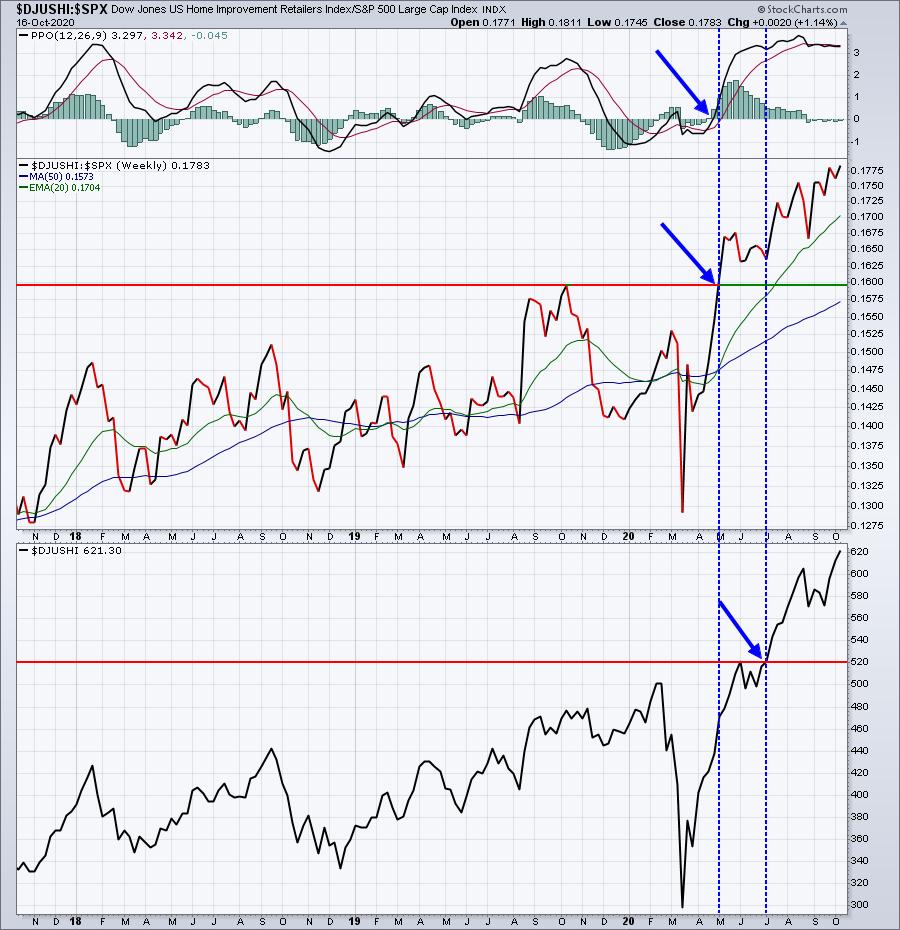
It's a Big Week for This Leading Industry – Keep These 3 Stocks on Your Radar
by Mary Ellen McGonagle,
President, MEM Investment Research
Next week, the economic calendar will be dominated by reports providing more data on a leading area of growth. I'm talking about an industry in the U.S. that's seen solid expansion over the past 3 months, with estimated growth expected to continue well into next...
READ MORE
MEMBERS ONLY
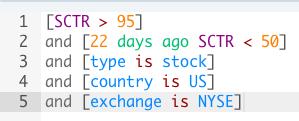
How Does A SCTR Score Go From 50 To 95 In A Month? Here's The Only Company To Do It
by Tom Bowley,
Chief Market Strategist, EarningsBeats.com
I ran a very simple scan, searching for companies that have been able to make the almost impossible jump in SCTR score from less than 50 to greater than 95 in just one month (22 trading days). Here's the scan I ran:
There were 2 results:
Eaton Vance...
READ MORE
MEMBERS ONLY
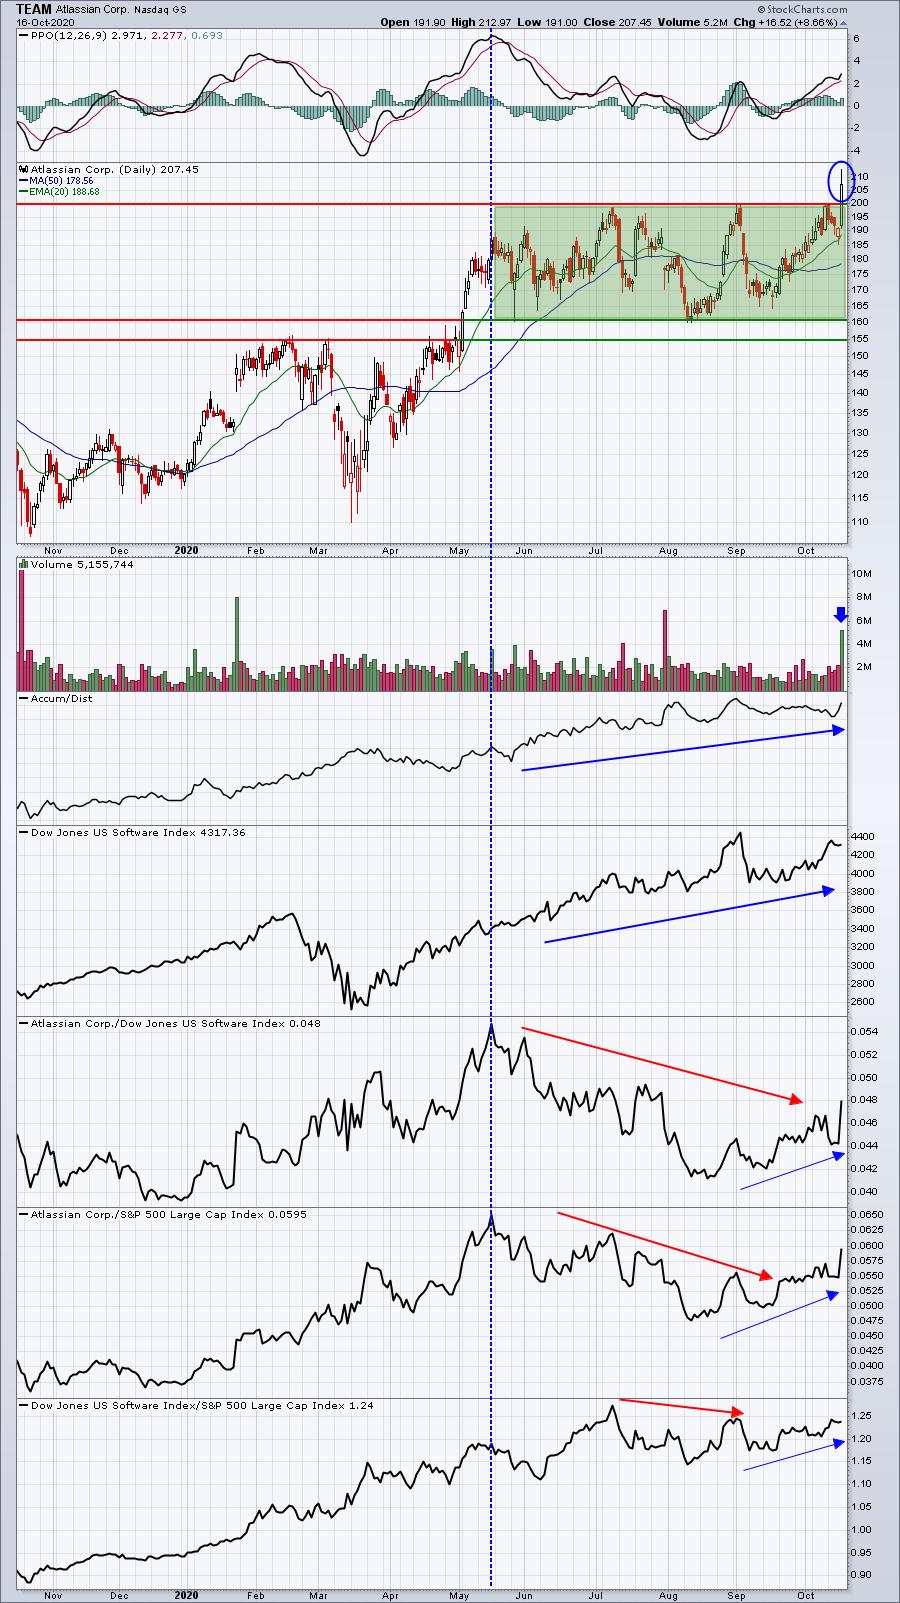
Trying to Outperform the S&P 500? You Gotta Pick the Right TEAM
by Tom Bowley,
Chief Market Strategist, EarningsBeats.com
There's not much I'd rather see than a heavy volume breakout in a consolidating stock within a strong industry. Enter Atlassian Corp (TEAM). Some traders let their guard down when a stock consolidates, and it's easy to do because consolidation normally leads to relative...
READ MORE
MEMBERS ONLY
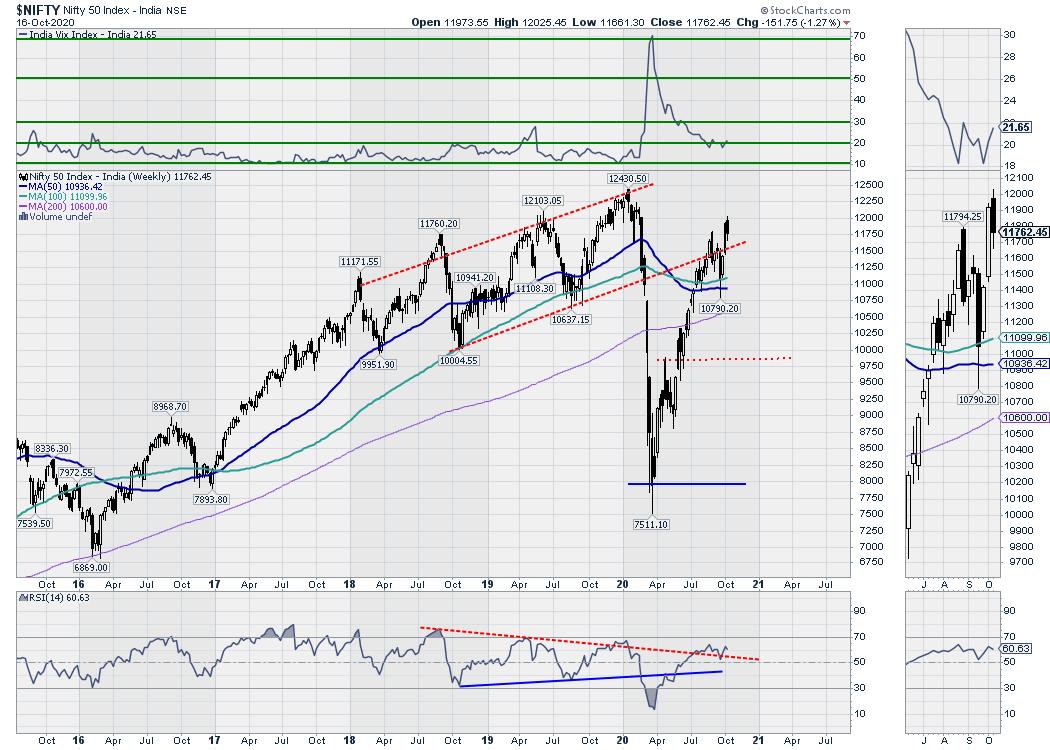
Week Ahead: NIFTY to Stay Largely Rangebound; RRG Charts Show No Improvement in This Group

by Milan Vaishnav,
Founder and Technical Analyst, EquityResearch.asia and ChartWizard.ae
The market action in this week fared precisely on the anticipated lines. In the previous weekly outlook, we had mentioned the markets were firmly placed but, at the same time, staying overstretched on the short-term charts. It was also mentioned that any up moves will face stiff resistance at...
READ MORE
MEMBERS ONLY
Don't Look Now, But We're Seeing a New Leading Industry Group Emerging
by Tom Bowley,
Chief Market Strategist, EarningsBeats.com
Those who follow me know that I'm constantly monitoring the current leaders and watching for new leadership. It's one piece of technical analysis that helps in selecting our portfolio stocks. The best way to beat the benchmark S&P 500 is to follow the strength...
READ MORE
MEMBERS ONLY
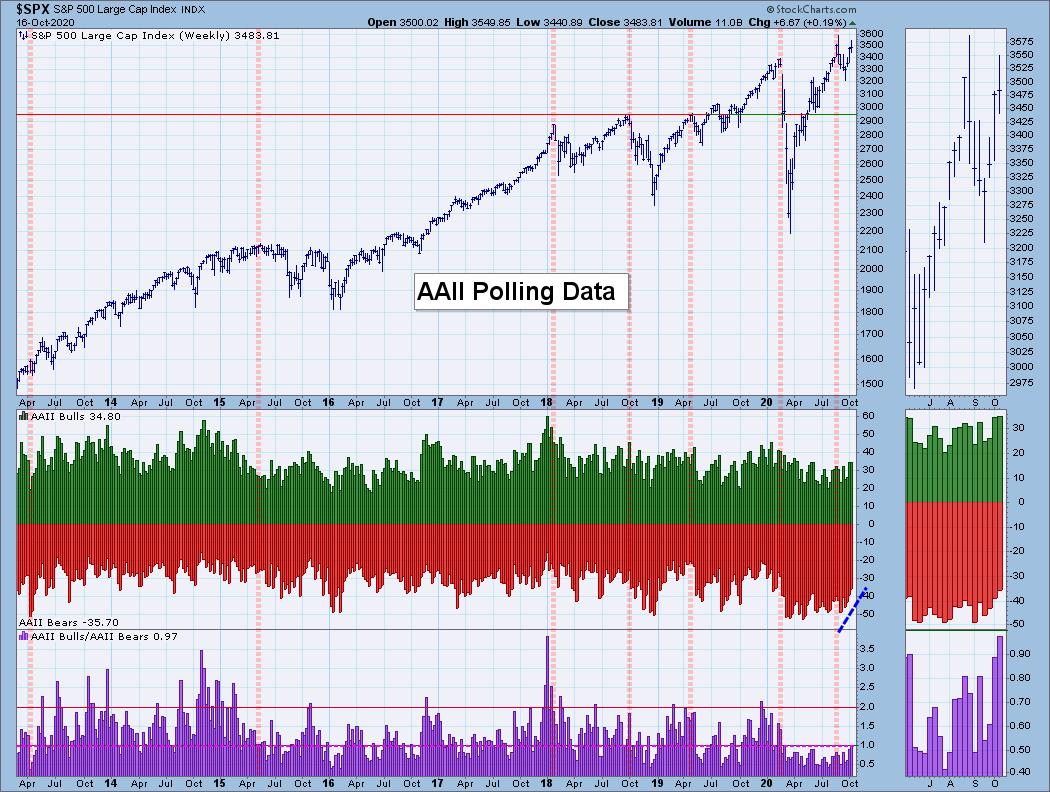
Are Market Participants Really Bearish Right Now? Nope
by Erin Swenlin,
Vice President, DecisionPoint.com
I have heard rumblings of market participants beginning to "feel" bearish about the market as it pulled back this past week. That information can not only be gleaned from business news channels, but can also be pulled from polling data. Below is the American Association of Individual Investors&...
READ MORE
MEMBERS ONLY
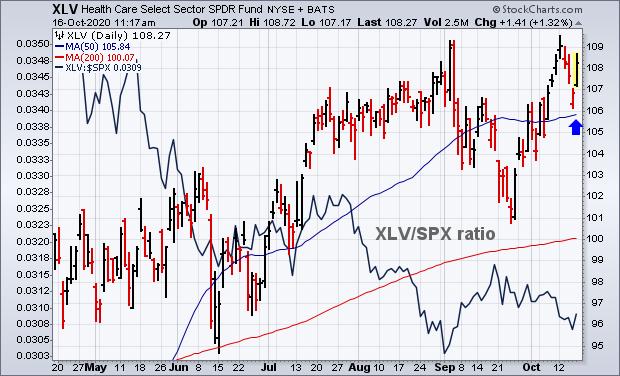
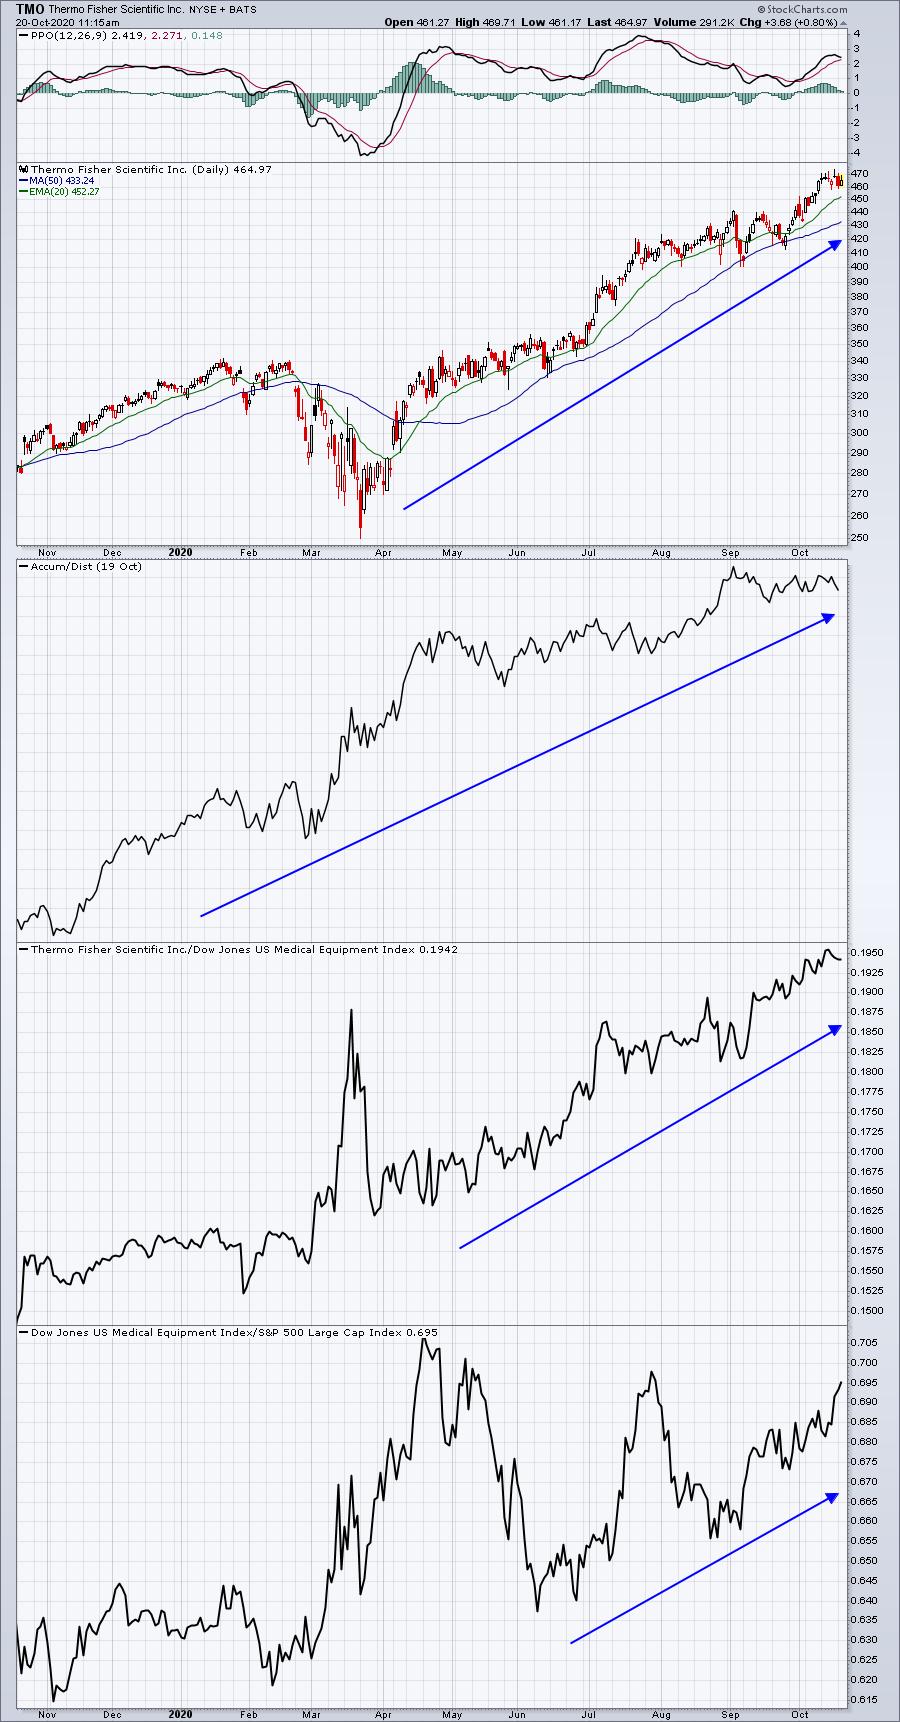
Healthcare Providers Lead XLV Higher
by John Murphy,
Chief Technical Analyst, StockCharts.com
Healthcare stocks are leading the market higher for a change. The daily bars in Chart 1 show the Health Care SPDR (XLV) nearing a test of its recent highs after finding support near its 50-day moving average. The solid line overlaid on the chart plots a relative strength ratio...
READ MORE
MEMBERS ONLY
Where is Current Market Leadership?
by Mary Ellen McGonagle,
President, MEM Investment Research
Strength abounds! In this episode of StockCharts TV'sThe MEM Edge, Mary Ellen reviews where the strength is in the markets and what to look for going forward. She also highlights the explosive moves in Small-Cap stocks and what signals point to further upside in select names. Finally,...
READ MORE
MEMBERS ONLY
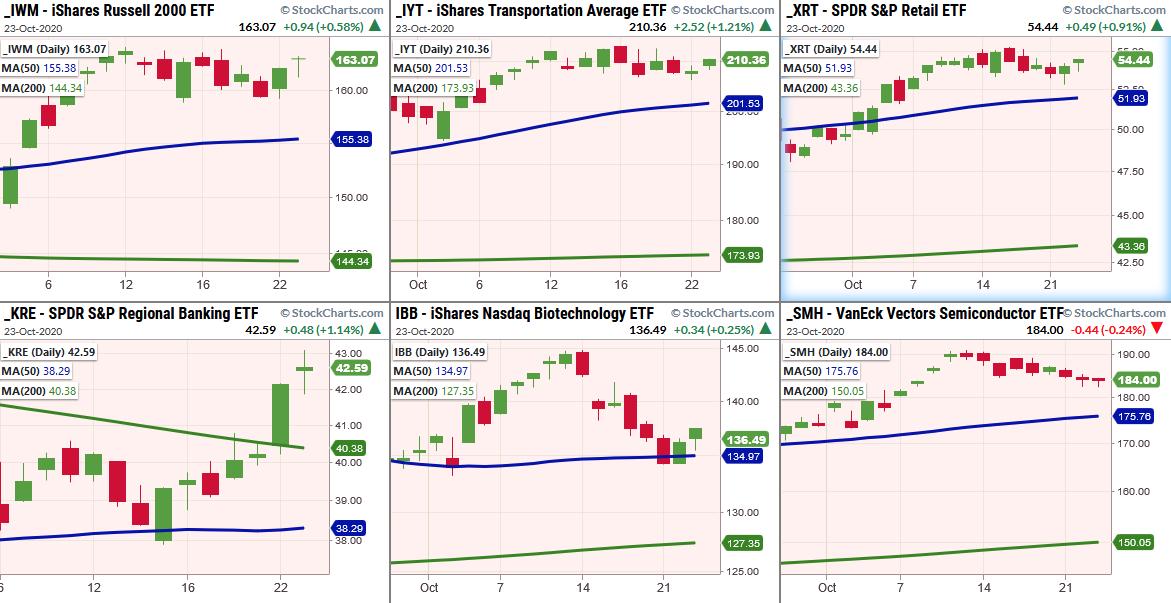
Who Rocks? The Economic Modern Family - That's Who!
In spite of no passing stimulus, mixed economic data, rising COVID cases and a wild pre-election season, for the first time since we can remember, the Economic Family is brushing off most of the negativity.
For years, we would report on the health of the family with words like...
READ MORE
MEMBERS ONLY

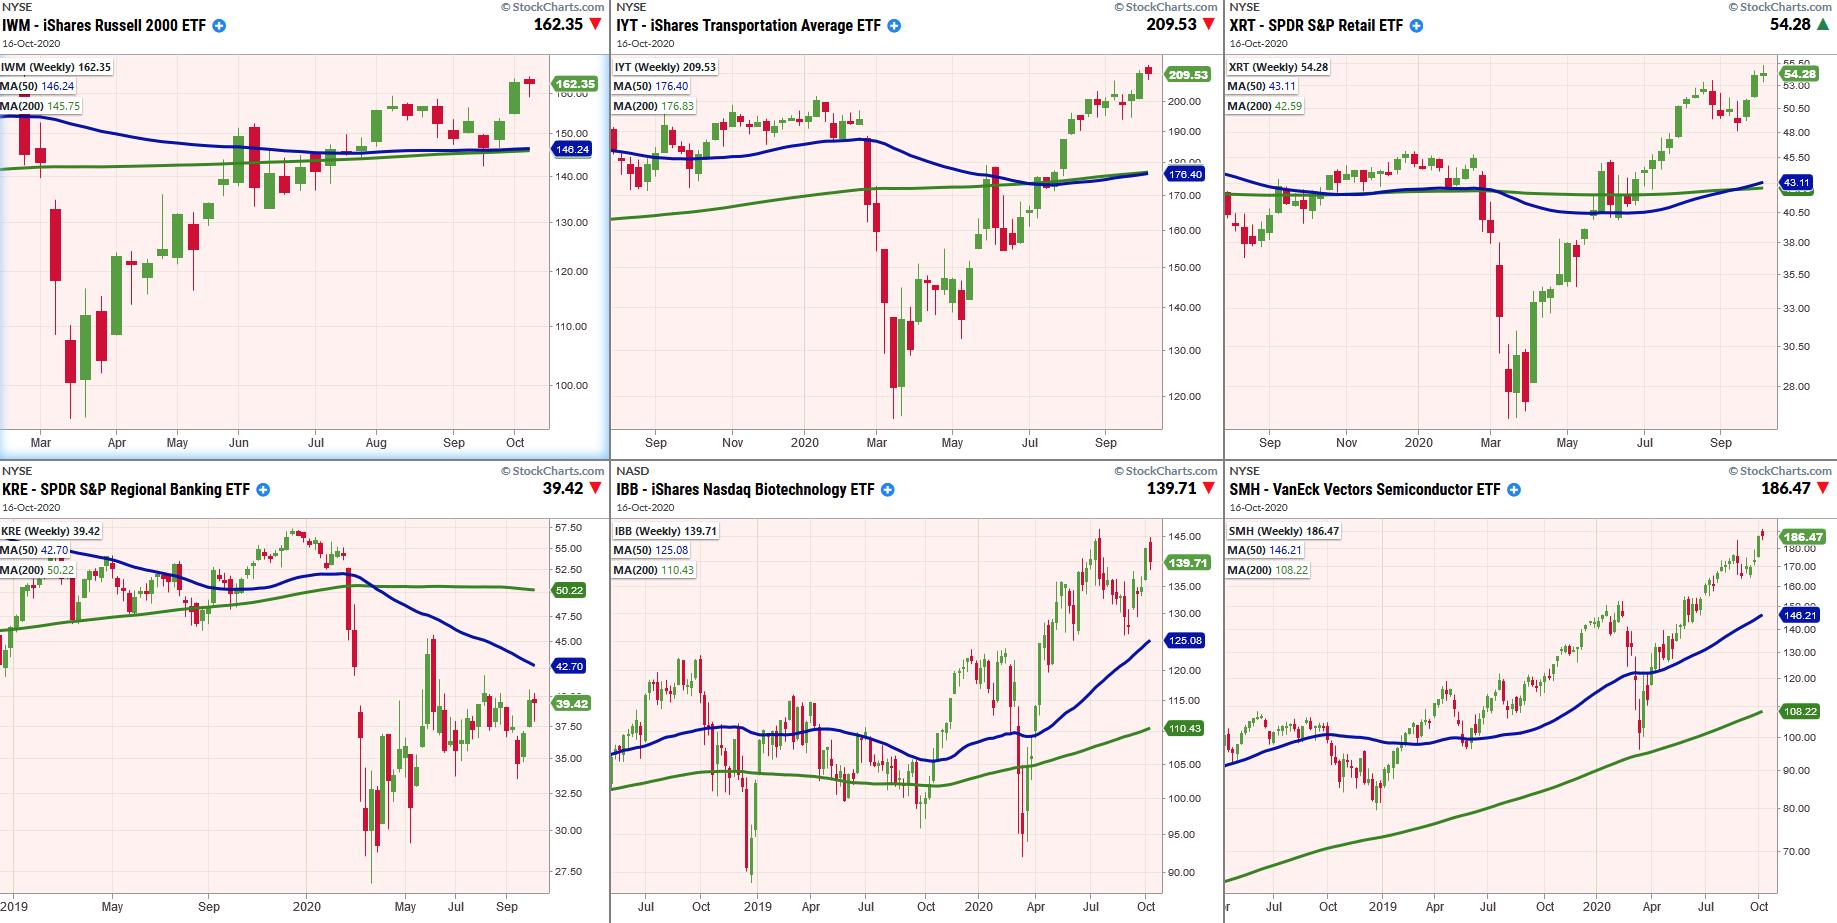
Small-Caps Take the Lead: Can They Hold It?

by Arthur Hill,
Chief Technical Strategist, TrendInvestorPro.com
The Russell 2000 ETF (IWM) rose from the ashes in late September and surged above its summer highs with a double-digit advance. This is quite amazing considering that IWM closed below its 200-day SMA on 24-Sept and was seriously lagging less than a month ago. IWM is...
READ MORE
MEMBERS ONLY

HEALTHCARE PROVIDERS LEAD XLV HIGHER -- MOLINA, HUMANA, AND UNITEDHEALTH HIT NEW RECORDS -- ANTHEM MAY BE NEXT
by John Murphy,
Chief Technical Analyst, StockCharts.com
HEALTH CARE SPDR IS STARTING TO SHOW SOME LEADERSHIP... Healthcare stocks are leading the market higher for a change. The daily bars in Chart 1 show the Health Care SPDR (XLV) nearing a test of its recent highs after finding support near its 50-day moving average. The solid line...
READ MORE
MEMBERS ONLY
Chartwise Women: Sentiment - Harnessing Market Fear
by Mary Ellen McGonagle,
President, MEM Investment Research
by Erin Swenlin,
Vice President, DecisionPoint.com
"How do you feel about that?" In this week's edition of Chartwise Women, Erin and Mary Ellen talk about sentiment and its uncanny ability to mark reversal points. Going beyond merely a definition, Mary Ellen walks us through sentiment prior to presidential election of 2016. Erin...
READ MORE
MEMBERS ONLY

MARKET BREADTH SHOWS IMPROVEMENT -- BANKS CONTINUE TO HOLD FINANCIALS BACK -- WHILE ASSET MANAGERS HAVE TURNED UP -- INCLUDING BLACKROCK, T. ROWE PRICE, AND INVESCO
by John Murphy,
Chief Technical Analyst, StockCharts.com
% OF STOCKS ABOVE MOVING AVERAGES GAIN... Various measures of market breadth have improved over the last month. Chart 1 shows the S&P 500 percent of stocks above their 50-day moving average rising from an oversold low of 25% during September to 78% this week. That's...
READ MORE
MEMBERS ONLY

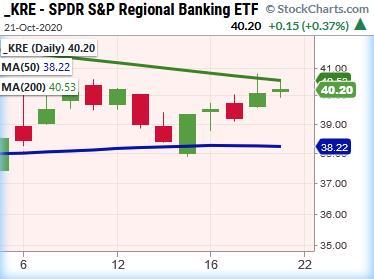
When Will the Financial Sector Stop Riding the Bear?
The banking sector has been put through the ringer since the March selloff. While the market has rallied since then, KRE (Regional Bank ETF) still looks in need of help.
One thing to note is that JPMorgan and Goldman Sachs reported Q3 earnings stronger than expectations. While JPM and GS...
READ MORE
MEMBERS ONLY
More Ways to Time the Markets
by Dave Landry,
Founder, Sentive Trading, LLC
It's Dave's 50th episode! In this edition of Trading Simplified, Dave discusses his experiences in following trends and fighting them. He also continues discussions that were brought up on his prior show. Watch to see some mystery charts, more statistics talk and a look at defining...
READ MORE
MEMBERS ONLY
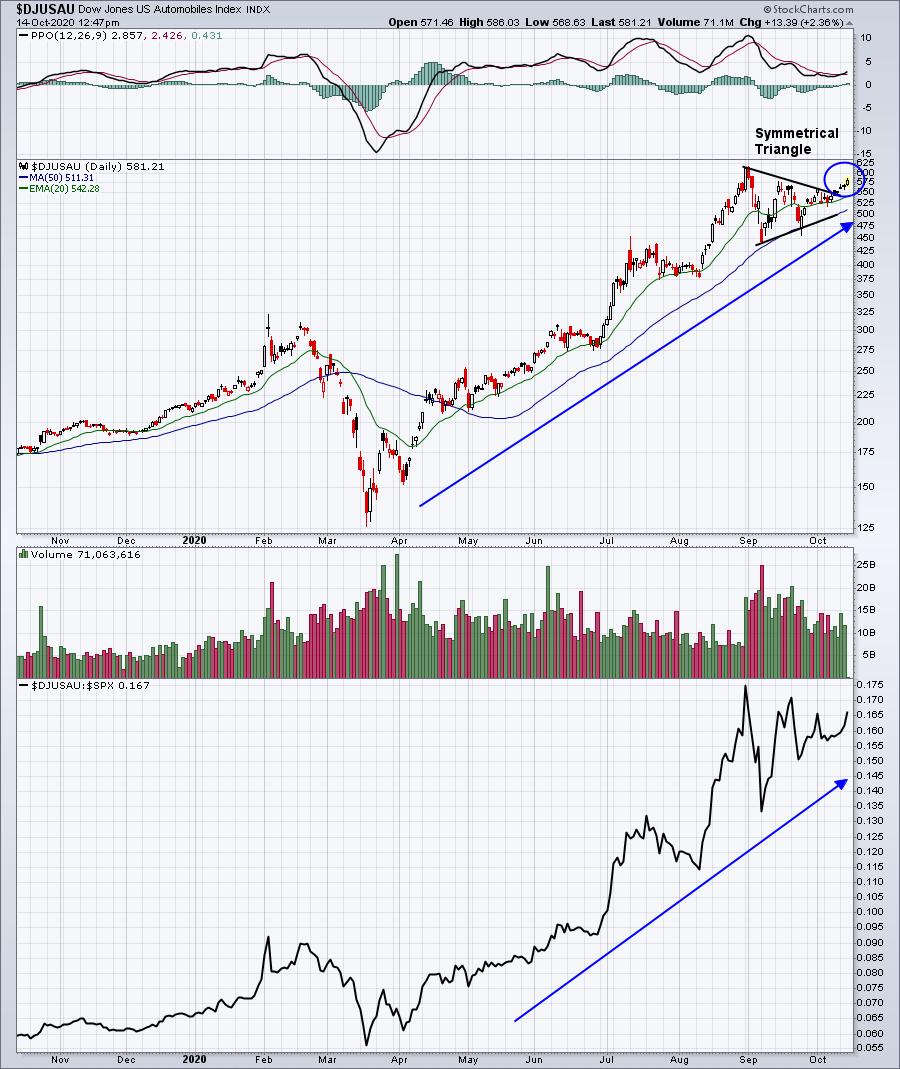
Auto Strength Resuming, These Two Leaders Breaking Out
by Tom Bowley,
Chief Market Strategist, EarningsBeats.com
At EarningsBeats.com, we like to line our portfolios with leaders, and I believe the following chart of autos ($DJUSAU) qualifies as leadership:
We're seeing weakness today in our major indices, but not in autos. Two leaders in this space currently reside in our portfolios and are helping...
READ MORE
MEMBERS ONLY

Evaluating The Likelihood Of An Earnings Beat, PLUS One Company That's Benefiting From The Pandemic
by Tom Bowley,
Chief Market Strategist, EarningsBeats.com
If there's one thing we do really well at EarningsBeats.com, it's evaluate earnings reports and the stock market's reaction to them. I'd even take it one step further. I believe we anticipate upcoming earnings very well. There's a lot...
READ MORE