MEMBERS ONLY

Evaluating The Likelihood Of An Earnings Beat, PLUS One Company That's Benefiting From The Pandemic

by Tom Bowley,
Chief Market Strategist, EarningsBeats.com
If there's one thing we do really well at EarningsBeats.com, it's evaluate earnings reports and the stock market's reaction to them. I'd even take it one step further. I believe we anticipate upcoming earnings very well. There's a lot...
READ MORE
MEMBERS ONLY

The Key to Your Success
I have been trading for many years. However, since I began working with MarketGauge, I have become a much better trader. The major reason, besides the awesome teachers (Mish, Keith, Geoff and James) is that they have taught me to think in terms of a rule-based trading system.
In...
READ MORE
MEMBERS ONLY

Sector Spotlight: RRG L/S Basket Update

by Julius de Kempenaer,
Senior Technical Analyst, StockCharts.com
In this edition of Sector Spotlight, I cover rotational developments over the last two weeks for asset classes and sectors. After that, I take a look at the current positions in the Long/Short basket, which is up well over 10% since March.
This video was originally broadcast on October...
READ MORE
MEMBERS ONLY
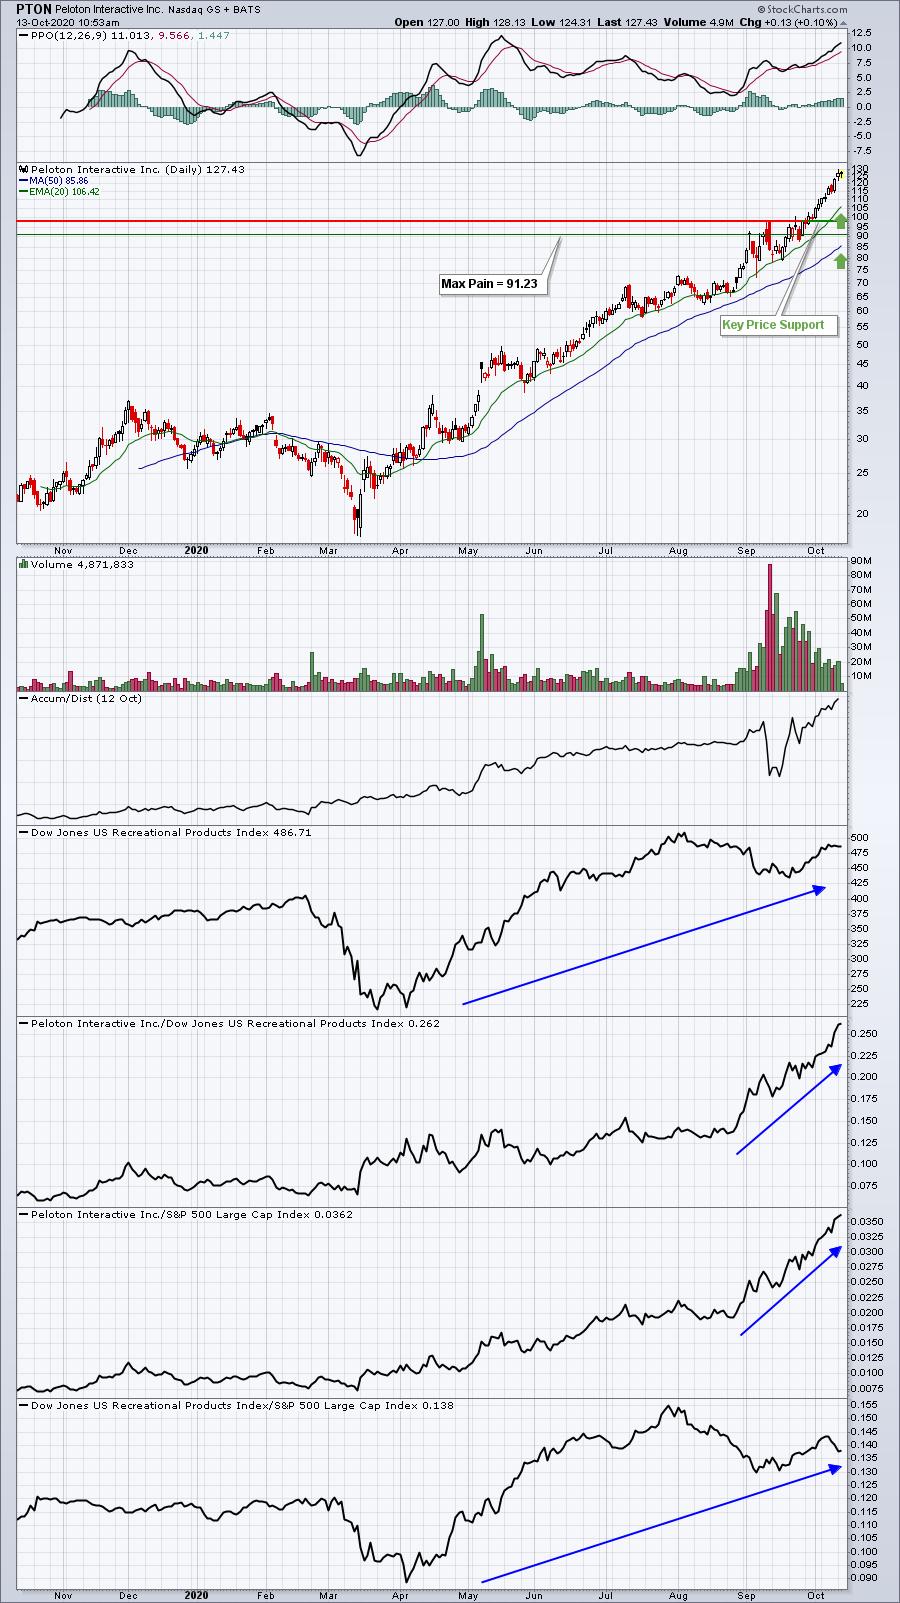
Be VERY Careful If You're Trading Peloton (PTON)
by Tom Bowley,
Chief Market Strategist, EarningsBeats.com
Listen, I'm a big fan of PTON. It was one of my 5 stock picks from StockCharts TV's "The Pitch", which aired on April 1st of this year. It traded at near 27 at the time. Yesterday, PTON closed above 127. That's...
READ MORE
MEMBERS ONLY

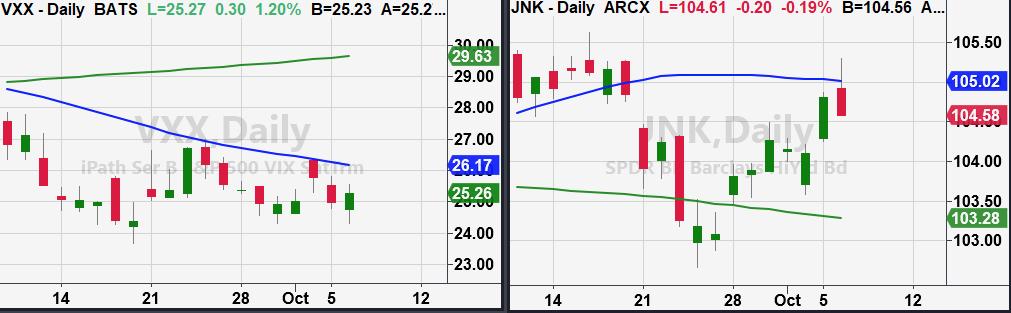
TREASURY ETF TESTS 200-DAY AVERAGE -- CORPORATE BONDS ARE HOLDING UP BETTER -- HIGH YIELD BOND ETF HITS NEW HIGH

by John Murphy,
Chief Technical Analyst, StockCharts.com
20+ YEAR TREASURY ISHARES TEST 200-DAY AVERAGE... The recent rise in Treasury bond yields has pushed bond prices lower. And especially bonds with longer maturities. Chart 1 shows the 20+Year Treasury Bond ETF (TLT) falling to the lowest level since June. More importantly, the TLT is bouncing today...
READ MORE
MEMBERS ONLY

DP Show: 2020 Q2 Earnings Revealed!

by Erin Swenlin,
Vice President, DecisionPoint.com

by Carl Swenlin,
President and Founder, DecisionPoint.com
The market has been running higher and higher and, in this episode of DecisionPoint, Carl and Erin break down the implications of the current vertical rally in technology and the accelerated rising trend for the SPX. Swenlin Trading Oscillators (STOs) could be revealing important information regarding the stamina of the...
READ MORE
MEMBERS ONLY
The Market Runs Rich
The market begins to show some overexuberance as we head into earning season and the election date closes in.
Amazon (AMZN)'s Prime Day and an Apple (AAPL) event are scheduled this week, with other companies, like Target (TGT) and Walmart (WMT) joining in with their own sale events...
READ MORE
MEMBERS ONLY

Short-Term Indicators Argue for an Extension to the Recent Rally

by Martin Pring,
President, Pring Research
Last week, I pointed out that the long-term KST for the ratio between stocks and bonds was close to a buy signal, and that all such signals in the last 30-years had been followed by substantial advances in equity prices (Chart 1). We still don't have...
READ MORE
MEMBERS ONLY

S&P 500 Earnings 2020 Q2: Market Still Extremely Overvalued
by Carl Swenlin,
President and Founder, DecisionPoint.com
As a new earnings season begins, let's look at the finalized results of the last earnings period. The S&P 500 earnings results for 2020 Q2, based upon GAAP earnings (Generally Accepted Accounting Principals), show that the S&P 500 is, as usual, far above the...
READ MORE
MEMBERS ONLY

Finding The Right ETFs To Manage Risk And Beat The S&P 500
by Tom Bowley,
Chief Market Strategist, EarningsBeats.com
Starting today at 4:30pm ET, EarningsBeats.com is excited to unveil a Sneak Preview of its latest product, the Model ETF Portfolio. The concept is rather simple. We plan to do the research to provide our members with a Strong ETF ChartList, highlighting the best performing ETFs from a...
READ MORE
MEMBERS ONLY
Expanding New Highs are Bullish

by David Keller,
President and Chief Strategist, Sierra Alpha Research
I would currently describe myself as a "cautious bull," in that I recognize that the market is trending higher, I'm prepared to follow that trend as long as it continues, and I'm always looking for some signs of potential weakness and/or exhaustion.
Over...
READ MORE
MEMBERS ONLY

Week Ahead: NIFTY at Crucial Resistance Zone; RRG Chart Suggests Staying Highly Sector-Specific

by Milan Vaishnav,
Founder and Technical Analyst, EquityResearch.asia and ChartWizard.ae
The week that went by remained firmly on the expected lines. In the previous weekly note, we had mentioned that the markets may push themselves higher amid increased volatility. The NIFTY indeed closed higher following a strong move, while the volatility also spiked. The financial stocks were expected to perform...
READ MORE
MEMBERS ONLY

Bullish Breadth Thrusts in 5 of the 6 Big Sectors

by Arthur Hill,
Chief Technical Strategist, TrendInvestorPro.com
There are 11 sectors in the S&P 500, but the big six are the only ones we need to be concerned with when making a broad market assessment. The big six account for a whopping 82.5% of the S&P 500, which leaves the other 5...
READ MORE
MEMBERS ONLY

It's Baaaackkkkk! Top 5 Stocks For Q4 2020
by Tom Bowley,
Chief Market Strategist, EarningsBeats.com
Back on April 1st, in the midst of the COVID-19 pandemic, the initial episode of The Pitch was aired on StockCharts TV. Grayson Roze, VP of Operations here at StockCharts.com, Mary Ellen McGonagle, President of MEM Research, and I joined host David Keller and provided our Top 5...
READ MORE
MEMBERS ONLY
These Leading Growth Stocks Just Reversed Their Downtrends

by Mary Ellen McGonagle,
President, MEM Investment Research
The Nasdaq has been in recovery mode over the past 3 weeks after a September rout that left many high-growth Tech stocks underwater. Leading stock Apple (AAPL) was down over 25% from its peak and the stock is still trying to get up off the mat.
Not all recently...
READ MORE
MEMBERS ONLY
Bullish Expansion of New Highs
by David Keller,
President and Chief Strategist, Sierra Alpha Research
I would currently describe myself as a "cautious bull," in that I recognize that the market is trending higher, I'm prepared to follow that trend as long as it continues, and I'm always looking for some signs of potential weakness and/or exhaustion.
Over...
READ MORE
MEMBERS ONLY
Reliable Long-Term Ratio May Be About to Trigger its Seventh Buy Signal for Stocks Since 1995
by Martin Pring,
President, Pring Research
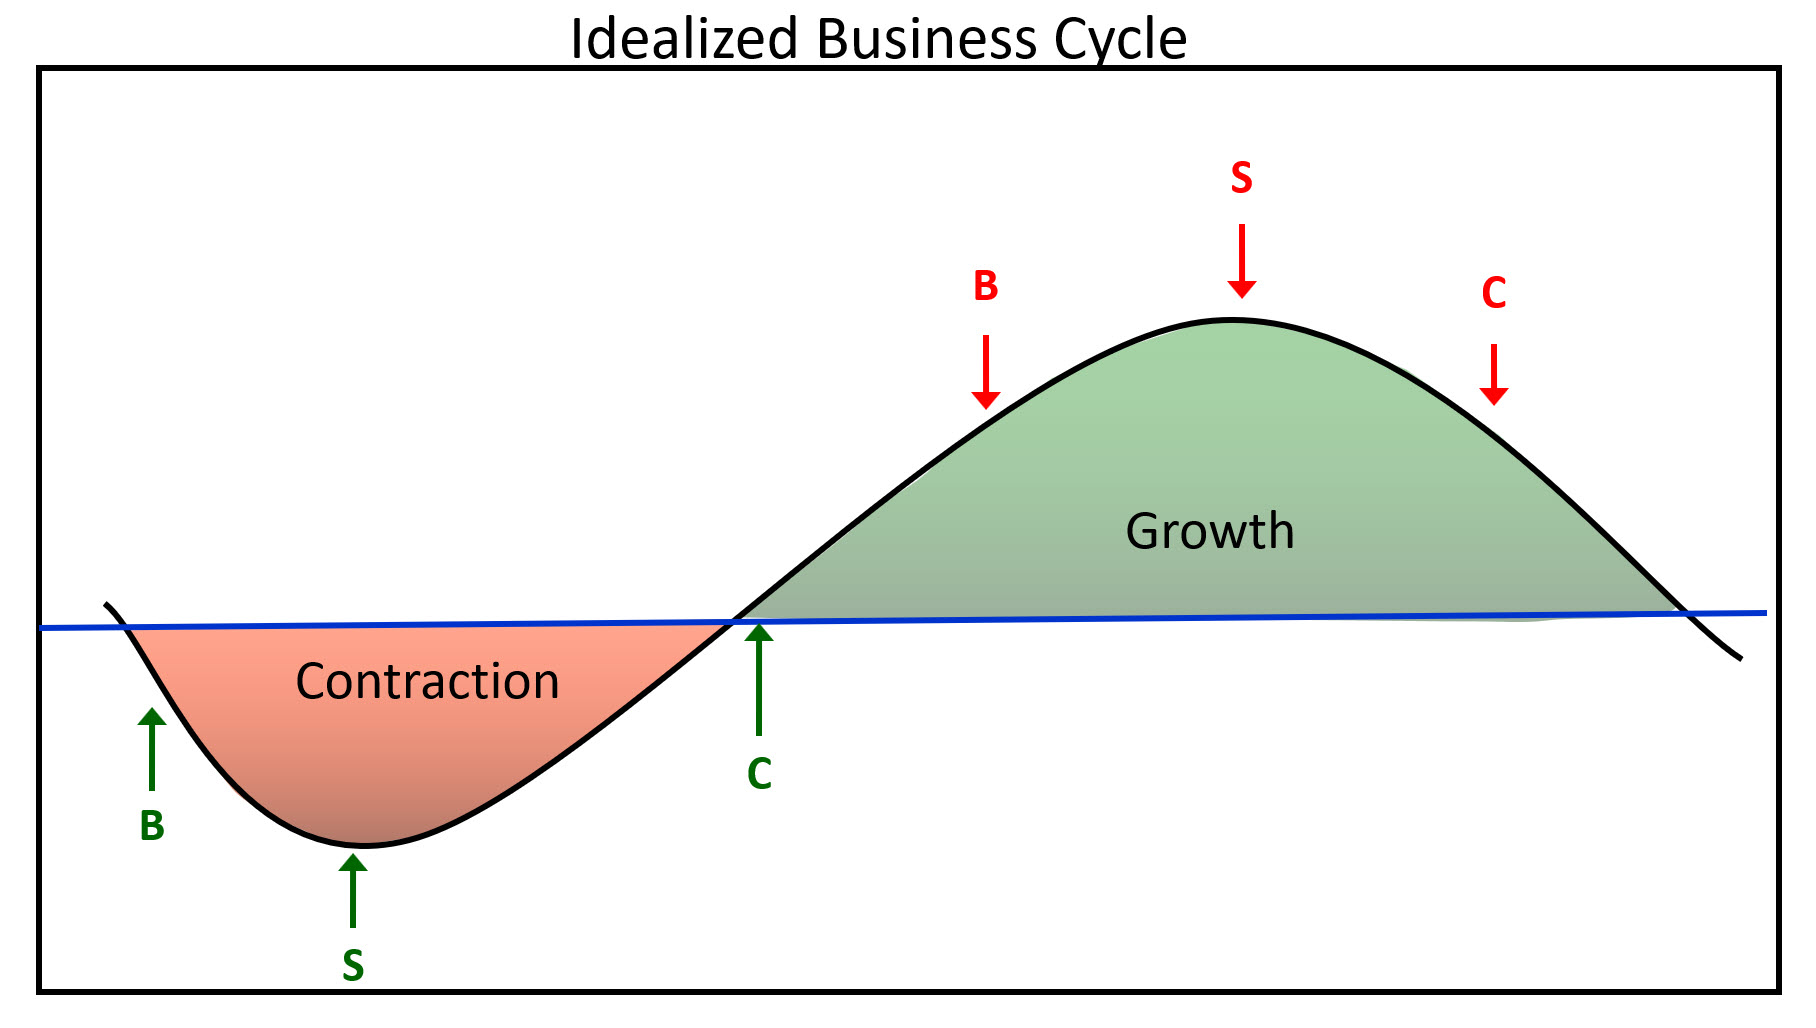
Sometimes, it's a good idea to approach likely market action not so much from an analysis of the market itself, but substituting intermarket or inter-asset relationships to accomplish the same objective. It is a fact that each business cycle goes through a set series of chronological sequences....
READ MORE
MEMBERS ONLY
Happy Days for the Economic Modern Family
Friday showed us that, even with the insecurity of the stimulus package passing and tension from job loss, the Modern Family was still able to close strong for the week.
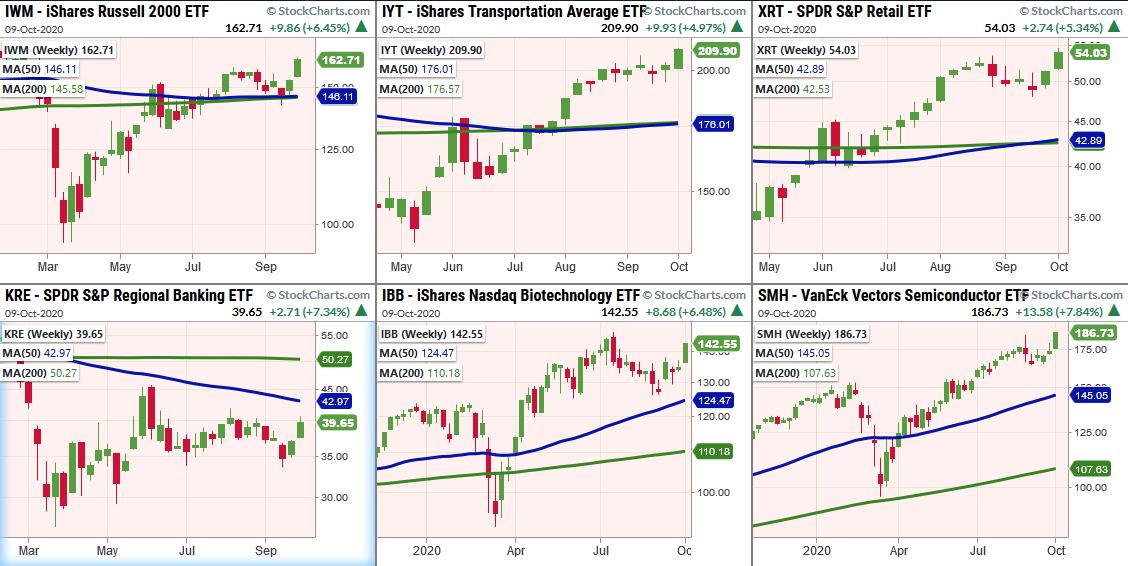
Grandpa Russell (IWM), which has been in a consolidation period for the last 6 weeks, has closed over resistance at...
READ MORE
MEMBERS ONLY

Downtrend Reversals as Market Broadens Out
by Mary Ellen McGonagle,
President, MEM Investment Research
Strength abounds! In this episode of StockCharts TV'sThe MEM Edge, Mary Ellen reviews former leading stocks that have broken back above resistance. She also shares a stealth election play as well as stocks further along in their bid to break out of sound bases.
This video was originally...
READ MORE
MEMBERS ONLY

FALLING DOLLAR BOOSTS METAL PRICES -- GOLD AND SILVER PRICES RISE -- COPPER PRICES NEAR TWO-YEAR HIGH ALONG WITH ITS MINERS -- RISING STOCKS WEAKEN THE DOLLAR
by John Murphy,
Chief Technical Analyst, StockCharts.com
DOLLAR INDEX FALLS BELOW 50-DAY LINE...The dollar is under selling pressure. Part of the reason why may be rising stock prices. The dollar has been moving inversely to stocks over past few months (more on that shortly). It rallied during September when stocks were selling off. And has...
READ MORE
MEMBERS ONLY
Ready For a Melt UP? Bears, It's Checkmate!
by Tom Bowley,
Chief Market Strategist, EarningsBeats.com
I remain firmly in the secular bull market theory camp. We're going higher. Forget about politics, civil unrest, the virus, the deficit, the economy, blah, blah, blah. Money flow, the Fed and historically-low interest rates will fuel higher prices. While each of those is extremely important in...
READ MORE
MEMBERS ONLY

Transportation Stocks Are Confirming More Bullish Action Ahead
by Tom Bowley,
Chief Market Strategist, EarningsBeats.com
It's generally a very good sign to see transportation stocks ($TRAN) breaking to new highs. Currently, the TRAN is at an all-time high and all signs are pointing to continuing strength, as far as I can tell. Transports do well when our economy is strong or when...
READ MORE
MEMBERS ONLY

Chartwise Women: Bullish Setups in Small-Caps!
by Mary Ellen McGonagle,
President, MEM Investment Research
by Erin Swenlin,
Vice President, DecisionPoint.com
Enjoy the little things! In this week's edition of Chartwise Women, Mary Ellen and Erin share the best ways to capitalize on the powerful move into small-cap stocks. They also break down the highest-concentrated area of winners, as well as how to screen for top candidates...
READ MORE
MEMBERS ONLY

S&P VALUE INDEX IS GAINING GROUND -- IT'S GETTING A LOT OF HELP FROM STONGER FINANCIALS AND INDUSTRIALS -- SMALL CAP RALLY CONTINUES
by John Murphy,
Chief Technical Analyst, StockCharts.com
S&P VALUE IS GAINING GROUND... Value stocks are continuing to fuel much of the stock market's recent gains. Chart 1 shows the S&P 500 Value iShares (IVE) rising this week to the highest level in a month. And it's been rising faster...
READ MORE
MEMBERS ONLY

Reliable Long-Term Ratio May Be About to Trigger its Seventh Buy Signal for Stocks Since 1995
by Martin Pring,
President, Pring Research
Sometimes, it's a good idea to approach likely market action not so much from an analysis of the market itself, but substituting intermarket or interasset relationships to accomplish the same objective. It is a fact that each business cycle goes through a set series of chronological sequences. We...
READ MORE
MEMBERS ONLY
The Self-Fulfilling Prophecy
It's interesting how news affects the market. The negative information, paired with human emotion, sends the market frantically lower.
It is also interesting to watch how it creates a self-fulfilling prophecy. When people hear negative news, a common thought is "My goodness, I must sell before...
READ MORE
MEMBERS ONLY
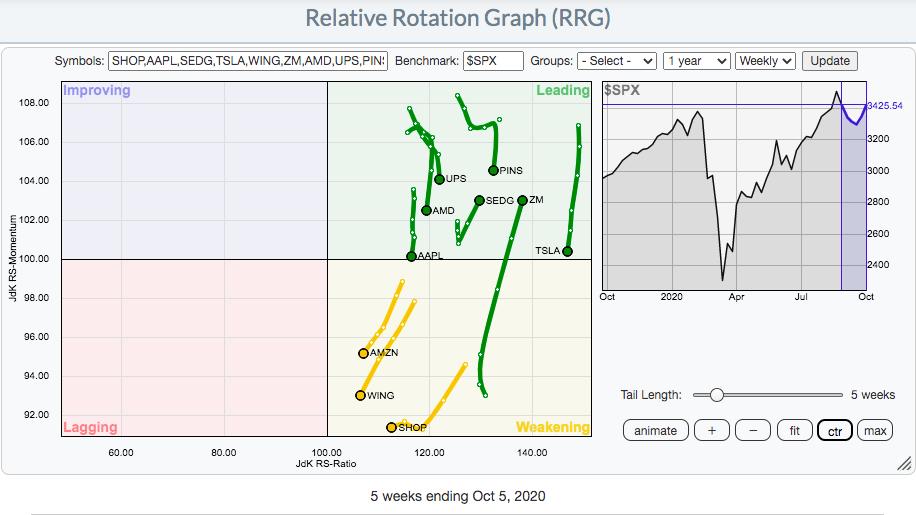
My 10 Favorite Stocks On An RRG Chart
by Tom Bowley,
Chief Market Strategist, EarningsBeats.com
A week ago, I published an article here in the Don't Ignore This Chart blog highlighting two renewable energy stocks ($DWCREE) - SEDG and ENPH. Both have gained in the 25%-30% range in one week. It illustrates how trading leading stocks in leading industry groups can pay off....
READ MORE
MEMBERS ONLY

TRANSPORTS REACH NEW RECORD -- INDUSTRIAL SPDR NEARS UPSIDE BREAKOUT -- STOCKS REGAIN UPSIDE MOMENTUM
by John Murphy,
Chief Technical Analyst, StockCharts.com
DOW TRANPORTS EXCEED 2018 HIGH... Transportation stocks are once again trying for a new record. The weekly bars in Chart 1 show the Dow Transports trying to close decisively above their 2018 high. The transports are being led higher today by airlines and delivery stocks. But rails and trucking stocks...
READ MORE
MEMBERS ONLY

Should You Time the Market?

by Dave Landry,
Founder, Sentive Trading, LLC
In this edition of Trading Simplified, Dave is here to discuss "How Important Is Market Timing?" now that the market has gotten a little "iffy." As Dave puts it, market timing is less about beating the market and more about not letting the market beat you....
READ MORE
MEMBERS ONLY

DP ALERT: Trick or Tweet?
by Erin Swenlin,
Vice President, DecisionPoint.com
(This is a complimentary issue of today's subscriber-only DP Alert report. Get this report every business day on DecisionPoint.com!)
Everything was running smoothly as the market broke above the previous week's trading range. And then...bah bah baaaaah... stimulus talks not only stalled, but...
READ MORE
MEMBERS ONLY
What Do the Technicals Show Us?
These past weeks, we've talked about the market's hopes of a quick stimulus package.
Today showed how easily the market can flip when stimulus hope fades. It also shows that the market can trade higher on expectations, even though it really didn't know what...
READ MORE
MEMBERS ONLY

DELAY IN STIMULUS TALKS SINKS STOCKS -- TEN SECTORS LOSE GROUND -- BOND YIELDS ALSO DROP
by John Murphy,
Chief Technical Analyst, StockCharts.com
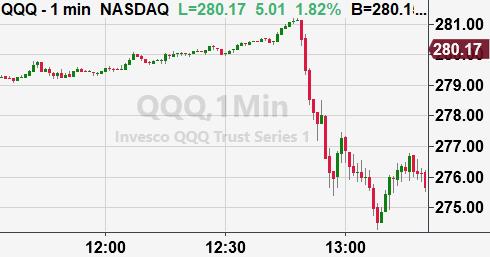
STOCKS SELL OFF IN AFTERNOON TRADING... Stocks fell this afternoon after a presidential tweet pushed stimulus talks until after the November election. The three charts below show major stock indexes reversing lower from chart resistance formed a couple of weeks ago. Ten of eleven sectors also ended the day in...
READ MORE
MEMBERS ONLY

BANKS AND FINANCIALS HAVE A STRONG DAY -- RUSSELL 2000 ISHARES HIT 7-MONTH HIGHS
by John Murphy,
Chief Technical Analyst, StockCharts.com
FINANCIAL SPDR TRIES TO CLEAR 200-DAY LINE... Higher bond yields and a steeper yield curve usually benefit financial stocks and banks in particular. Which helps explain why financials are starting to attract new buying. Chart 1 shows the Financial SPDR (XLF) trading above its 200-day moving average today...
READ MORE
MEMBERS ONLY

Are We Seeing Significant Rotation? Check Out These 3 Industry Groups
by Tom Bowley,
Chief Market Strategist, EarningsBeats.com
The secular bull market is alive and well and the list of industry groups in breakout mode is growing. In addition, there are a few on the cusp of a breakout that bear watching. When a group breaks out, money flows to that area, creating tons of trading/investing opportunities....
READ MORE
MEMBERS ONLY
Biggest Movers in the Modern Family
If the market could talk, it might say that the Economic Modern Family is happy. Perhaps happier than they have been in a long time.
Starting Friday, Forrest and I pointed out that the Russell 2000, Transportation and Retail all closed green in the face of the news on Trump...
READ MORE
MEMBERS ONLY

DP Show: Stalking Energy Stocks - Options Mania
by Erin Swenlin,
Vice President, DecisionPoint.com
by Carl Swenlin,
President and Founder, DecisionPoint.com
In this episode of DecisionPoint, Carl and Erin give us the current market conditions to prepare you for the week ahead. Both discuss what "climax analysis" is all about. Monitoring climactic readings in breadth and the VIX can give you strong clues as to market action in the...
READ MORE
MEMBERS ONLY

BOND YIELDS TOUCH FOUR-MONTH HIGH - THAT'S HELPING FINANCIAL SHARES -- AND VALUE CYCLICAL STOCKS IN GENERAL -- SMALL CAPS SHOW SOME LEADERSHIP
by John Murphy,
Chief Technical Analyst, StockCharts.com
BOND YIELDS TOUCH FOUR-MONTH HIGH... Treasury bond yields continue their rise that started a week ago. And they're overcoming some resistance levels. Chart 1 shows the 30-Year Treasury Yield rising above its late August high to reach the highest level since June. It's also...
READ MORE
MEMBERS ONLY
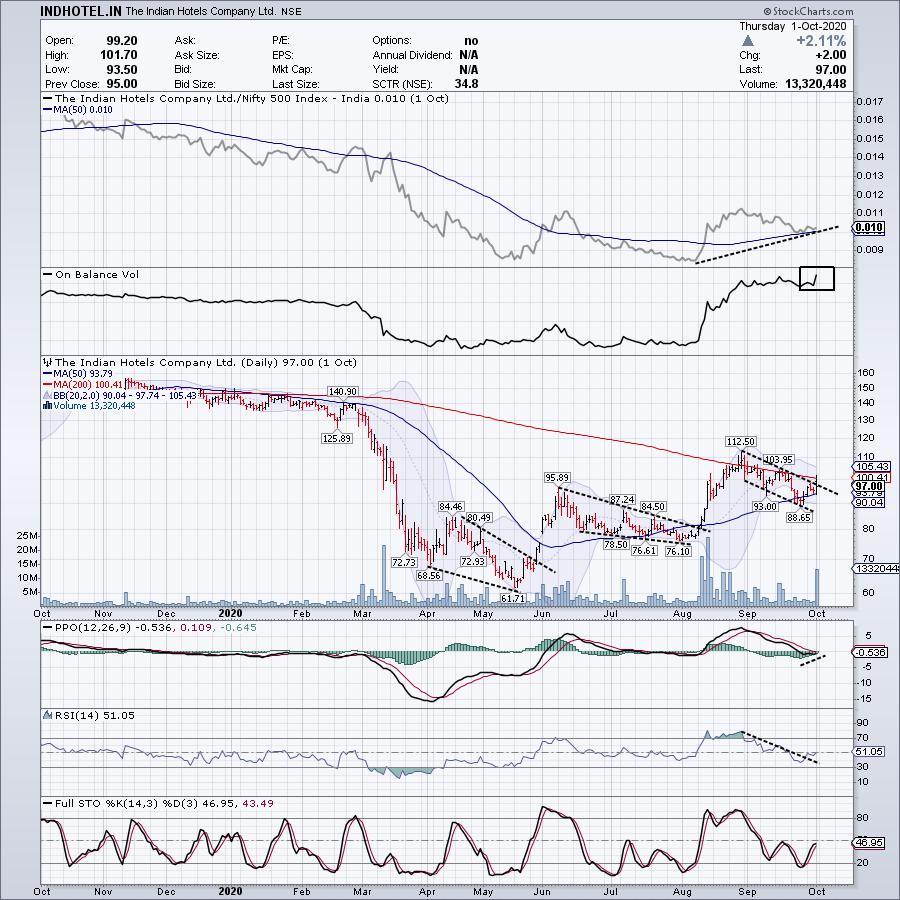
Time to Enjoy the Hospitality Of This Stock for the Medium Term
by Milan Vaishnav,
Founder and Technical Analyst, EquityResearch.asia and ChartWizard.ae
The Indian Hotels Company Ltd (INDHOTEL.IN)
This hospitality stock has formed its bottom in June and is in the process of confirming it by moving past the crucial 200-DMA, to which it has presently resisted. If this level is taken out, we may see this stock extending its...
READ MORE
MEMBERS ONLY

Is This Sector Set to End its Underperformance?
by Milan Vaishnav,
Founder and Technical Analyst, EquityResearch.asia and ChartWizard.ae
Nifty Financial Services Index ($CNXFIN)
The NIFTY Financial Services sector seem to have ended its short-term underperformance. The Index has broken out from a falling channel and has formed a gap, which indicates greater push to the upside.
The RSI has marked a fresh 14-period high, which is...
READ MORE
MEMBERS ONLY

STOCKS END VOLATILE FRIDAY IN THE RED -- BUT GAIN ON THE WEEK -- TECH STOCKS WEAKENED ON FRIDAY WHILE CYCLICAL SECTORS GAINED -- REITS AND UTILITIES LED WEEK'S GAINS -- BOND YIELDS ALSO ROSE
by John Murphy,
Chief Technical Analyst, StockCharts.com
STOCKS END VOLATILE FRIDAY LOWER... Stocks opened sharply lower on Friday on news that President Trump and the First Lady had tested positive for the coronavirus. Then news of some possible fiscal stimulus helped them make back some of their earlier losses. By the end of the day, however, all...
READ MORE