MEMBERS ONLY

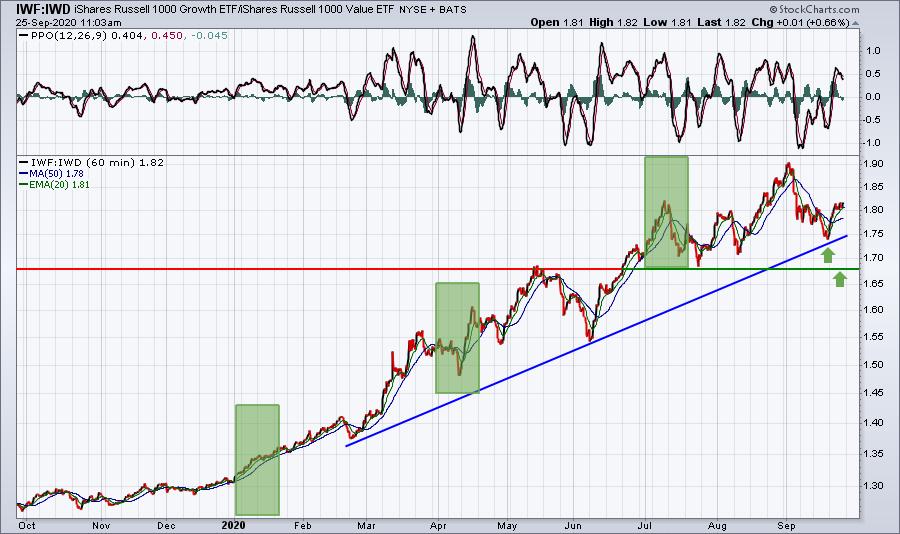
How Can We Tell When The Pandemic-Stricken Groups Begin To Lead?

by Tom Bowley,
Chief Market Strategist, EarningsBeats.com
That's a really good question and one that I'm researching. My view has been (and remains) that the stock market is in a multi-decade secular bull market, one that will carry us into the 2030s. There will be cyclical bear markets along the way, similar...
READ MORE
MEMBERS ONLY

Week Ahead: NIFTY May Try to Push Higher Amid Increased Volatility; RRG Chart Says These Sectors May Start Making Moves

by Milan Vaishnav,
Founder and Technical Analyst, EquityResearch.asia and ChartWizard.ae
The week before this one was quite eventful, as the NIFTY tested all its crucial supports on the daily and weekly charts. The past week saw the NIFTY respecting few crucial support levels on the higher timeframe charts and showing a technical pullback. The four-day trading week showed the...
READ MORE
MEMBERS ONLY
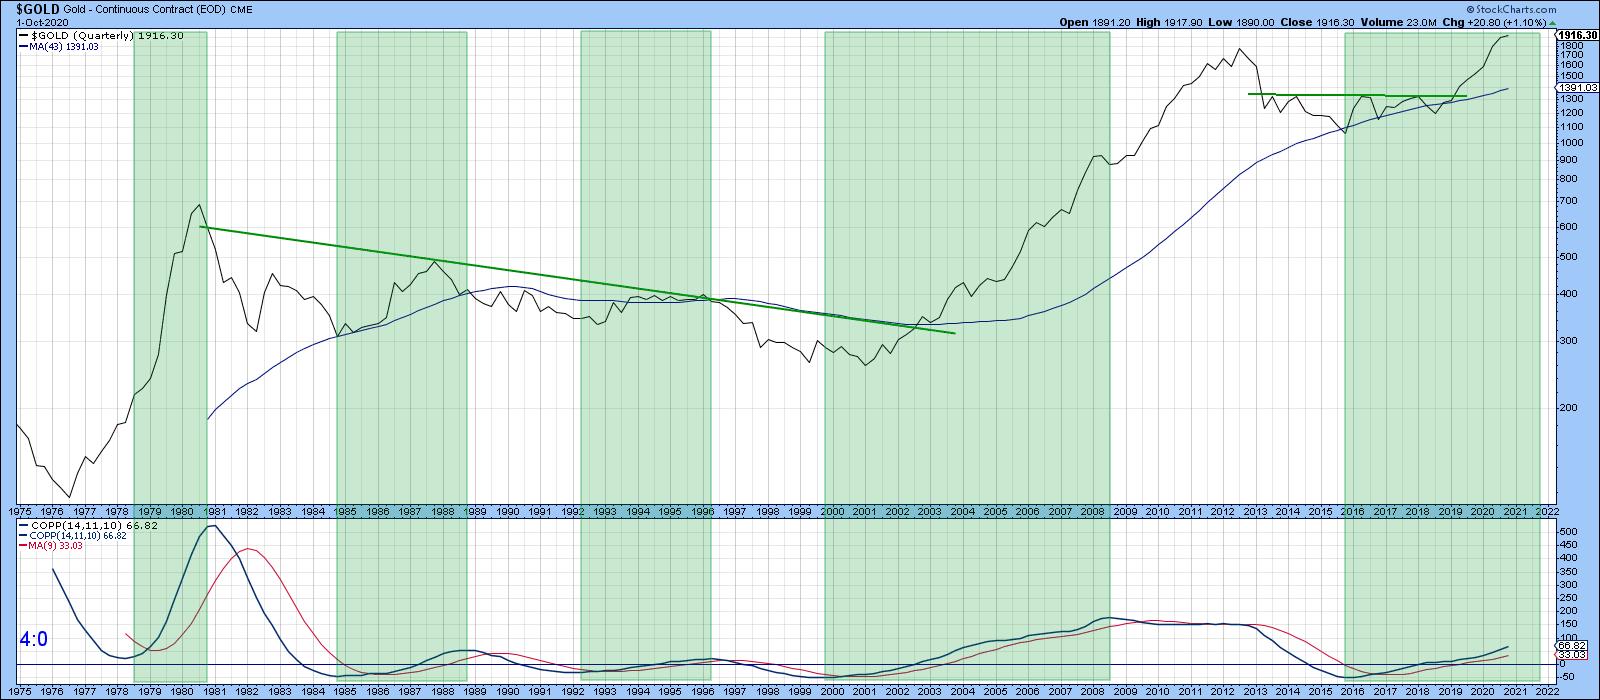
The Gold Bull Market is Likely to Extend Once the Correction Runs its Course

by Martin Pring,
President, Pring Research
Coppock Indicator Using Quarterly Data is Bullish
Long-term Charts show that gold is in a firm uptrend. Take Chart 1, for instance; it tracks the price of the yellow metal on a quarterly basis using a quarterly measure of the Coppock Curve, a momentum indicator originally devised by Edmund...
READ MORE
MEMBERS ONLY
Here are the 2 Stocks Leading Our Powerful Portfolios

by John Hopkins,
President and Co-founder, EarningsBeats.com
It's very true at the moment that this is a "stock pickers" market, meaning it really makes a big difference which individual stocks you are trading unless you focus more on ETFs. For example, as you can see below, one of the stocks in our "...
READ MORE
MEMBERS ONLY
Going "Hog Wild"! & Free DP Trading Room with Julius de Kempenaer

by Erin Swenlin,
Vice President, DecisionPoint.com
While I love bacon, I did not intentionally pick another "pig"-themed headline (referring to my article on the "pig's ear" chart pattern at this link). For this morning's DecisionPoint "Diamond Mine" trading room (for Diamonds subscribers only), I ran...
READ MORE
MEMBERS ONLY
Making Better Trades with Market Timing
Our president and first lady contracted COVID. That yielded a morning gap down, followed by a rally; that rally was partially based on hope for the stimulus.
These are some of the biggest thoughts on trader's minds as of Friday. And, of course, on everyone's mind...
READ MORE
MEMBERS ONLY

Bullish Breakouts as Nasdaq Holds Support

by Mary Ellen McGonagle,
President, MEM Investment Research
In this episode of StockCharts TV'sThe MEM Edge, Mary Ellen reviews stocks breaking out of bases in stronger areas of the market while also uncovering top candidates in newer areas of the market. She also shares what to be on the lookout for in a failed base breakout....
READ MORE
MEMBERS ONLY
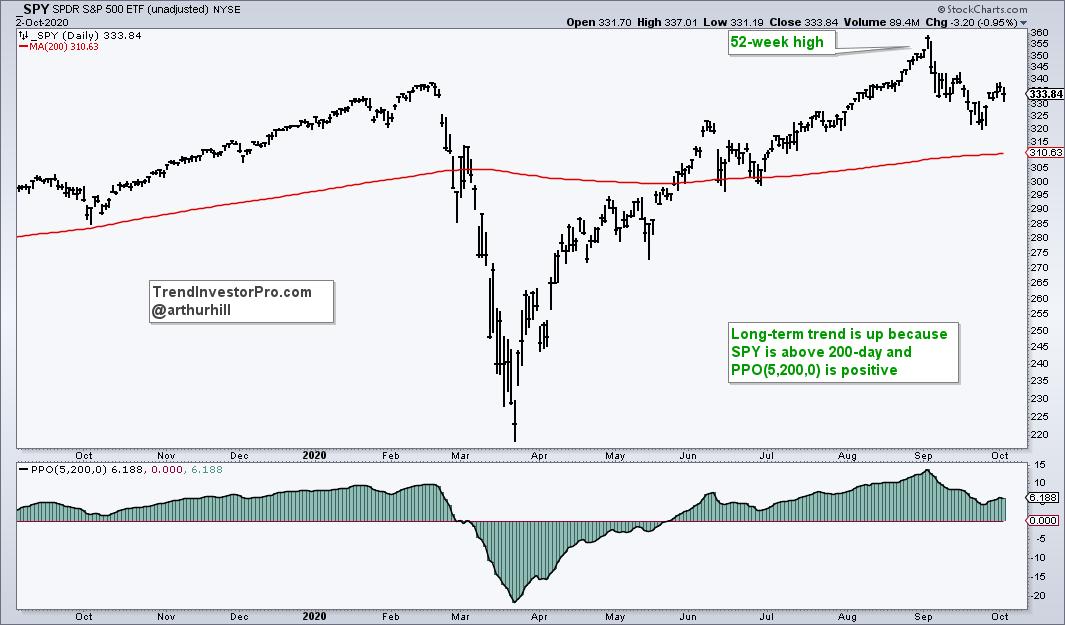
Mind the Gap in SPY

by Arthur Hill,
Chief Technical Strategist, TrendInvestorPro.com
The S&P 500 SPDR (SPY) gapped up on Monday and broke out of a classic correction pattern. The breakout is bullish, but the coast is not entirely clear. Here's what to watch going forward.
First, the long-term trend is up as SPY hit a new...
READ MORE
MEMBERS ONLY
Chartwise Women: Which Stocks Did Best in Q3?
by Mary Ellen McGonagle,
President, MEM Investment Research
by Erin Swenlin,
Vice President, DecisionPoint.com
"And the winner is..." In this week's edition of Chartwise Women, Erin and Mary Ellen host a 3rd Quarter Stock Market Awards Show! See not only the best performers in categories like Best Technology Stock, Best Growth Stock and Best in Show, but also the granddaddy...
READ MORE
MEMBERS ONLY
How to React to a Choppy Market
We've recently talked about higher volatility in the market with the election date closing in. In these past couple of weeks, we've seen the market jump around quite a bit. We're in a choppy market environment, and while three of the 4 major indices...
READ MORE
MEMBERS ONLY

The Gold Bull Market is Likely to Extend Once the Correction Runs its Course
by Martin Pring,
President, Pring Research
* Coppock Indicator Using Quarterly Data is Bullish
* Monthly-Based Gold Model is a Long Way from a Sell Signal
* Inflation-Adjusted Gold at Mega Resistance
* When Will the Correction Have Run its Course?
Coppock Indicator Using Quarterly Data is Bullish
Long-term Charts show that gold is in a firm...
READ MORE
MEMBERS ONLY

The Next Market Low and Election Rally

by Larry Williams,
Veteran Investor and Author
On this special episode of Real Trading with Larry Williams, Larry is back to give a follow-up on his last special regarding Chinese stocks, with an aside for Korea. He then discusses the "Uncle Sam" index and his exclusive ACP Plug-In indicators, followed by an overview...
READ MORE
MEMBERS ONLY

Ever Wondered How To Create A User-Defined Index (UDI) At StockCharts.com?
by Tom Bowley,
Chief Market Strategist, EarningsBeats.com
Well, I plan to host a free webinar on Saturday to demonstrate how we use this cool StockCharts.com feature to track our portfolios at EarningsBeats.com. In the StockCharts.com "Support Center", you'll find many examples of why you might want to consider using a...
READ MORE
MEMBERS ONLY
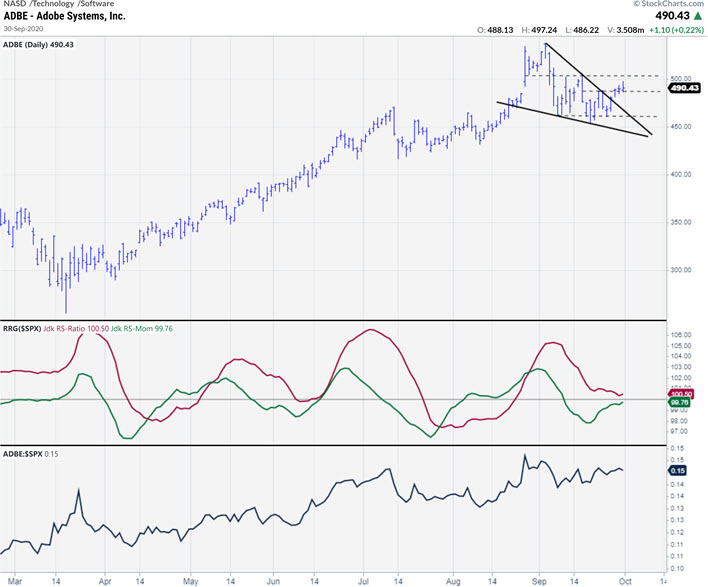
ADBE Setting Up For a New Rally

by Julius de Kempenaer,
Senior Technical Analyst, StockCharts.com
The chart above shows the daily price bars for ADBE, in combination with the RRG-Lines and raw Relative Strength.
There are two reasons to use this chart today. The first is to make sure all of you are aware of the rapid further development of the new ACP platform...
READ MORE
MEMBERS ONLY
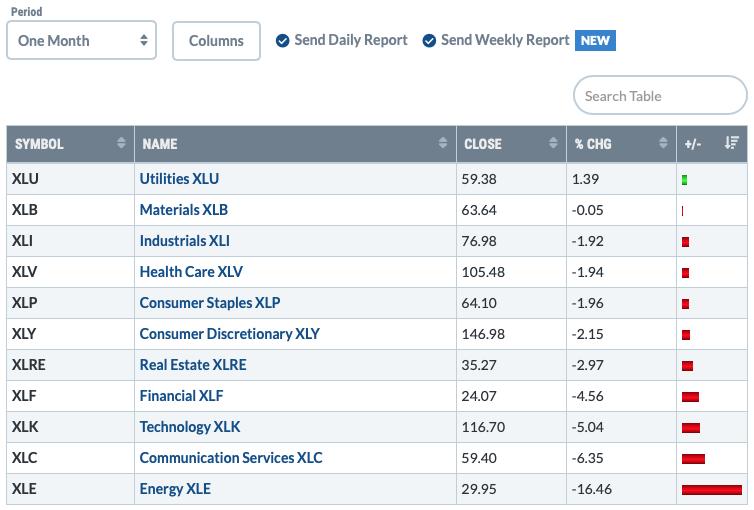
Utilities Were the Only Sector to Close Higher This Month?
by Erin Swenlin,
Vice President, DecisionPoint.com
(This is an excerpt from today's member only DecisionPoint Alert on DecisionPoint.com)
The Utilities SPDR (XLU) is the only sector that is up over the past month. Yes! It surprised me too, but you can see the graphic below! Yet today, we have an IT Trend Model...
READ MORE
MEMBERS ONLY
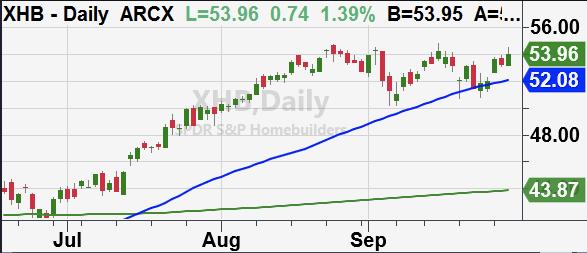
Time to Keep an Eye on Homebuilders
It's time to start watching the homebuilding sector. We can look at this using the symbol XHB, which is an ETF based off the SPY.
The reason that homebuilders are interesting right now is because they have been outperforming all the other sectors in the US economy based...
READ MORE
MEMBERS ONLY

Learning From Your Trading Mistakes

by Dave Landry,
Founder, Sentive Trading, LLC
In this edition of Trading Simplified, Dave discusses a recent mistake that cost him thousands in profits. More importantly, he presents simple steps that you can take to avoid making these types of costly mistakes. Afterwards, Dave continues his discussion of showing the methodology in action with recent examples. Finally,...
READ MORE
MEMBERS ONLY

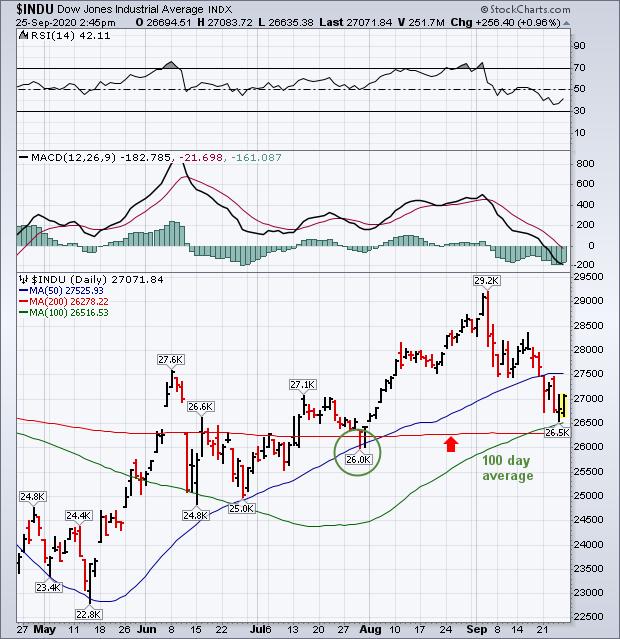
STOCKS HAVE ANOTHER STRONG DAY -- BOND YIELDS ARE ALSO CLIMBING

by John Murphy,
Chief Technical Analyst, StockCharts.com
STOCKS INDEXES GAIN MORE GROUND... Stocks are building on their earlier gains from Monday and are trading above their 50-day lines as shown on the three following charts. Chart 1 shows that the next test of overhead resistance for the Dow Industrials could come at at 28,400 which...
READ MORE
MEMBERS ONLY

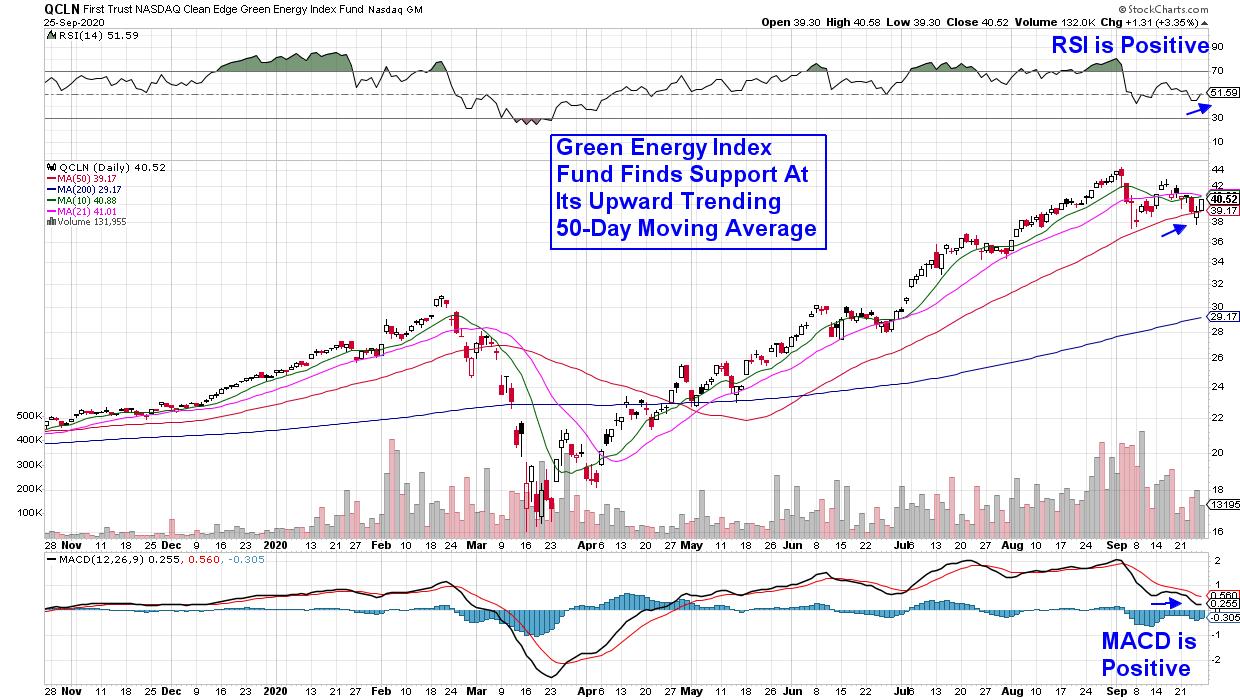
Solar Edge (SEDG) and Enphase Energy (ENPH) Break Out, Lead Renewables
by Tom Bowley,
Chief Market Strategist, EarningsBeats.com
Leading stocks in leading industry groups.
If you've struggled with your investments, read that line over and over again. Investing in leaders will change your returns and likely alter your opinion about your chances to outperform the overall market. Our Model Portfolio has now returned +148.21% in...
READ MORE
MEMBERS ONLY

Q4 Holds Big Challenges, Are You Ready For Them?
by Tom Bowley,
Chief Market Strategist, EarningsBeats.com
We held a "Market Vision 2020" event at EarningsBeats.com back on January 5th and were joined by several long-time StockCharts.com contributors, including John Murphy. I credit John for a lot of my intermarket relationship knowledge as his work over the years truly inspired me to...
READ MORE
MEMBERS ONLY

Formerly Leading Stocks Exhibiting Downtrend Reversals
by Mary Ellen McGonagle,
President, MEM Investment Research
The Nasdaq Composite broke back above its key 50-day moving average on Monday and after today's action, the RSI and MACD are now in positive positions.
A number of underlying stocks from this Tech-heavy index are also exhibiting bullish downtrend reversals and below is a chart...
READ MORE
MEMBERS ONLY

Sector Spotlight: Tech & Comm Rally Into October
by Julius de Kempenaer,
Senior Technical Analyst, StockCharts.com
In this edition of Sector Spotlight, with September drawing to an end, I dive into the monthly seasonality, finding some very interesting seasonal patterns for Technology and Communication Services on the one hand and Energy and Health Care on the other. History suggests a 2% out-performance for Technology in...
READ MORE
MEMBERS ONLY

The Benefits of a Consistent Imperfect Routine

by David Keller,
President and Chief Strategist, Sierra Alpha Research
A consistent imperfect routine is way better than an inconsistent perfect routine.
When I've worked with investors that are new to technical analysis, I often find that they spend too much time trying to perfect their analytical approach on a particular chart, and way too little time determining...
READ MORE
MEMBERS ONLY

DP Show: Bullish Falling Wedges Everywhere!
by Erin Swenlin,
Vice President, DecisionPoint.com
In this episode of DecisionPoint, Erin, flying solo today, reviews Carl's ChartList of the "S&P 10" which includes the FAANG stocks and other large-cap names that sway the S&P 500. Those charts are FULL of bullish falling wedges! Erin covers the...
READ MORE
MEMBERS ONLY

Risk vs. Reward and The Never-Ending Battle
Today's large gap up in the indices can pose some great morning questions. The biggest one being, should I buy the gap, or should I wait to see where things go?
You don't want to chase the market, but you don't want to miss...
READ MORE
MEMBERS ONLY

Short Term Rotations Put XLC and XLK Back in Favor Again on Relative Rotation Graph
by Julius de Kempenaer,
Senior Technical Analyst, StockCharts.com
The erratic rotations that we discussed last week are still ongoing. Looking back at the rotational action on the RRG for US sectors last week shows that the focus of investors is shifting back to Technology and Communication Services again.
Despite being inside the lagging quadrant, XLK showed the strongest...
READ MORE
MEMBERS ONLY

MAJOR STOCK INDEXES TRADE ABOVE THEIR 50-DAY AVERAGES -- ALL ELEVEN SECTORS ARE IN THE GREEN -- SMALL CAPS AND TRANSPORTS ARE STRONG
by John Murphy,
Chief Technical Analyst, StockCharts.com
STOCK INDEXES REGAIN THEIR 50-DAY LINES... Global stocks are starting the week on a strong note. The three major stock indexes shown below are all trading above their 50-day moving average lines. That strengthens their short-term trend and puts them in position to regain some ground lost...
READ MORE
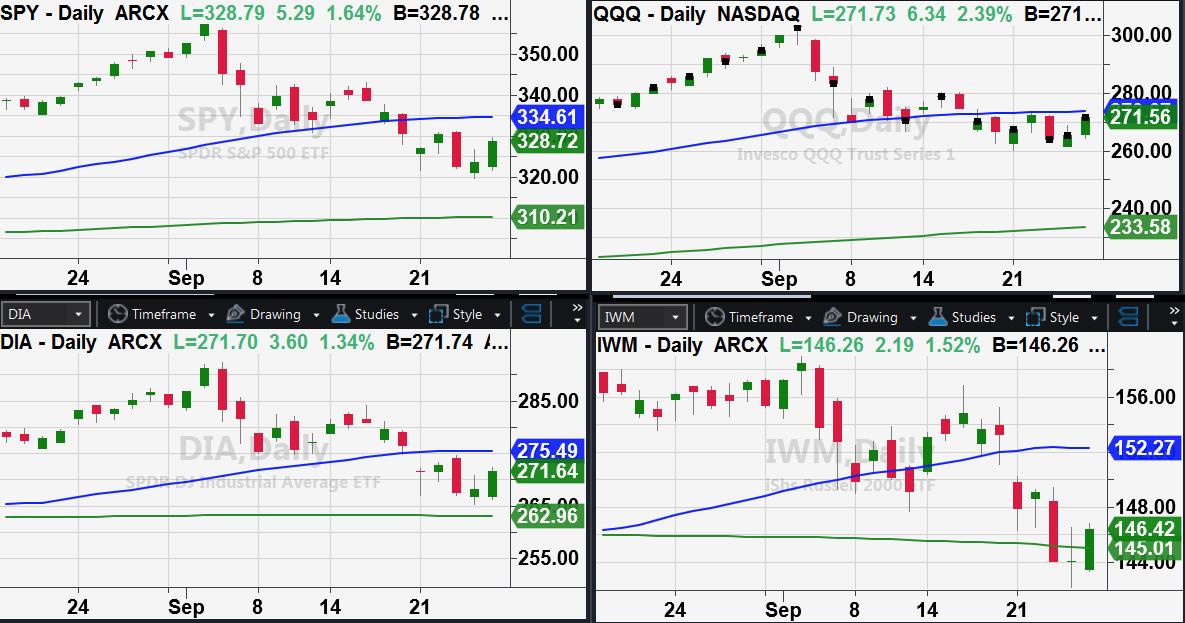
MEMBERS ONLY

2 Equity ETFs Holding Up Well in September
by Arthur Hill,
Chief Technical Strategist, TrendInvestorPro.com
The S&P 500 SPDR is down around 6% this month and QQQ is down around 8%. These two hit new highs on September 2nd, plunged the next three trading days and then worked their way lower. Both are below their 50-day moving averages for the first time...
READ MORE
MEMBERS ONLY

Bullish Rotation Suggesting Bottom Is In; 2 Downtrend Reversal Candidates
by Tom Bowley,
Chief Market Strategist, EarningsBeats.com
Note
First, just over one year ago, I returned to EarningsBeats.com as its Chief Market Strategist. I want to thank all of you that have supported me in my return. I think we've weathered a brutal year in great fashion. Here are the one year returns on...
READ MORE
MEMBERS ONLY

Crucial Week Ahead: NIFTY Set to Deal with Multiple Important Technical Setups; RRG Chart Points Towards Sector-Specific Moves
by Milan Vaishnav,
Founder and Technical Analyst, EquityResearch.asia and ChartWizard.ae
Unlike the previous week that had stayed uneventful for the markets, the Indian equities witnessed an immensely volatile week that ended this Friday, September 25, 2020. The markets saw a good start to the week, but the second half of the week stayed terribly volatile, with the markets ending with...
READ MORE
MEMBERS ONLY
Applying Moving Averages to the Three Major Stock Indexes
by John Murphy,
Chief Technical Analyst, StockCharts.com
A lot more attention is being paid to moving average lines this month because they help determine where potential support and resistance levels may lie. Two that have been mentioned quite a bit lately are the 50- and 200-day averages. Moves above and below the 50-day lines help...
READ MORE
MEMBERS ONLY
This Red-Hot Area Doesn't Care What's Going On In The Rest Of The Markets
by Mary Ellen McGonagle,
President, MEM Investment Research
While economic worries have brought the S&P 500 to the brink of a correction this week (defined as a loss of 10% or more from its 52-week high), there's been one area of the market that's holding in remarkably well with several stocks...
READ MORE
MEMBERS ONLY
Better Routines Lead to Better Results
by David Keller,
President and Chief Strategist, Sierra Alpha Research
A consistent imperfect routine is way better than an inconsistent perfect routine.
When I've worked with investors that are new to technical analysis, I often find that they spend too much time trying to perfect their analytical approach on a particular chart, and way too little time determining...
READ MORE
MEMBERS ONLY
Buy on Rumor? I'm Expecting A BIG Pre-Earnings Surge in These 3 Stocks
by Tom Bowley,
Chief Market Strategist, EarningsBeats.com
Ever heard of the old Wall Street adage, "buy on rumor, sell on news"? You most likely have and, in my opinion, it applies more to earnings season than anything else. Wall Street firms send their analysts out to meet with management teams prior to the end of...
READ MORE
MEMBERS ONLY
Market Indices Phased and Confused
Coming into the weekend, we have more time to look over our charts, gather our thoughts and take a step back to grasp the larger picture. So, let's get right to it!
From bullish to caution. This is the current phase the major indices have recently switched to....
READ MORE
MEMBERS ONLY

Leadership Areas for the Next Leg Up
by Mary Ellen McGonagle,
President, MEM Investment Research
In this episode of StockCharts TV'sThe MEM Edge, Mary Ellen looks at turnaround candidates as the markets begin to stabilize, as well as stocks that are breaking out to new highs. Also, for nimble traders, she shares the art of using intraday charts to profit from stocks that...
READ MORE
MEMBERS ONLY

APPLYING MOVING AVERAGES TO THE THREE MAJOR STOCK INDEXES
by John Murphy,
Chief Technical Analyst, StockCharts.com
DOW AND S&P 500 TRY TO STABILIZE NEAR MOVING AVERAGE LINES... A lot more attention is being paid to moving average lines this month because they help determine where potential support and resistance levels may lie. Two that have been mentioned quite a bit lately are the 50-...
READ MORE
MEMBERS ONLY
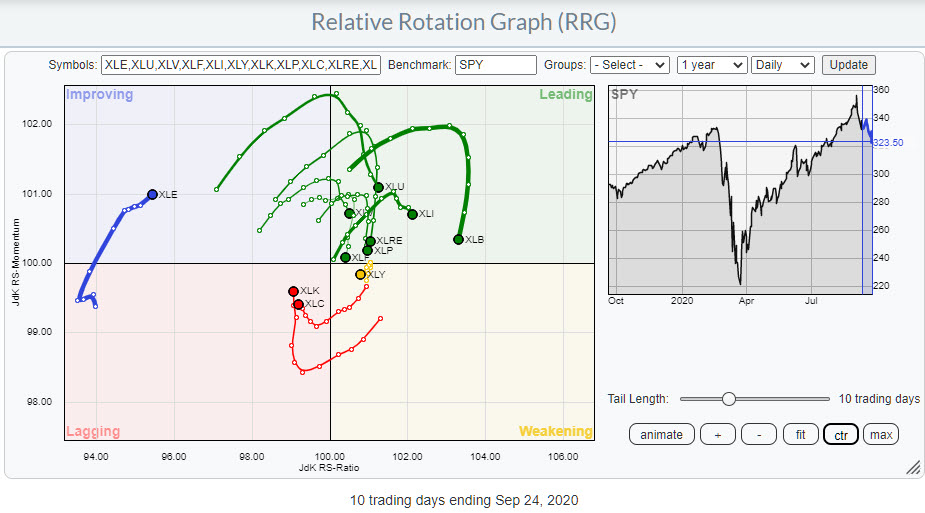
What Does It Mean When Sectors Fly All Over the Place?
by Julius de Kempenaer,
Senior Technical Analyst, StockCharts.com
The Relative Rotation Graph above shows the rotation for US sectors on a daily basis over roughly the last two weeks.
The most important observation that we can make from this image is that the rotation currently is very erratic. The tails do not last very long in one quadrant...
READ MORE
MEMBERS ONLY

Navigating Through the Market's Choppy Waters
Today the QQQs, SPY, and DIA, closed near the September 21st lows which we noted as possible support.
While we rallied intraday, we also sold off, giving back most of the days upward progress.
The VXX also failed to break through the 50-DMA to the upside, but It'...
READ MORE
MEMBERS ONLY

Chartwise Women: Get Ready for a Market Recovery
by Mary Ellen McGonagle,
President, MEM Investment Research
by Erin Swenlin,
Vice President, DecisionPoint.com
Draft your dream team of stocks! In this week's edition of Chartwise Women, Mary Ellen and Erin share their best practices to screen for stocks that are more likely to outperform the markets once the downward pressure is lifted. They also outline what signals will tell you when...
READ MORE