MEMBERS ONLY

Sugar - Is It Bottoming Again?
Sugar futures, or the sugar continuous contract (you can also check out the July contract SBN20), rallied 4.5% today, leaving a potential bottoming pattern. Again.
This is important for 2 reasons. First, sugar is tied to ethanol, so that could signal that the worst of the oil debacle is...
READ MORE
MEMBERS ONLY

The Rally Could Continue, But I Wouldn't Bet My House on It

by Dave Landry,
Founder, Sentive Trading, LLC
Editor's Note: This article was originally published on Tuesday, April 28th at DaveLandry.com.
In my 04/20/20 Bear Market Update, I wrote about the man on the street as a microcosm. In that article, I mentioned that one of the contractors for my house (the "...
READ MORE
MEMBERS ONLY

STOCKS CLIMB ON ENCOURAGING DRUG NEWS -- S&P 500 APPROACHES 200-DAY AVERAGE -- GOOGLE AND FACEBOOK LEAD XLC HIGHER -- XLY NEARS ITS 200-DAY LINE

by John Murphy,
Chief Technical Analyst, StockCharts.com
S&P 500 NEARS TEST OF 200-DAY AVERAGE...A positive report by Gilead Sciences on its Covid-19 drug helped stocks get off to a strong start today. The biotech stock is up 3% this morning on that report. Chart 1 shows the S&P 500 gaining more than...
READ MORE
MEMBERS ONLY

Technology Sector on the Verge of a BUY Signal, Maybe Too Late.

by Carl Swenlin,
President and Founder, DecisionPoint.com
The Technology Sector (XLK) 20EMA is on the verge of crossing up through the 50EMA, a Silver Cross, which will generate an IT Trend Model BUY signal. Since price is well above the 20EMA, the crossover will probably take place tomorrow, or the day after. One thing that could prevent...
READ MORE
MEMBERS ONLY

Gold - From Monthly Dojis to Today
On March 31st, I tweeted about the gold ETF (GLD). Let me just say, it is a good thing I do not rate my trading advice on the number of likes I get.
So, with the tweet spot on, the very next day, me and my MMM Advantage members entered...
READ MORE
MEMBERS ONLY
Sector Spotlight: What Sectors are Rotating This Week?

by Julius de Kempenaer,
Senior Technical Analyst, StockCharts.com
On this episode of Sector Spotlight, I begin with a quick overview of what happened with asset classes and sectors in the markets last week. Afterwards, I take a look at the current state of sector rotation and finish up with an in-depth look at the relative rotation for all...
READ MORE
MEMBERS ONLY

The Simplest & Most Rounded Way to Look at Price
Back in the days, on the Commodities Exchanges, we had no social media and little in the way of technical indicators. But what we had was PURE price action.
In that spirit, today, we have everything a trader could hope for, and probably too much of it.
That does not...
READ MORE
MEMBERS ONLY

DOW AND S&P 500 CLEAR 50-DAY LINES -- SMALL CAPS HAVE A STRONG DAY -- FALLING VIX ALSO SUPPORTS HIGHER STOCK PRICES
by John Murphy,
Chief Technical Analyst, StockCharts.com
DOW AND S&P 500 CLEAR 50-DAY LINES...Stocks spent Monday extending the rebound that started two months ago. And they continue to overcome some overhead resistance barriers. Chart 1 shows the Dow Industrials trading back above its 50-average for the first time since February. While Chart 2 shows...
READ MORE
MEMBERS ONLY
Stop Listening To The Pessimists; Wall Street Continues To Accumulate Your Shares

by Tom Bowley,
Chief Market Strategist, EarningsBeats.com
Below is the Daily Market Report (DMR) that I send out to EarningsBeats.com members every day that the stock market is open. I keep our members posted as to key developments, including what's driving the stock market in both the short-term and long-term. One key factor is...
READ MORE
MEMBERS ONLY

With No Signs of Equities Bottoming Out, These Two Charts Tell an Interesting Story

by Milan Vaishnav,
Founder and Technical Analyst, EquityResearch.asia and ChartWizard.ae
After declining over 35% from the 2020 peaks, the global equity markets found a temporary base, and, in the current technical pullback, have recouped over one-third of total losses. Traders and investors alike have formed differing opinions on whether the equities have bottomed out as they pulled back over the...
READ MORE
MEMBERS ONLY

Stride of the Market in Peril?

by Bruce Fraser,
Industry-leading "Wyckoffian"
Wyckoffian trendline analysis is a very powerful and useful tool. The stride of a trend is often set very early in the uptrend. This analysis is fractal in nature and can be employed in timeframes from very short term to very long term. If the stride is set early a...
READ MORE
MEMBERS ONLY

STOCK REBOUND REMAINS INTACT --BUT LONGER-TERM TREND REMAINS IN DOUBT -- HEALTHCARE AND TECH ACCOUNT FOR THIRD OF SPX -- EQUAL-WEIGHT S&P 500 ETF LAGS BEHIND
by John Murphy,
Chief Technical Analyst, StockCharts.com
MAJOR STOCK INDEXES END WEEK SLIGHTLY LOWER...After an unusually volatile week which included a plunge in the price of oil below zero, major stock indexes ended the week with small losses. Which leaves their overall trend patterns little changed. Chart 1 shows the Dow Industrials ending the week just...
READ MORE
MEMBERS ONLY
This Stock Could Be Setting Up For A Mammoth Short Squeeze
by Tom Bowley,
Chief Market Strategist, EarningsBeats.com
I always love having the added bonus of guaranteed buyers when I see a stock that's broken out. That's what happens when a huge percentage of a company's float is short. In December 2019, I wrote a ChartWatchers article, "Here's A...
READ MORE
MEMBERS ONLY

Week Ahead: Upside in NIFTY May Stay Capped; RRG Chart Says it May Be Time to Reduce Weight on this Sector
by Milan Vaishnav,
Founder and Technical Analyst, EquityResearch.asia and ChartWizard.ae
In the previous weekly note, we mentioned the loss of momentum in the technical pullback that the markets had started to witness. In the week that followed that note, the loss of momentum became more evident. Despite a 500-point oscillation and a trading range, the NIFTY halted its pullback and...
READ MORE
MEMBERS ONLY

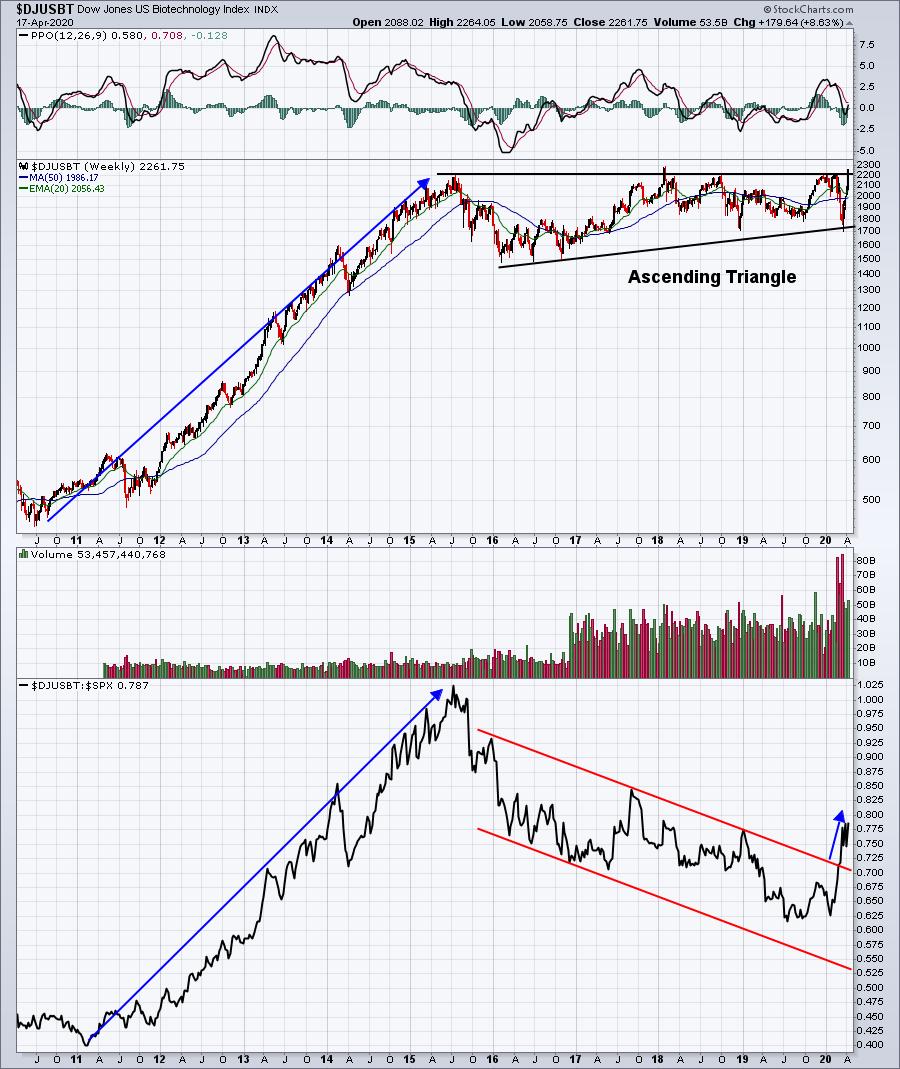
Big Biotechs Make a Big Statement

by Arthur Hill,
Chief Technical Strategist, TrendInvestorPro.com
The two most popular biotech ETFs are leading the market this month and making big statements. Before looking at these two, note that they are quite different. The Biotech ETF (IBB) is dominated by large-cap biotechs with the top ten holdings accounting for over 50%. The Biotech SPDR (XBI), on...
READ MORE
MEMBERS ONLY
The Stock Market's Great Divide: Are You Positioned On The Right Side?

by Mary Ellen McGonagle,
President, MEM Investment Research
The broader markets continue to climb a wall of worry with an impressive bear market rally that's been able to shrug off a barrage of negative news. A close look at this rally reveals a divide in the markets where select areas of outperformance are leaving the rest...
READ MORE
MEMBERS ONLY

Trendline Violations Suggest The Rally Is Losing Momentum

by Martin Pring,
President, Pring Research
Editor's Note: This is an updated version of an article originally posted on Martin Pring's Market Roundup on April 21, 2020.
In recent articles, I have pointed out that quite a few of the short-term indicators reached well beyond their normal oversold readings at the March...
READ MORE
MEMBERS ONLY

The End of the Bullish Bias?
by Mary Ellen McGonagle,
President, MEM Investment Research
In this episode of StockCharts TV'sThe MEM Edge, Mary Ellen reviews the current state of the markets after a tumultuous week. She focuses on high profile stocks that reported earnings.
This video was originally recorded on April 24th, 2020. Click on the above image to watch on our...
READ MORE
MEMBERS ONLY
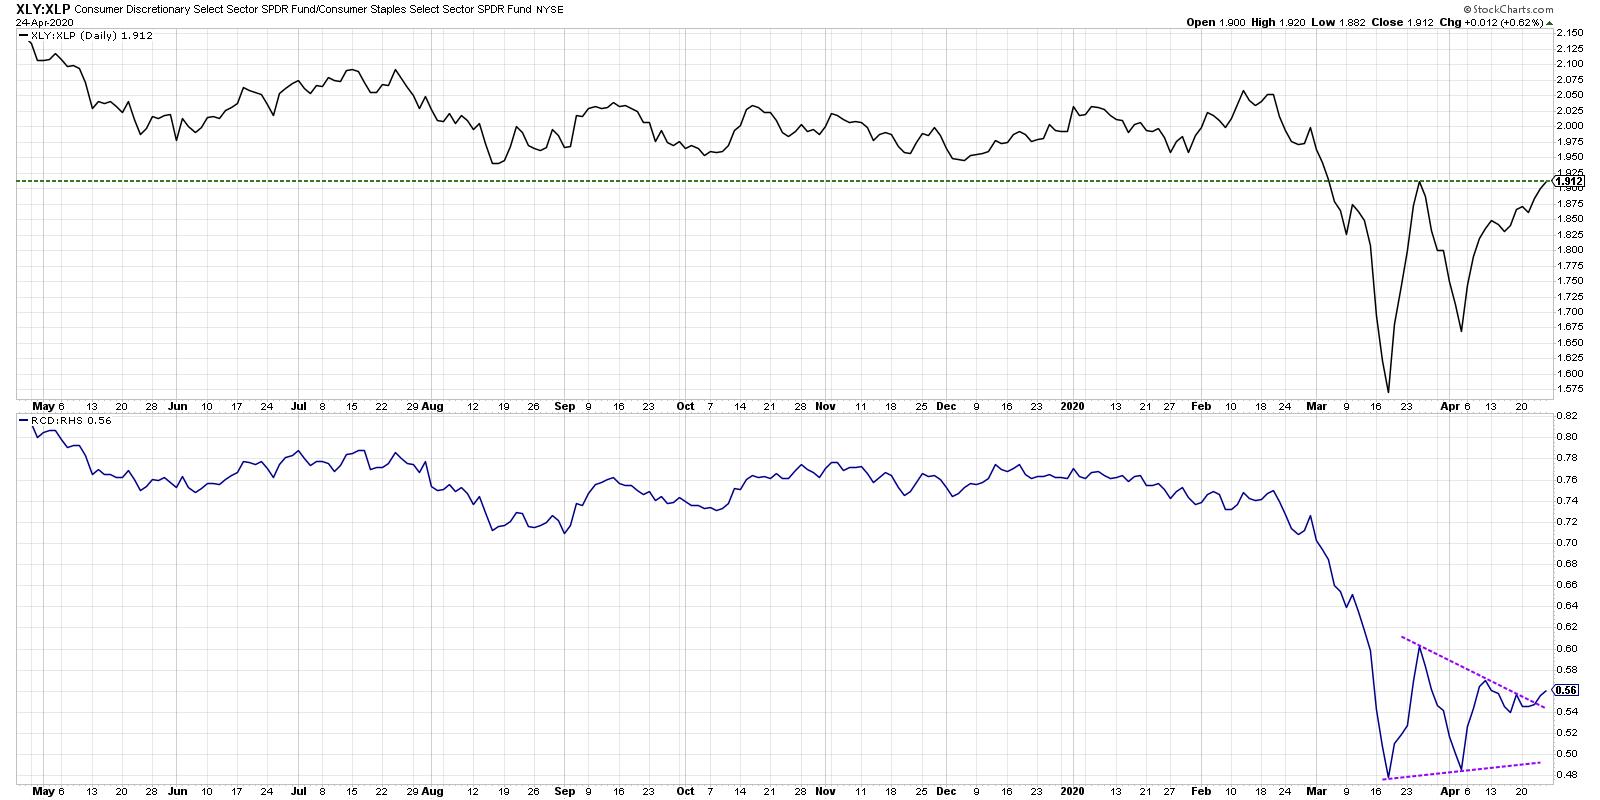
Consumer Sectors Threaten Bullish Breakout

by David Keller,
President and Chief Strategist, Sierra Alpha Research
One of the ways I like to measure offensive vs. defensive pressure in the equity market is using the ratio of Consumer Discretionary to Consumer Staples. Watching this ratio can tell you whether institutions are betting more on the "offense," like retail and travel names, or the traditional...
READ MORE
MEMBERS ONLY
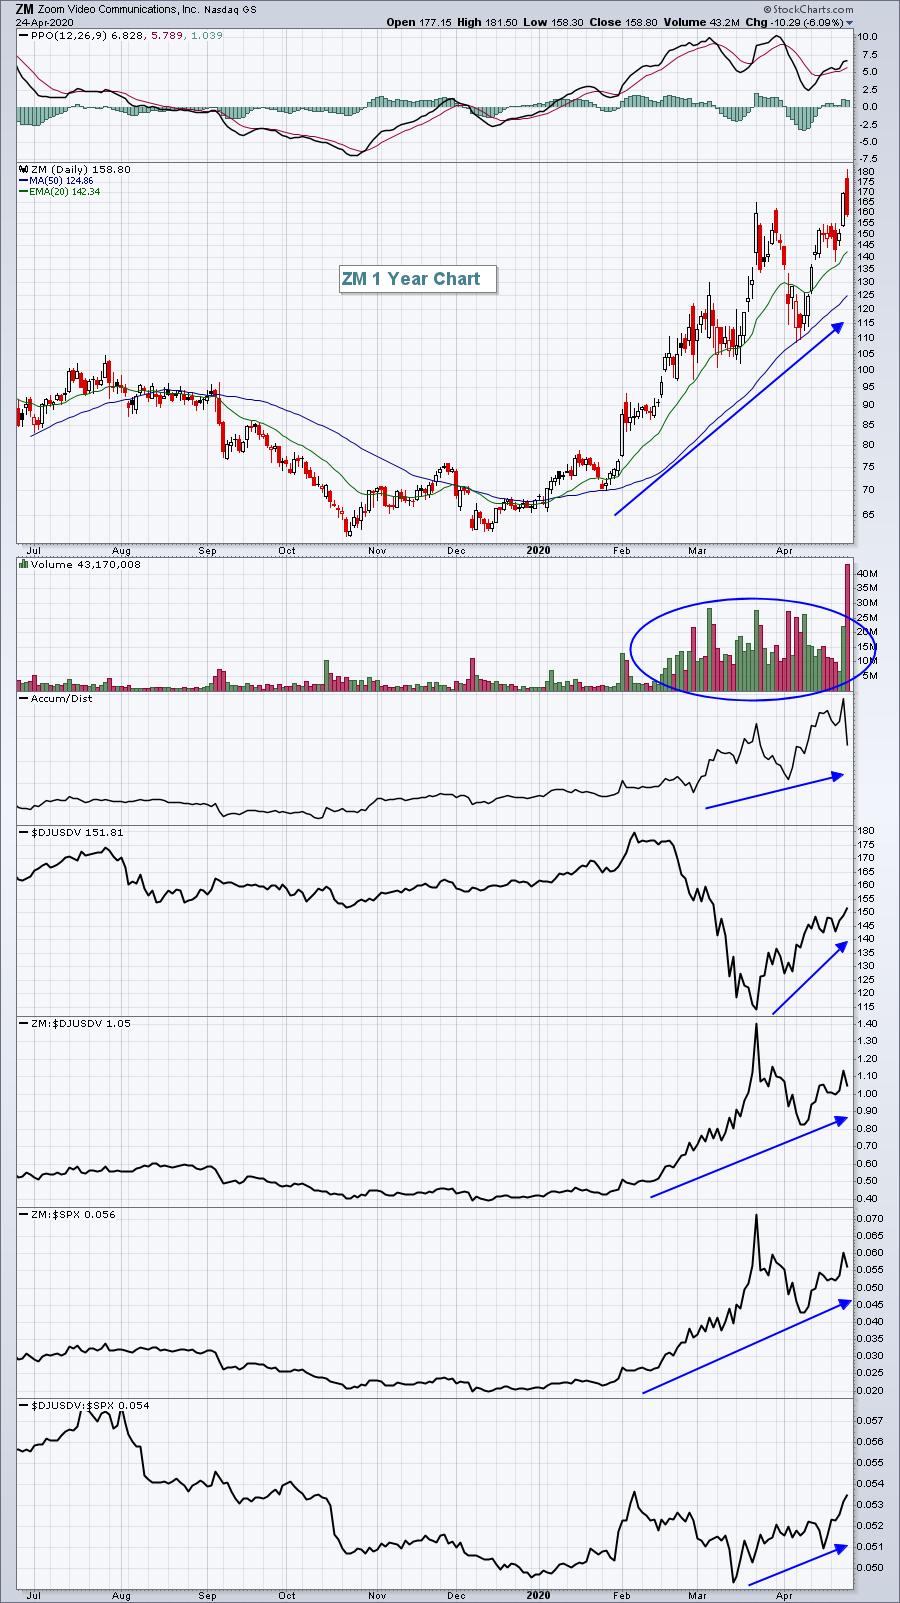
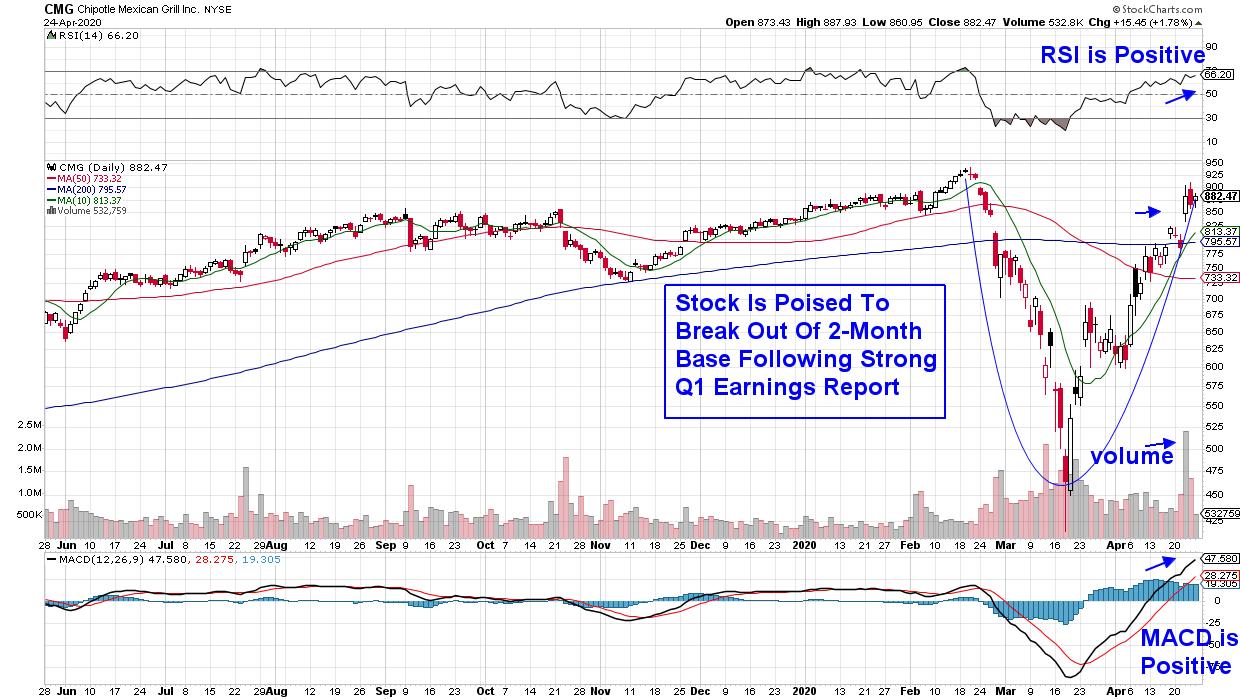
Zooming In On A GREAT Investment....or 5....or 20!
by Tom Bowley,
Chief Market Strategist, EarningsBeats.com
Zoom Video Communications, Inc. (ZM) broke out technically just before the start of the NFL Draft and continued its stealth move higher on Friday - that is, until Facebook (FB) announced that they wanted to join the video meeting party. ZM traded as high as 181.50 intraday on Friday,...
READ MORE
MEMBERS ONLY
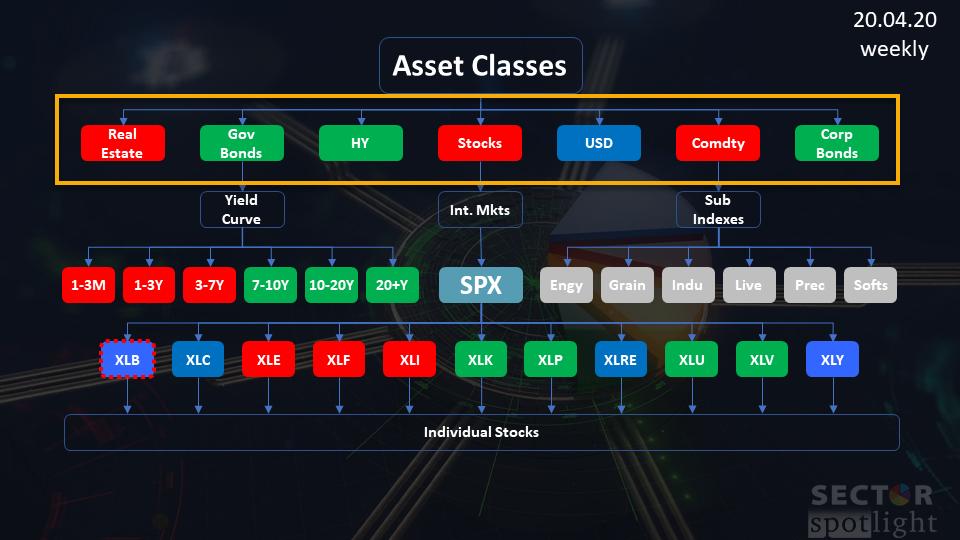
Asset Class Rotation on RRGs Sends Clear RISK-OFF Message
by Julius de Kempenaer,
Senior Technical Analyst, StockCharts.com
In the latest episode of my StockCharts TV series Sector Spotlight, I took an in-depth look at the relative rotation of asset classes vs. VBINX, the Vanguard Balanced Index fund, which represents a 60/40 stocks/bond portfolio. The image above shows the investment pyramid that I use to show...
READ MORE
MEMBERS ONLY
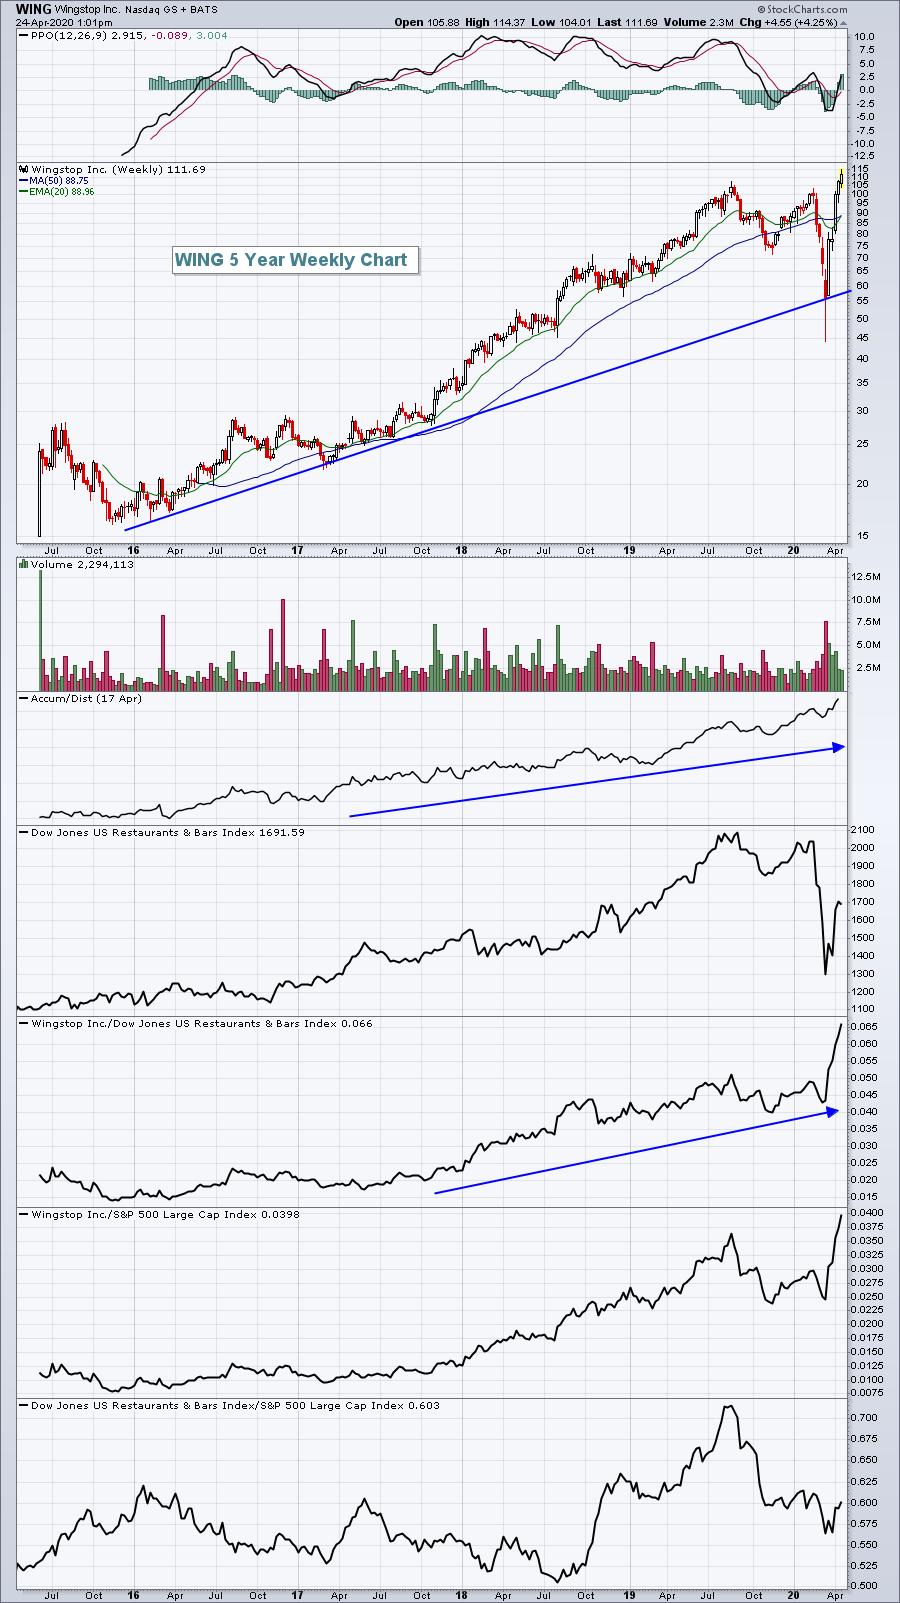
There's Nothing Wrong With WING'n It During The Pandemic
by Tom Bowley,
Chief Market Strategist, EarningsBeats.com
A few weeks ago I joined David Keller, Chief Market Strategist of StockCharts.com and host of SCTV's "The Pitch", to explore opportunities created by the COVID-19 panic. I explained at that time that my analytical background led me to research the massive rotation that took...
READ MORE
MEMBERS ONLY

GOLD MINERS FINALLY BREAK OUT TO THE UPSIDE -- GOLD MINERS ARE STARTING TO DO BETTER THAN GOLD -- AND THE STOCK MARKET
by John Murphy,
Chief Technical Analyst, StockCharts.com
GOLD MINERS ACHIEVE UPSIDE BREAKOUT... The price of gold continues to rise. Chart 1 shows the Gold Shares SPDR (GLD) trading higher and nearing another seven-year high. Gold miners, however, are doing even better. The daily bars in Chart 2 show the VanEck Vectors Gold Miners ETF (GDX) jumping more...
READ MORE
MEMBERS ONLY

DP Show: Polishing a Few Diamonds in the Rough

by Erin Swenlin,
Vice President, DecisionPoint.com
by Carl Swenlin,
President and Founder, DecisionPoint.com
In this episode of DecisionPoint, Carl opens the show with a market overview looking particularly at short- and intermediate-term indicators. Carl and Erin comment on the bullish bias that seems to be prevalent in this rally off bear market lows. Erin looks at the Gold Miners' big breakout and...
READ MORE
MEMBERS ONLY
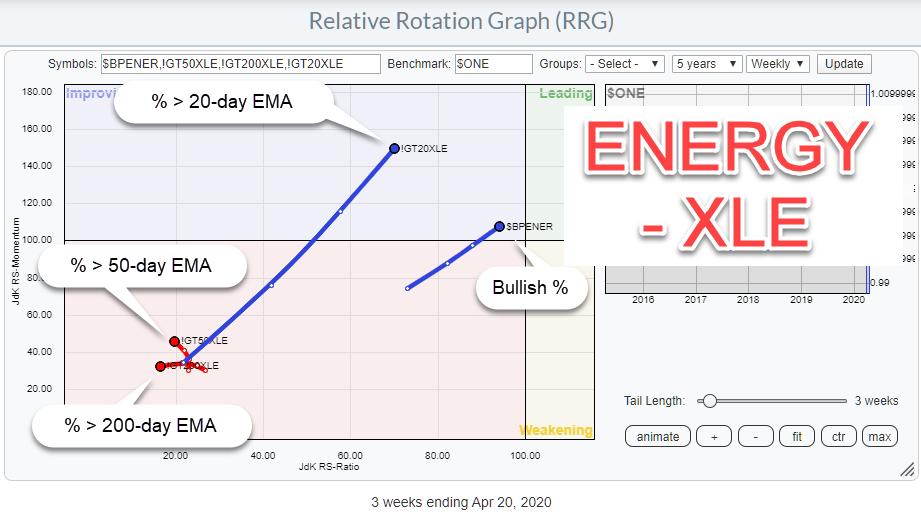
Is the Energy Sector Preparing for a Turnaround?
by Julius de Kempenaer,
Senior Technical Analyst, StockCharts.com
Recently I have been picking up some work that I had done in the past with regard to plotting (sector) breadth data on Relative Rotation Graphs.
You can review the segment in this episode of Sector Spotlight and read more about possibilities with breadth on RRGs in this article "...
READ MORE
MEMBERS ONLY

Following Up With Breadth Data On a Relative Rotation Graph
by Julius de Kempenaer,
Senior Technical Analyst, StockCharts.com
In the 4/14/20 episode of my show Sector Spotlight, which airs every Tuesday at 10:30am ET on StockCharts TV, I talked about plotting breadth data on a Relative Rotation Graph.
The link below starts at that segment.
In this article, I will add another option to take...
READ MORE
MEMBERS ONLY

Random Thoughts: The Man on the Street as a Microcosm
by Dave Landry,
Founder, Sentive Trading, LLC
Editor's Note: This article was originally published on Monday, April 20th at DaveLandry.com.
Markets trade on emotions, period. I read those emotions through the charts. To help wrap my head around things, I also like to listen to the "man on the street." I have...
READ MORE
MEMBERS ONLY

12+1 Trading Rules - Part 2
by Dave Landry,
Founder, Sentive Trading, LLC
In this edition of Trading Simplified, Dave gives a rundown of current market conditions, then continues his discussion of the 12+1 trading rules he follows and the trading psychology behind them.
This video was originally broadcast on April 22nd, 2020. Click anywhere on the Trading Simplified logo above to...
READ MORE
MEMBERS ONLY

The Relationship Between Two Most Important Indian Indices Has Changed
by Milan Vaishnav,
Founder and Technical Analyst, EquityResearch.asia and ChartWizard.ae
The front line index NIFTY50 ($NIFTY) and the Nifty Bank Index ($BANKNIFTY) have always shared a steady one-sided relationship since the inception the two indices.
The above chart shows the NIFTY and BankNifty's co-performance since inception. Right from the introduction of these two indices in the year 2000,...
READ MORE
MEMBERS ONLY

Bear Market Update: Connect the Dots or Follow the Charts?
by Dave Landry,
Founder, Sentive Trading, LLC
My father used to tell me that "a little inflation is a good thing." I never fully understood this, but I'm guessing I'll soon find out why.
The May contract for oil went negative, way negative - closing at -$37.63. This means...
READ MORE
MEMBERS ONLY

Trendline Violations Suggest The Rally Is Losing Momentum
by Martin Pring,
President, Pring Research
In recent articles, I have pointed out that quite a few of the short-term indicators reached well beyond their normal oversold readings at the March lows. Historically, this is has been a very bullish characteristic, often signaling the end of a bear market. The difference between now and most of...
READ MORE
MEMBERS ONLY

The Economic Modern Family Tells a Story
Before I comment on the charts, a note about the US Oil Fund ETF (USO).
News is news, and clearly, it's not been good. But charts are better. With two huge volume days in a row and prices that tanked, a blowoff bottom is not an impossibility. In...
READ MORE
MEMBERS ONLY

Three Sector Charts Turn Bearish
by David Keller,
President and Chief Strategist, Sierra Alpha Research
Every Monday on StockCharts TV's The Final Bar, we look at the markets from three perspectives: top-down macro, sector rotation and bottom-up stock selection. In this week's review, we identified three sector charts that are potentially turning bearish and suggest broader weakness in the equity space....
READ MORE
MEMBERS ONLY

Five S&P 500 Sectors Have Rising Wedge Breakdowns
by Carl Swenlin,
President and Founder, DecisionPoint.com
The S&P 500 component stocks are divided into eleven sectors, and five of them have rising wedges that have broken down. A rising wedge is a bearish formation, and, even in a bull market, it will resolve downward more often than not. In a bear market the odds...
READ MORE
MEMBERS ONLY

Sector Spotlight: RRG Signals Risk OFF, Pointing to Lower Yields
by Julius de Kempenaer,
Senior Technical Analyst, StockCharts.com
On this episode of Sector Spotlight, I perform an in-depth overview of asset class rotations, finding that RRG still suggests a cautious approach for stocks; meanwhile, (long) bonds are on the verge of breaking higher, sending yields to even lower levels.
This video was originally broadcast on April 21st, 2020....
READ MORE
MEMBERS ONLY

STOCKS SELL OFF AS OIL PRICE PLUNGES -- DOW AND S&P 500 PULL BACK FROM 50-DAY AVERAGES -- THE NASDAQ FALLS BELOW ITS 200-DAY LINE ON TECHNOLOGY SELLING
by John Murphy,
Chief Technical Analyst, StockCharts.com
MAJOR STOCK INDEXES ARE UNDER HEAVY SELLING PRESSURE...The plunge in the price of the May crude oil contract below zero this week, and the continuing plunge in oil prices in general, is taking a toll on stock market sentiment and trading. All three major stock indexes are under heavy...
READ MORE
MEMBERS ONLY

Did Oil Just Give Us a Once-in-a-Lifetime Opportunity?
Last Friday, I made a video for my show on StockCharts TV (watch here) that began with a comparison of oil in the early-to-late 1970's period against what we're seeing now.
With oil crashing to pre-WWII levels, the analogy is that super cheap oil has preceded...
READ MORE
MEMBERS ONLY
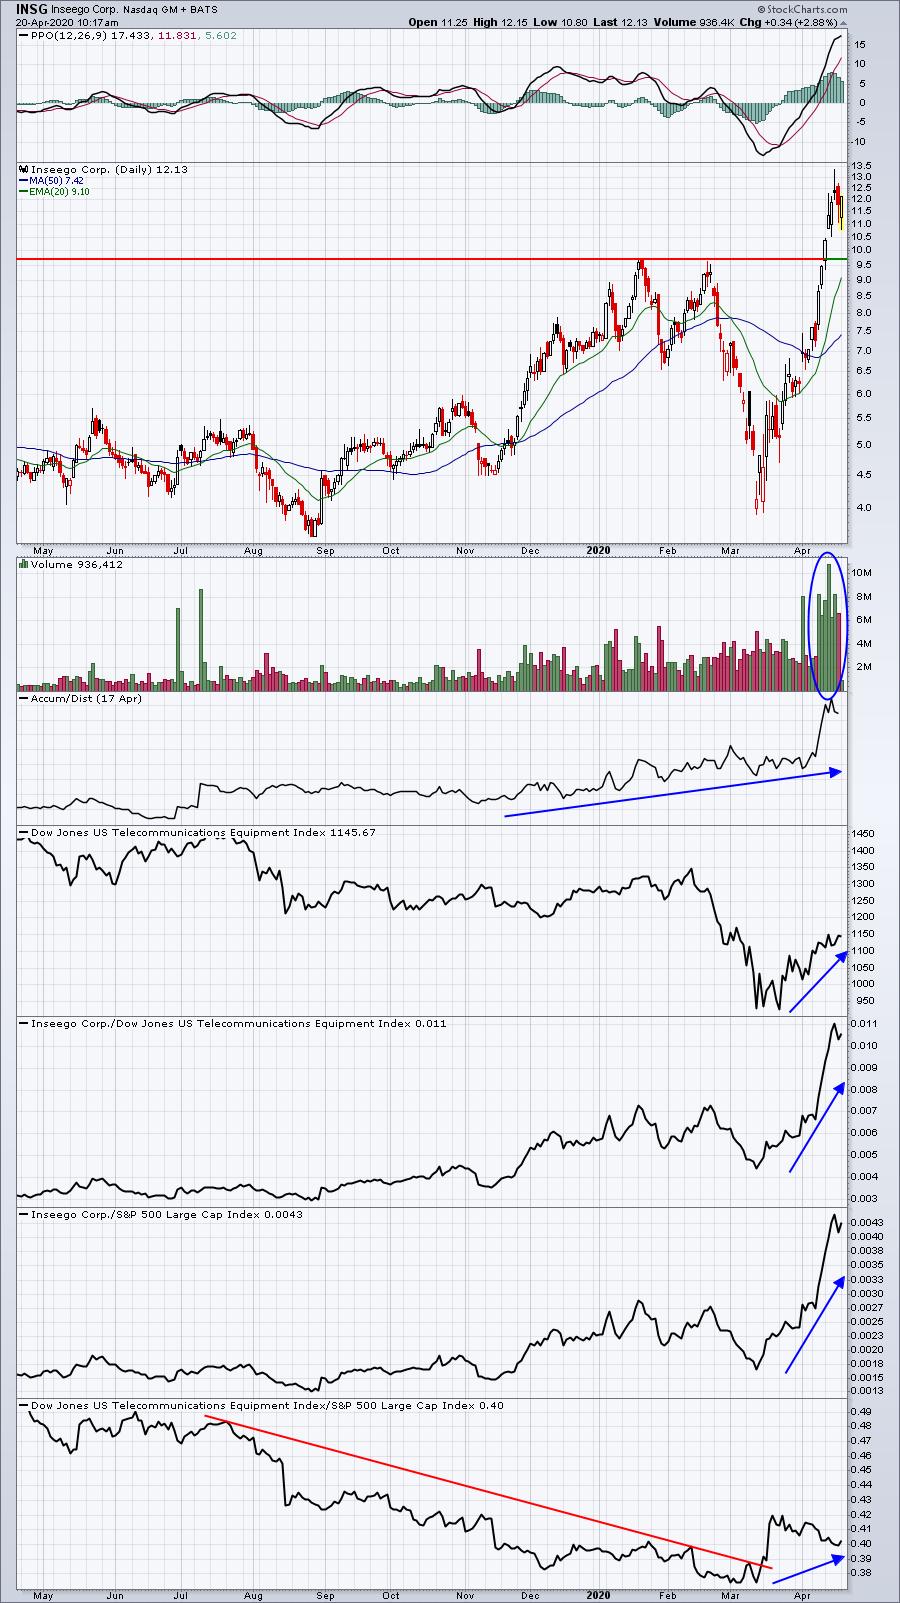
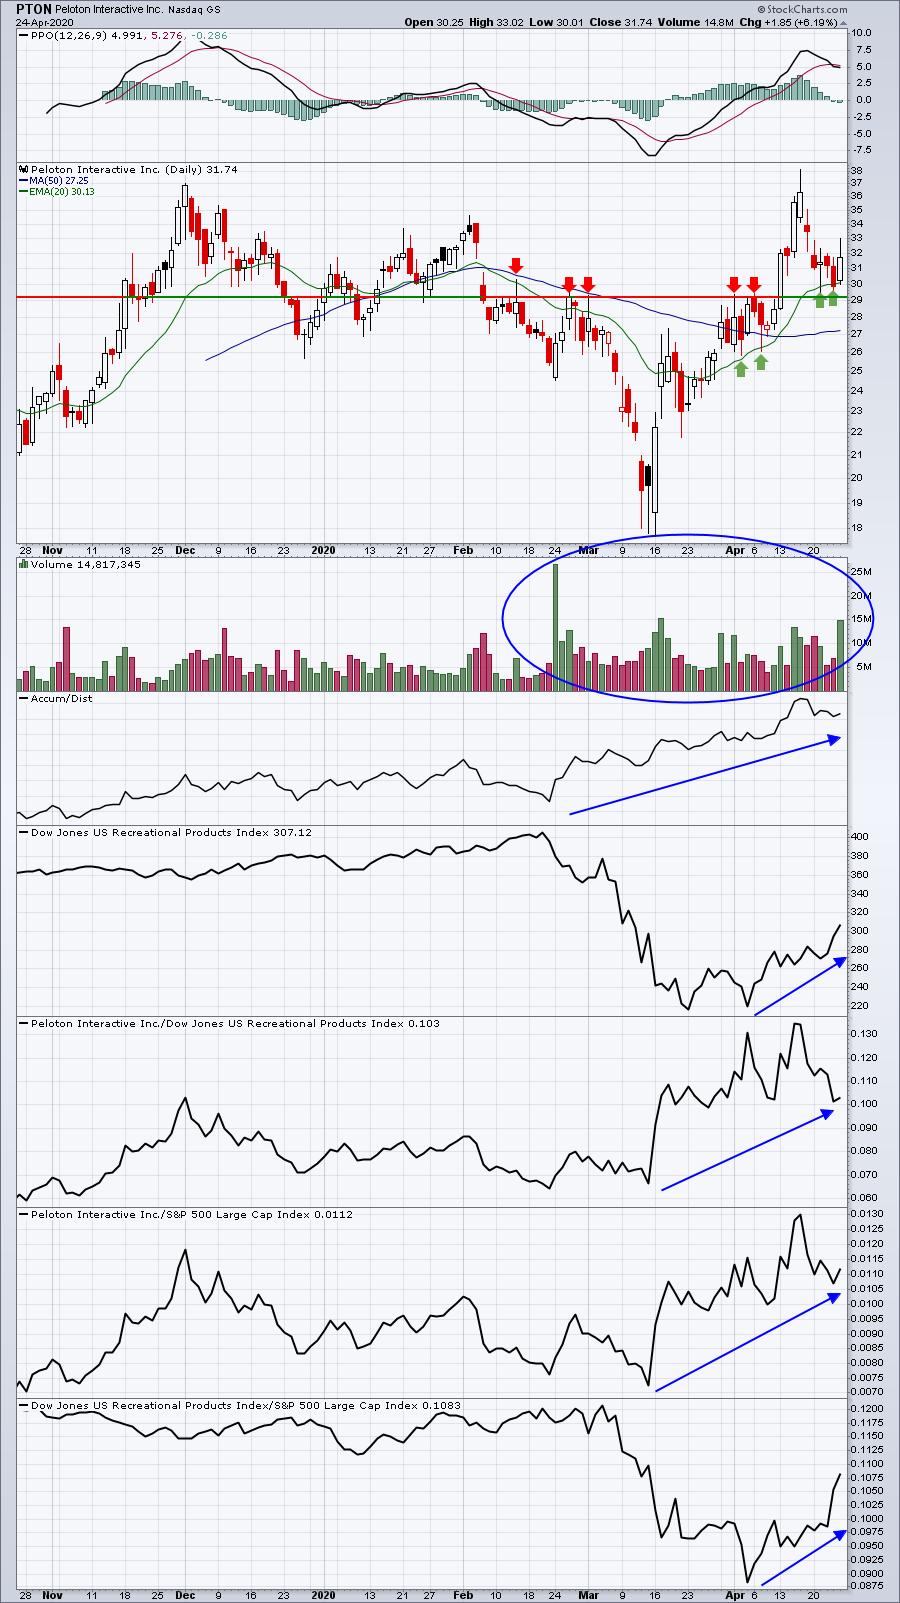
Here's A Potential New Leader In 5G And Cloud Technology That You May Not Have Heard Of
by Tom Bowley,
Chief Market Strategist, EarningsBeats.com
In the land of trillion dollar companies, it may seem difficult to find new and exciting young companies to invest in. But if you do some research, you can find them. When I was running scans and doing homework a couple weeks to uncover stocks for my Strong AD ChartList...
READ MORE
MEMBERS ONLY

Opportunity To Collect Premiums By Writing Options In This Stock
by Milan Vaishnav,
Founder and Technical Analyst, EquityResearch.asia and ChartWizard.ae
Titan Industries Limited - TITAN.IN
The chart above shows highest Put OI in Titan at 900 and maximum Call OI at 1100 for the April 30 expiry. To interpret this data, that means that it is highly unlikely that the stock will find strong support at 900 and strong...
READ MORE
MEMBERS ONLY
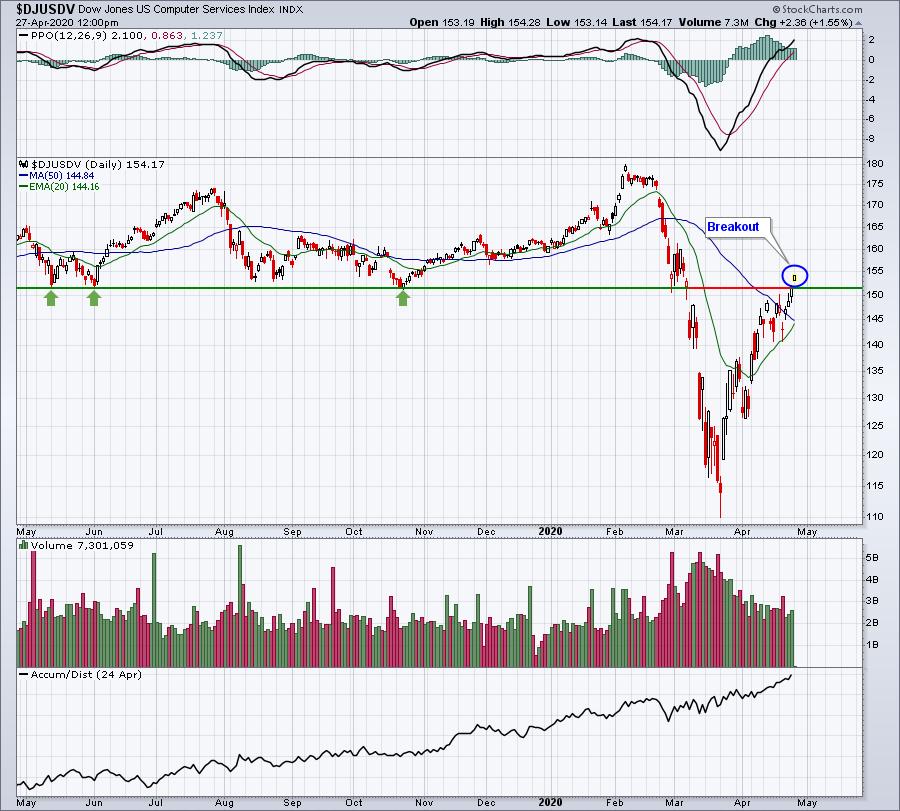
This Industry Just Keeps On Strengthening
by Tom Bowley,
Chief Market Strategist, EarningsBeats.com
COVID-19 has lit a fire under one industry group that already was showing relative strength. Now its relative strength is off the charts and showing no signs of slowing. In fact, it closed at its highest level in more than two years and is within a whisker of a MASSIVE...
READ MORE
