MEMBERS ONLY

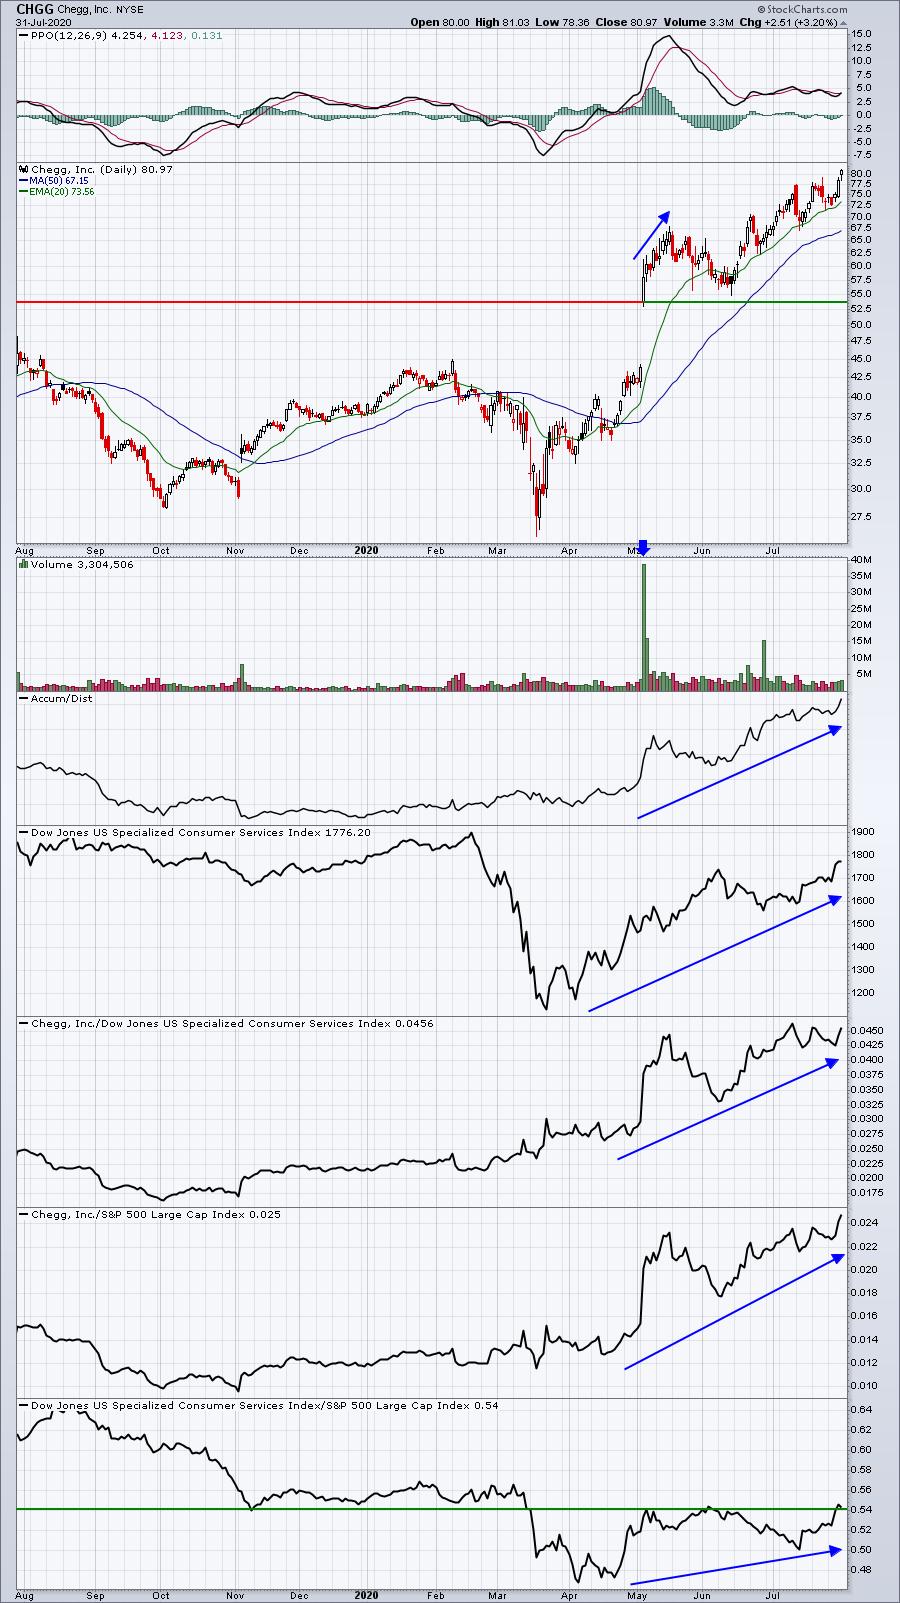
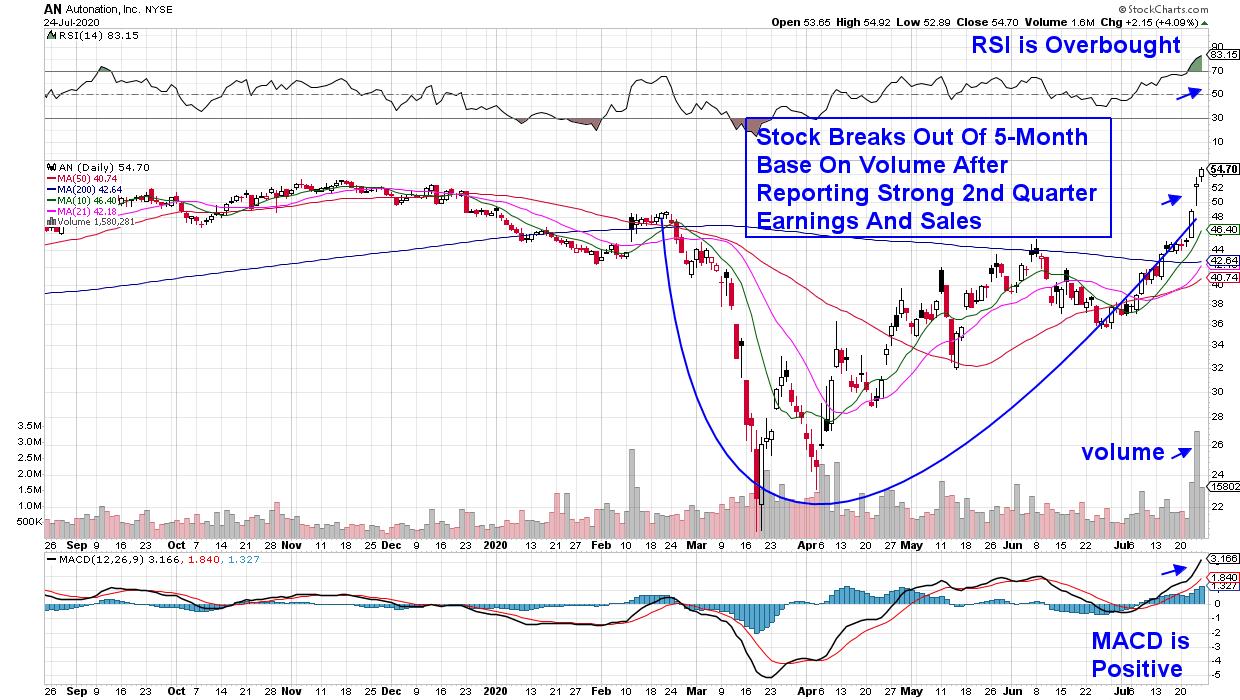
Here's Another Stock Setting Up Exactly Like AMD Did, Just Before Its 70% Rise In 5 Weeks

by Tom Bowley,
Chief Market Strategist, EarningsBeats.com
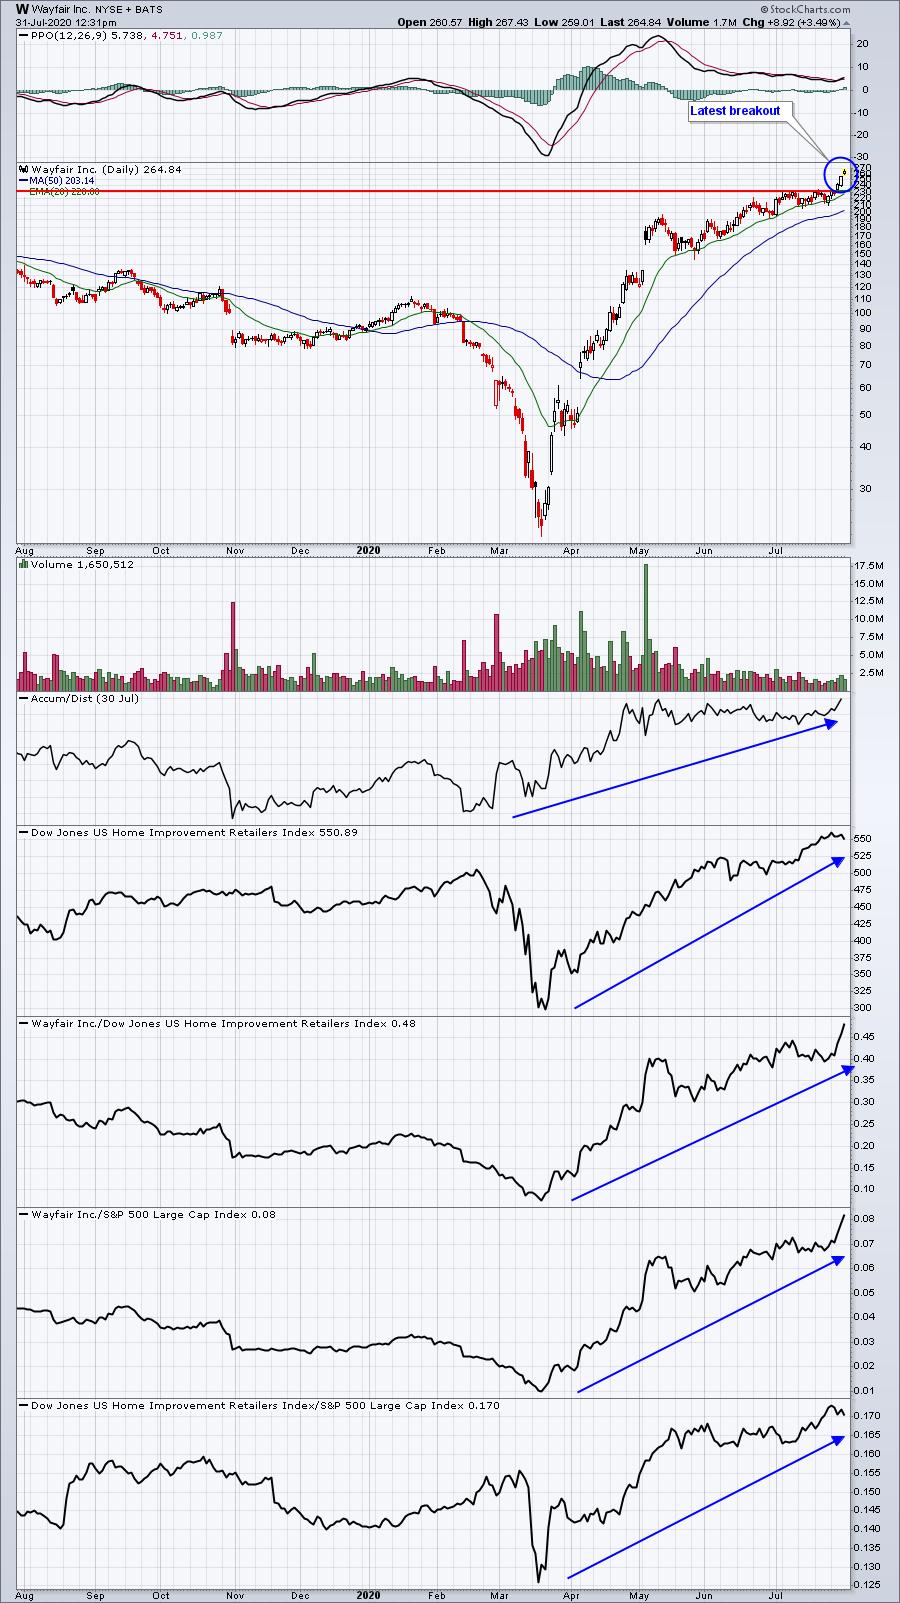
I'm a big fan of buying stocks at support. On June 29th, Advanced Micro Devices (AMD) tested a very important price support level and printed a reversing hammer candlestick that same day. In my Daily Market Report to EarningsBeats.com members, I suggested mid-day that a bottom...
READ MORE
MEMBERS ONLY

Sector Spotlight: Bonds are Looking Good

by Julius de Kempenaer,
Senior Technical Analyst, StockCharts.com
As is usual for the first episode of Sector Spotlight of a new month, I take an in-depth look at developments on the monthly charts for Asset Classes and Sectors. There's also a short intermezzo on Flag patterns and a book suggestion!
This video was originally broadcast...
READ MORE
MEMBERS ONLY
Multiple Time Frames and Overextended Amazon

by David Keller,
President and Chief Strategist, Sierra Alpha Research
Last week on The Final Bar, one of our Mailbag questions related to Amazon.com (AMZN) and how far it has reached above its 200-day moving average. This phenomenon speaks to the long-term strength of AMZN's price movements, the short-term overreaching of the price since...
READ MORE
MEMBERS ONLY
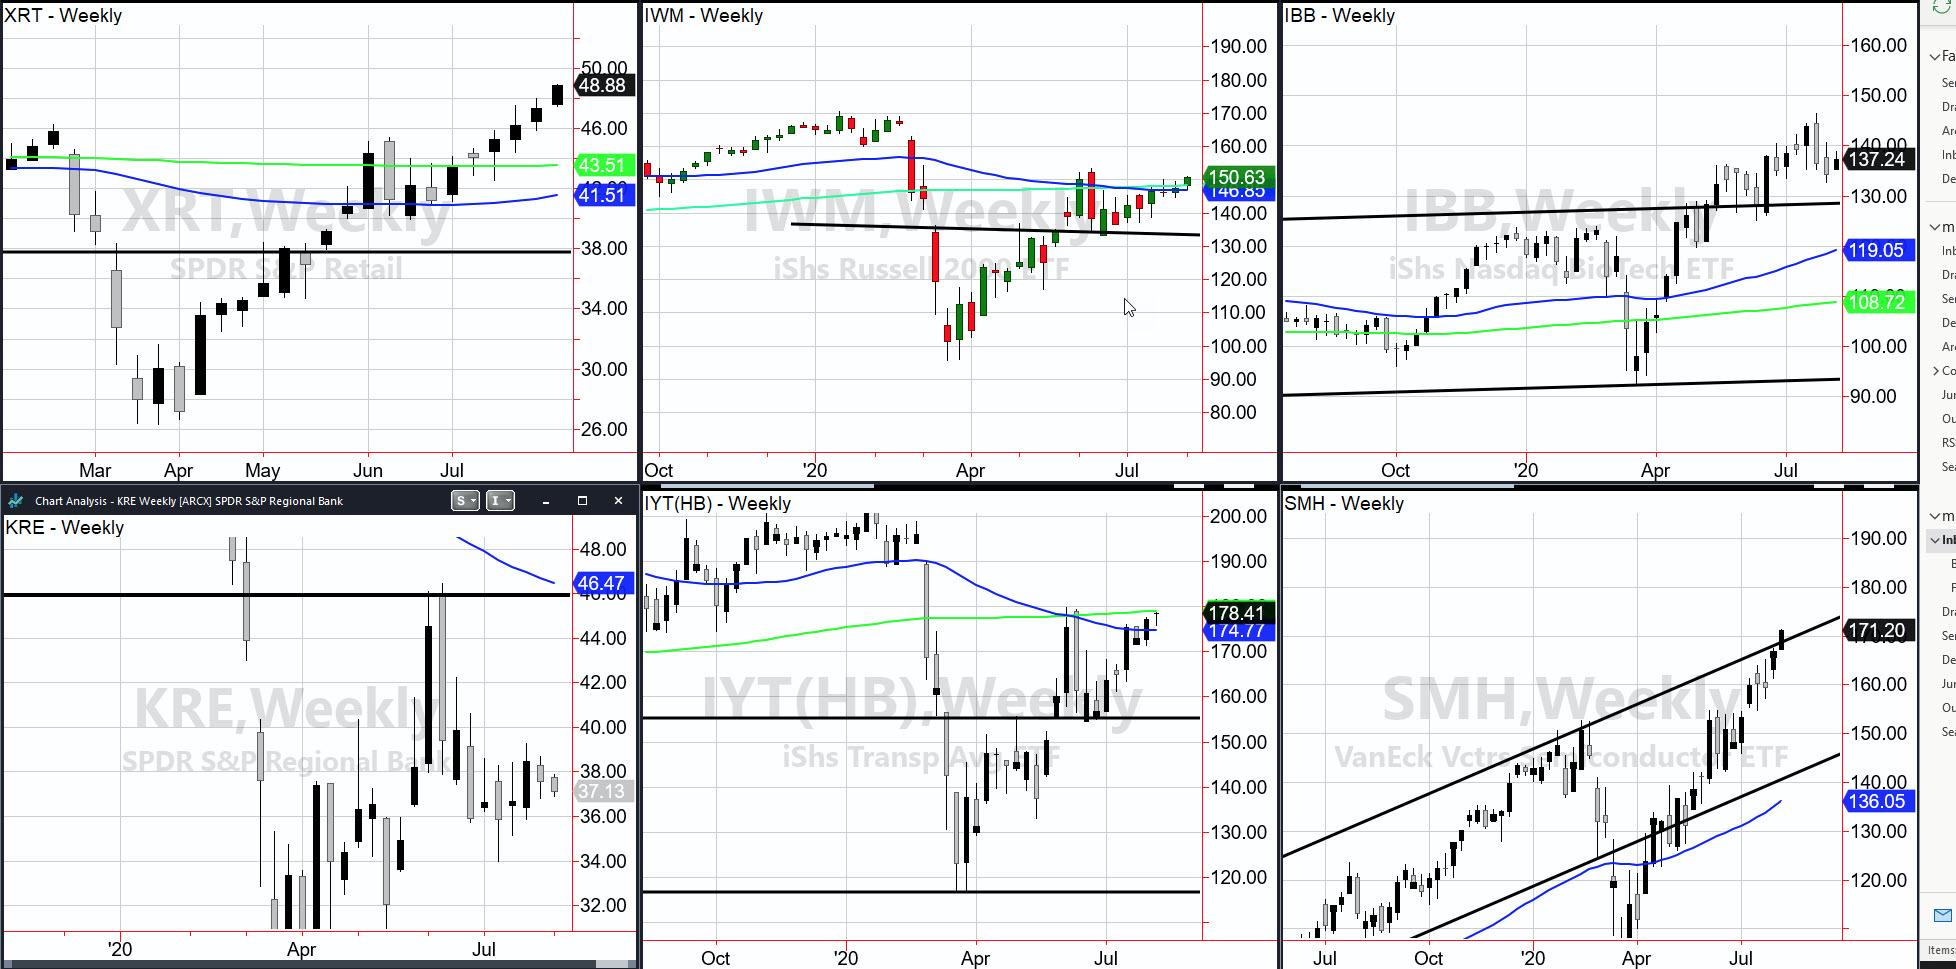
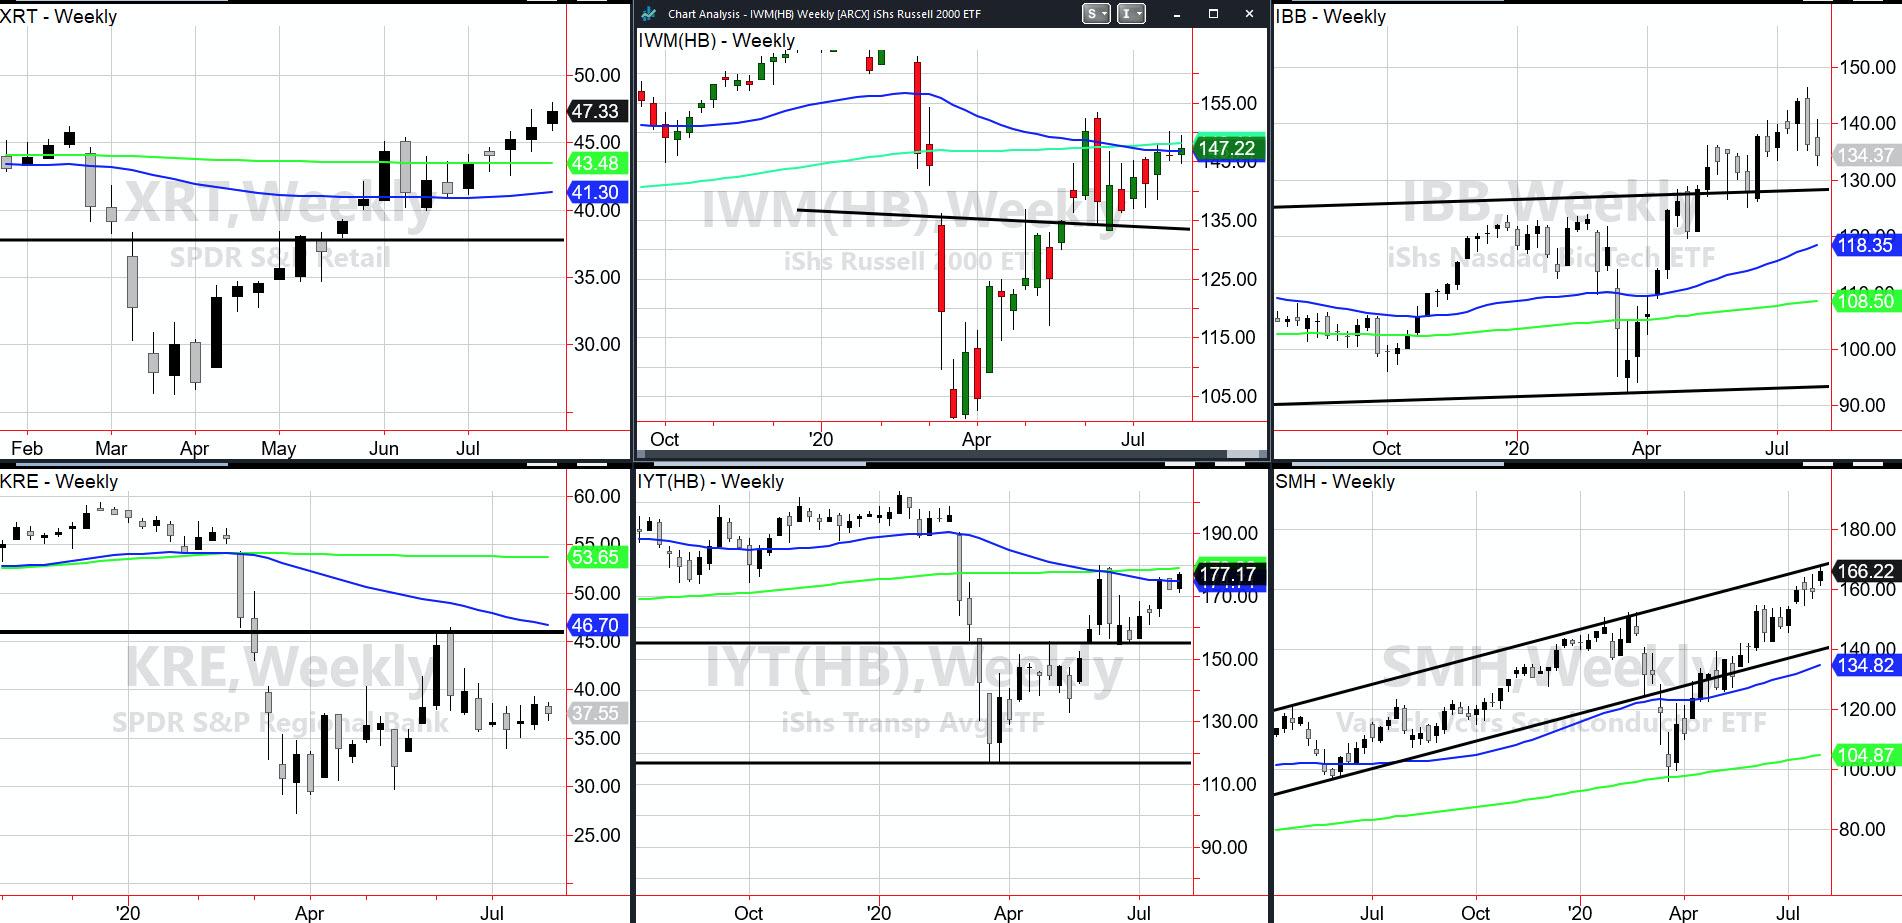
Prodigal Son Regional Banks - A Ball and Chain
With the Russell 2000 breaking out over the 50- and 200-week moving averages, we should see nothing but blue skies, right? Maybe.
We have lots of positives based on hope, of course. Retail (XRT), as featured a while back, is doing well. Sister Semiconductors (SMH) is on the road...
READ MORE
MEMBERS ONLY

Watching Rotations into Real Estate and Technology (again)...
by Julius de Kempenaer,
Senior Technical Analyst, StockCharts.com
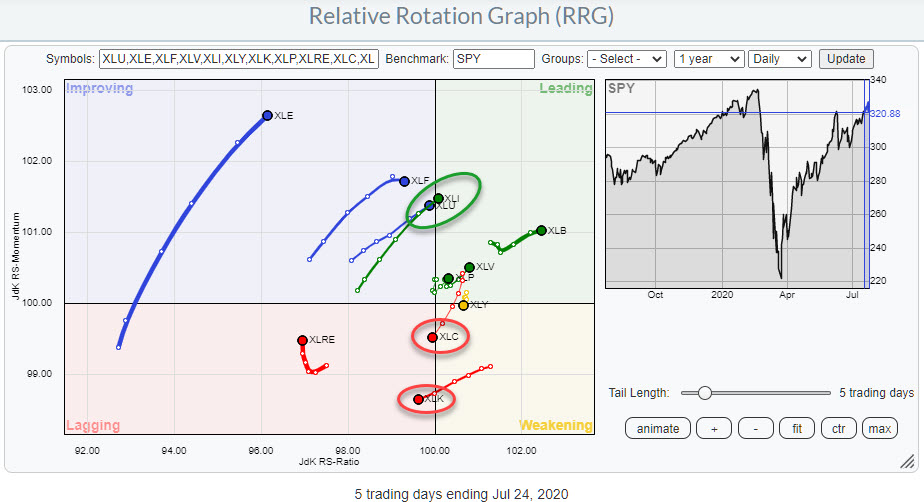
At the start of the week, two tails on the Relative Rotation Graph for US sectors are showing interesting rotations. These are the tails for for XLRE and XLK.
Real Estate
The positive rotation for the daily tail on the RRG coincides nicely with the improvement for XLRE on a...
READ MORE
MEMBERS ONLY
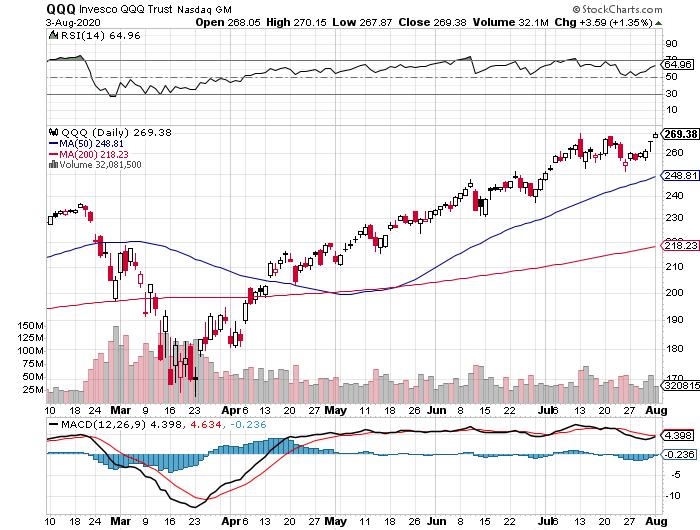
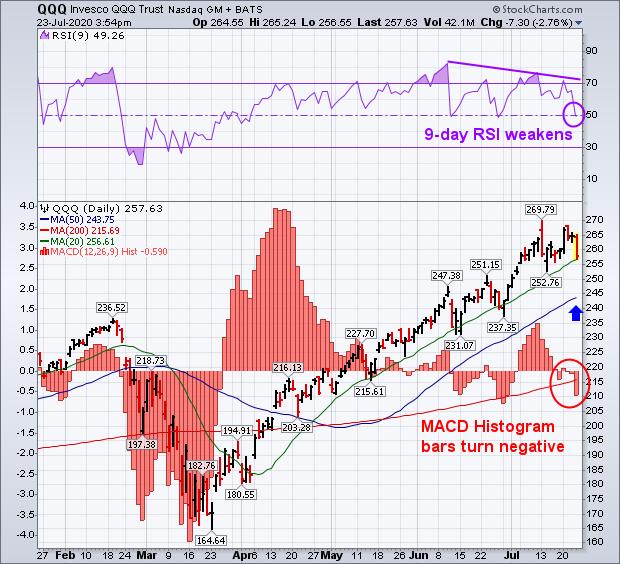
Is NASDAQ Tiring?
A few cautious flags were thrown up today in spite of the new all-time highs in NASDAQ.
1. The volume was light. After Friday's spike in volume, Monday QQQssaw below-average daily volume.
2. The momentum indicators that we use to measure tops, bottoms, and big trends...
READ MORE
MEMBERS ONLY

NASDAQ HITS ANOTHER RECORD -- MICROSOFT AND SEMIS LEAD TECH SECTOR -- JACOBS ENGINEERING AND QUANTA LEAD XLI

by John Murphy,
Chief Technical Analyst, StockCharts.com
TECHS AND NASDAQ CONTINUE TO LEAD THE WAY... Big techology stocks are leading the market higher today again. Chart 1 show the Nasdaq Composite Index reaching a new high as did the Technology SPDR (XLK). Its biggest percentage gainers were Microsoft and a number of chip stocks. Chart 2 shows...
READ MORE
MEMBERS ONLY
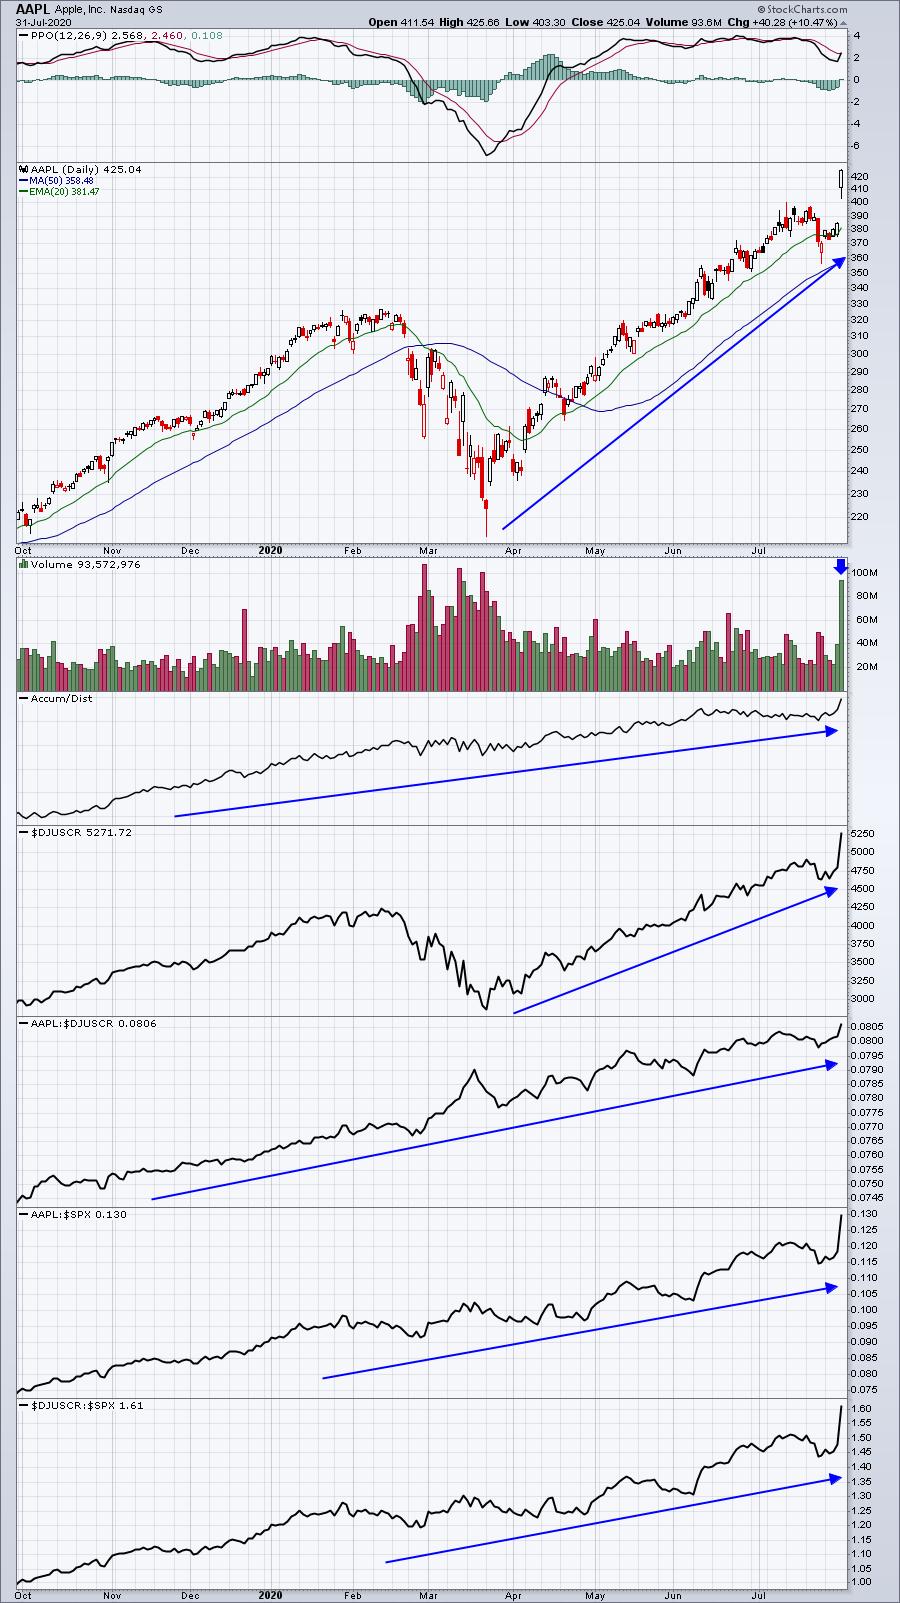
A Summer Road Trip with the Economic Modern Family
Last week, Max Wiethe from Real Vision and I sat down for about an hour to discuss a myriad of timely and relevant market topics. (See the link at the end of the commentary).
So much happened in this past week. The short list:
* Blow-out Earnings of Apple (AAPL)...
READ MORE
MEMBERS ONLY
Building Our 6 Pillars (ChartLists) Of Trading
by Tom Bowley,
Chief Market Strategist, EarningsBeats.com
First, welcome to August! It's hard to believe that we're into our 8th month of 2020. It's been a very difficult year on a number of fronts, but I hope that EarningsBeats.com has at least been able to help you navigate through the...
READ MORE
MEMBERS ONLY

APPLE, AMAZON, AND FACEBOOK HAVE BIG DAY FOLLOWING STRONG EARNINGS -- MAJOR STOCK INDEXES MAINTAIN UPTRENDS -- EXPD AND UPS DELIVER NEW RECORDS -- DOW TRANSPORTS CONTINUE TO GAIN GROUND
by John Murphy,
Chief Technical Analyst, StockCharts.com
THREE BIG TECHS LEAD FRIDAY REBOUND... Going into Thursday evening, most of the TV stock market commentary centered around the big tech stocks that were announcing quarterly earnings after the close. The consensus seemed to be that the big tech stocks had already seen huge gains for the year, and...
READ MORE
MEMBERS ONLY
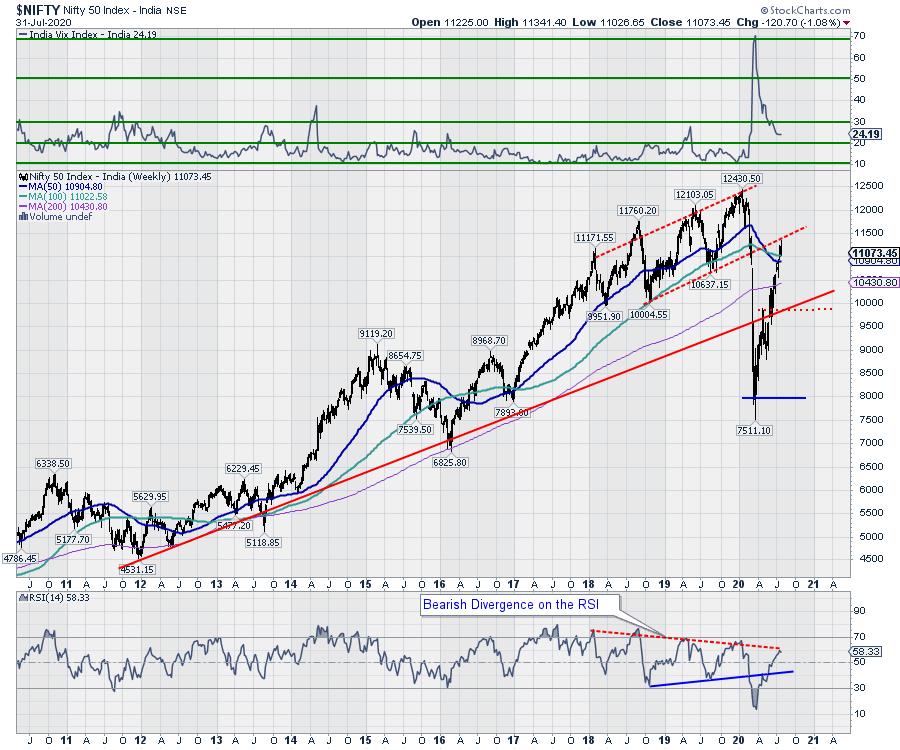
Week Ahead: NIFTY Makes Some Room for Consolidation at Higher Levels; Expect RRG Leadership From These Sectors

by Milan Vaishnav,
Founder and Technical Analyst, EquityResearch.asia and ChartWizard.ae
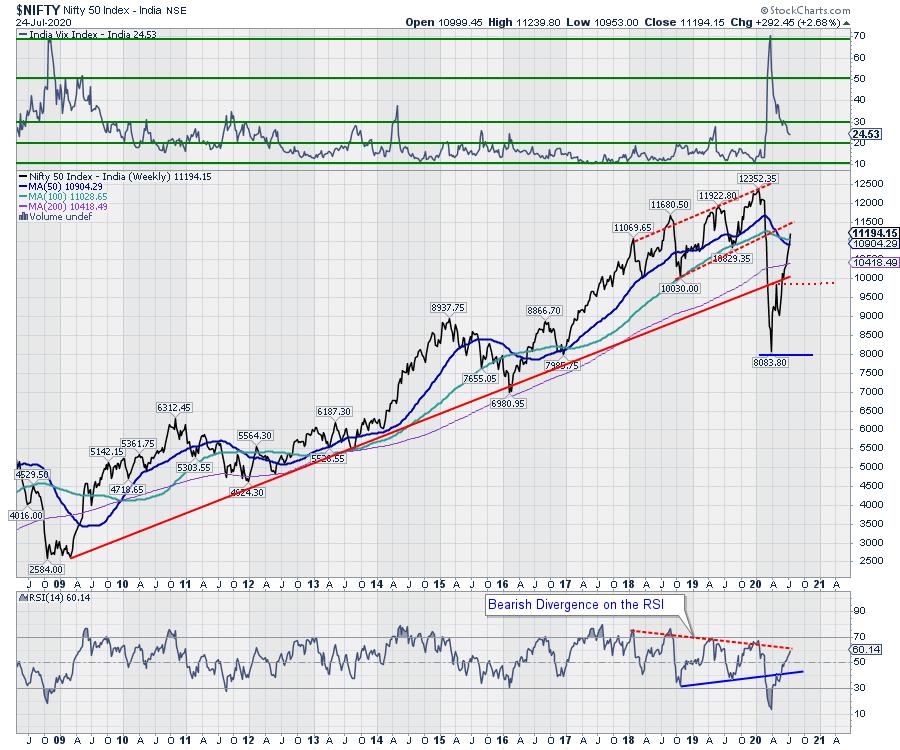
After testing a couple of important levels in the week before this one, the NIFTY took a breather and consolidated over the past five sessions. In the previous weekly note, we had highlighted that the momentum at higher levels is diminishing, which might lead to some consolidation at higher levels....
READ MORE
MEMBERS ONLY
FAANG Stocks Exploding Higher? – Here's The Real Story This Earnings Season

by Mary Ellen McGonagle,
President, MEM Investment Research
It's been quite a week for the markets and while market news is likely to focus on the explosive gains in select FAANG stocks, I believe there's an even bigger story that's come to light during this surprisingly robust earnings season.
You see, Facebook...
READ MORE
MEMBERS ONLY

Copper Could Hold the Key for the Next Leg Up in the Stock Market Rally

by Martin Pring,
President, Pring Research
Swings in commodity prices are both a market and an economic indicator. There are certainly exceptions, but when the economy is in a recovery phase, commodity prices generally rise. During the early phase of the business cycle, rising commodities are beneficial for stocks, not only for commodity-sensitive sectors such...
READ MORE
MEMBERS ONLY
Our Model Portfolio Is +118% In 21 Months; Here Are The 10 Equal-Weighted Stocks That Comprise It
by Tom Bowley,
Chief Market Strategist, EarningsBeats.com
Every three months, we fill out our four portfolios with 10 equal-weighted and leading stocks, mostly in leading industries. We combine fundamental research and technical analysis to make our money work harder, which is the whole idea. We know there's a strong correlation between earnings growth rates...
READ MORE
MEMBERS ONLY
Too Far, Too Fast for Amazon
by David Keller,
President and Chief Strategist, Sierra Alpha Research
This week on The Final Bar, one of our Mailbag questions related to Amazon.com (AMZN) and how far it has reached above its 200-day moving average. This phenomenon speaks to the long-term strength of AMZN's price movements, the short-term overreaching of the price since...
READ MORE
MEMBERS ONLY

Pivotal Week Unveils Amazing Opportunities
by Mary Ellen McGonagle,
President, MEM Investment Research
In this episode of StockCharts TV'sThe MEM Edge, Mary Ellen examines how corporate earnings results are uncovering a resurgence in an area due to see explosive growth over the next year and beyond. She also shares tips on how to uncover the next set of winners from one...
READ MORE
MEMBERS ONLY

Will The Next Big Move Be in Bonds?
by Julius de Kempenaer,
Senior Technical Analyst, StockCharts.com
(Financial) Markets rotate, that's a given. When we look at the stock market, we call it sector rotation, which is probably the most widely-used term. But there is definitely also rotational action going on in other markets or cross assets. Think in terms of country or regional...
READ MORE
MEMBERS ONLY

Stocks in China to Get Body-Slammed

by Larry Williams,
Veteran Investor and Author
On this special episode of Real Trading with Larry Williams, Larry goes out on a limb to explain why he thinks stocks in China are ready for significant decline. You'll get a sneak peek of his unique indicators coming soon to StockChartsACP, as Larry demonstrates their functions and...
READ MORE
MEMBERS ONLY
A Solid Way To Find Great Short Squeeze Candidates
by Tom Bowley,
Chief Market Strategist, EarningsBeats.com
Too many traders focus on the wrong things when looking for a big short squeeze. It's not about how many short shares there are for a particular stock. And it's not about high short percentage of float. And, quite honestly, it's not even about...
READ MORE
MEMBERS ONLY
Copper Could Hold the Key for the Next Leg Up in the Stock Market Rally
by Martin Pring,
President, Pring Research
* Rising Commodity Momentum is Bullish for Stocks and the Economy
* Long-Term Technicals Look Promising for Copper
Swings in commodity prices are both a market and an economic indicator. There are certainly exceptions, but when the economy is in a recovery phase, commodity prices generally rise. During the early phase...
READ MORE
MEMBERS ONLY

Real Estate Emerging Out of Doldrums
by Julius de Kempenaer,
Senior Technical Analyst, StockCharts.com
Ok, the header image may not be entirely accurate to the message of this article, as it deals with the Real Estate sector which is all about listed REITs, but I could not resist using it ;)
When I looked at the Relative Rotation Graphs for sectors this morning, I noticed...
READ MORE
MEMBERS ONLY

DP Show: Gold Rush - Worry or Rejoice?

by Erin Swenlin,
Vice President, DecisionPoint.com

by Carl Swenlin,
President and Founder, DecisionPoint.com
In this episode of DecisionPoint, Carl discusses his recent article on Gold. The yellow metal is enjoying a huge rally, but should we be excited or nervous? Carl and Erin both give you their strategies on taking advantage of (and protecting profits during) this parabolic move. Erin outlines some short-...
READ MORE
MEMBERS ONLY

Best, Worst and Missed Trades

by Dave Landry,
Founder, Sentive Trading, LLC
In this edition of Trading Simplified, Dave presents a broad selection of charts that he uses to present his methodology in action. Most of the charts are actual stocks that Dave trades or has traded himself, and have also been "Mystery Charts" in past shows. Dave also demonstrates...
READ MORE
MEMBERS ONLY
Who Says Gold is Topping?
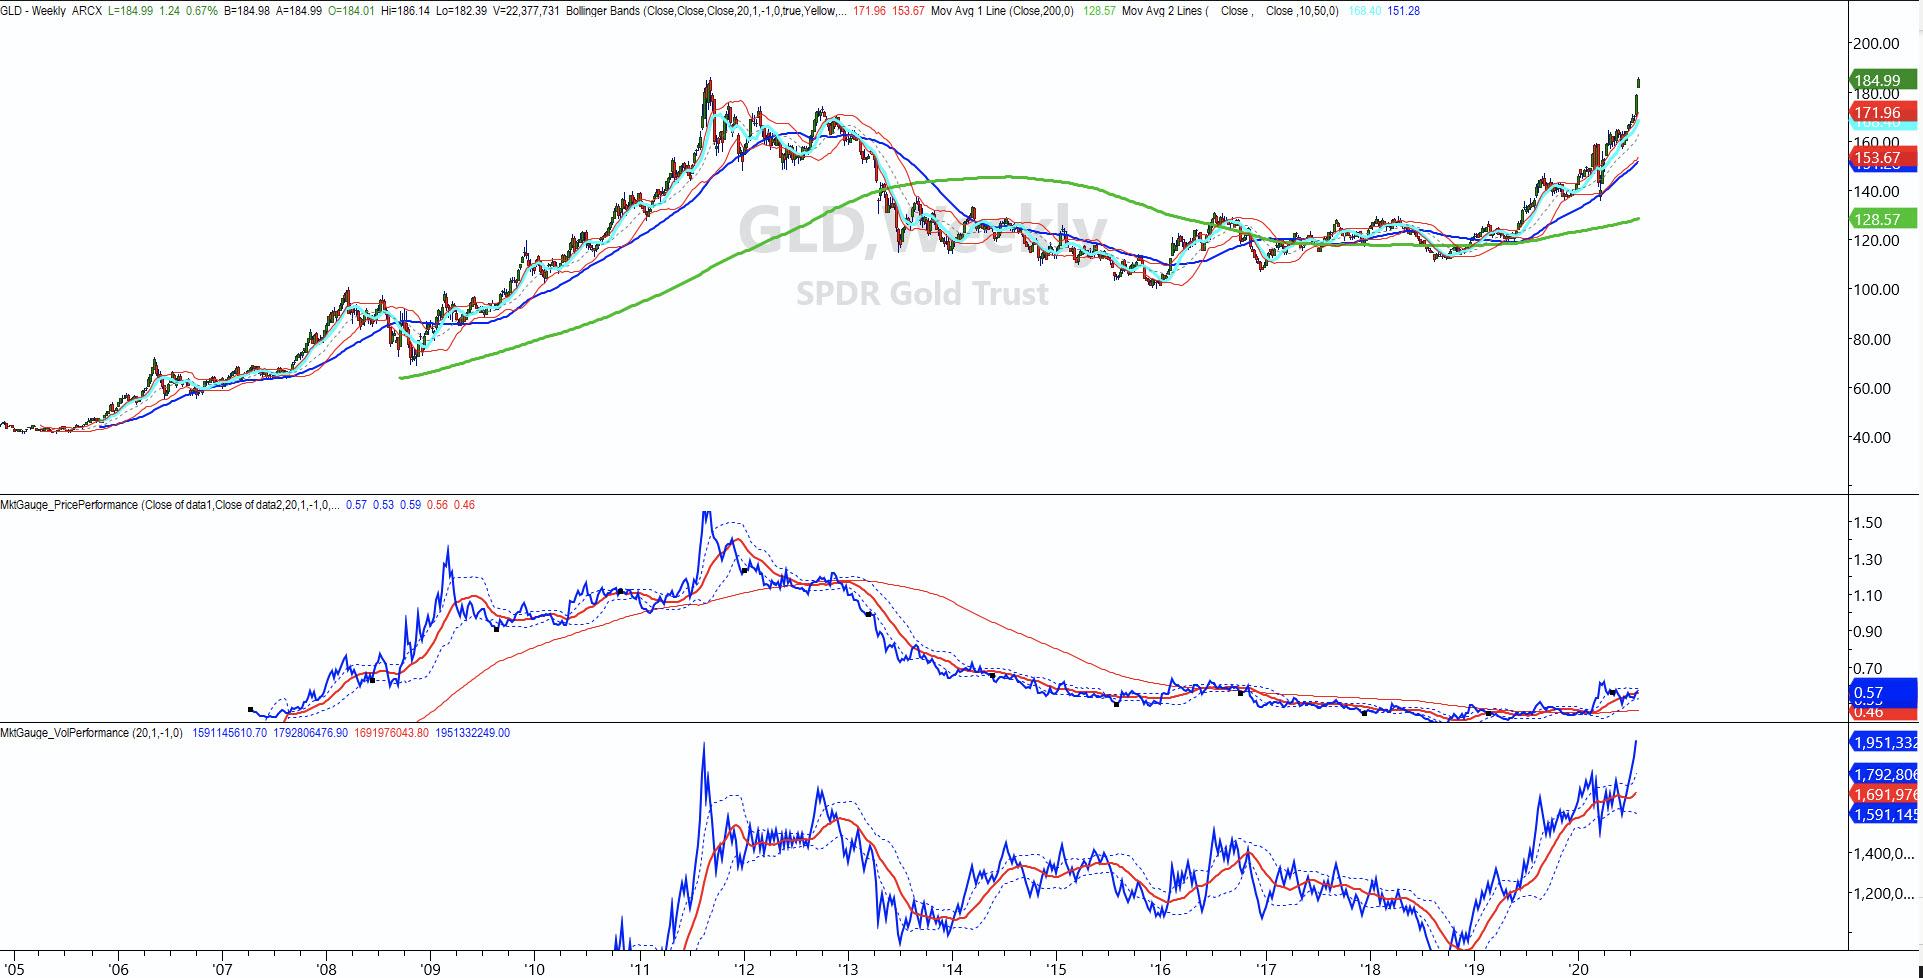
MarketGauge has some pretty cool proprietary software.
One indicator is Triple Play, which measures the ratio between a particular instrument and a benchmark. Triple Play reveals the true trend strength of a market based on "price leadership" and "volume power." This measure of the market'...
READ MORE
MEMBERS ONLY

POINT & FIGURE CHARTS OF TRANSPORTATION LEADERS SHOW BULLISH BREAKOUTS
by John Murphy,
Chief Technical Analyst, StockCharts.com
POINT & FIGURE CHARTS SHOW TRANSPORTATION BREAKOUTS...My morning message wrote about four transportation stocks that were achieving bullish breakouts. A glitch in the system, however, prevented me from showing their usual bar charts. So I've improvised a bit to bring their point & figure versions. Unlike bar...
READ MORE
MEMBERS ONLY

TRUCKERS LEAD TRANSPORTS HIGHER -- CHRW AND LANDSTAR SCORE BIG BREAKOUTS -- EXPEDITORS INTL HITS NEW RECORD -- TRANSPORTS LEAD XLI HIGHER
by John Murphy,
Chief Technical Analyst, StockCharts.com
DOW TRANSPORTS MOVE FURTHER ABOVE 200-DAY LINE... Transportation stocks are one of today's strongest groups. Chart 1 shows the Dow Transports gaining 2% this morning and moving further above their 200-day moving average which is now acting as a line of support (see red arrow). My...
READ MORE
MEMBERS ONLY

RSI for Trend-Following and Momentum Strategies - Apple Example

by Arthur Hill,
Chief Technical Strategist, TrendInvestorPro.com
RSI is widely used as a momentum oscillator to identify overbought and oversold levels. A dive into the formula, however, reveals that RSI is quite well equipped for trend-following strategies. It can even be used to rank ETFs and stocks to find those with the strongest momentum.
The strategy...
READ MORE
MEMBERS ONLY

Bullish on Gold, but Getting Nervous
by Carl Swenlin,
President and Founder, DecisionPoint.com
On Monday, gold rallied above the top in 2011 and made new, all-time highs. I've been more or less bullish on gold for several years, but it hasn't always been particularly easy, because gold's progress could usually best be described as "tortured....
READ MORE
MEMBERS ONLY

Sector Spotlight: Seasonality and RRGs
by Julius de Kempenaer,
Senior Technical Analyst, StockCharts.com
It's a very full show on this episode of Sector Spotlight. After a quick overview of what happened in asset classes and sectors last week, I take a look at seasonality combined with rotations on the RRG. Finally, I finish up the show by answering two mailbag questions...
READ MORE
MEMBERS ONLY
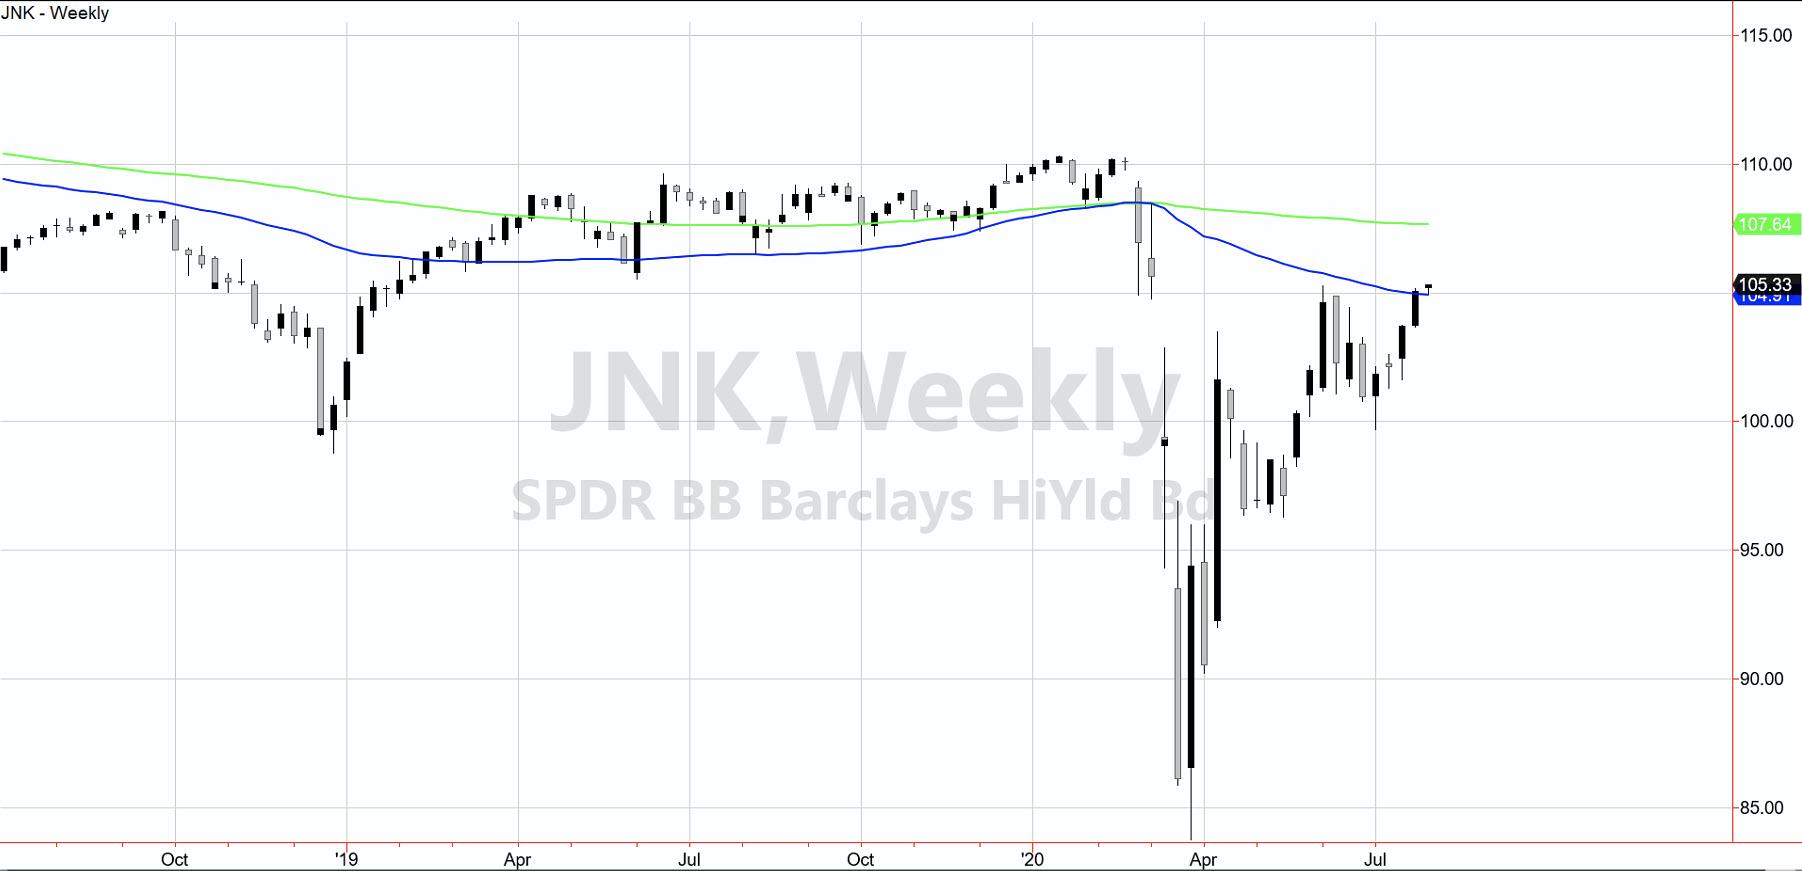
Who Says You Can't Time the Market?
Junk Bonds (JNK) rallied Friday, closing above the 50-week moving average. Then, today, JNK ran up to yet another new high since March. This is an excellent example of "Don't Fight the Fed!" (especially ahead of the Fed meeting). Until I see a shift in...
READ MORE
MEMBERS ONLY

Old Bear, New Trick

by Greg Morris,
Veteran Technical Analyst, Investor, and Author
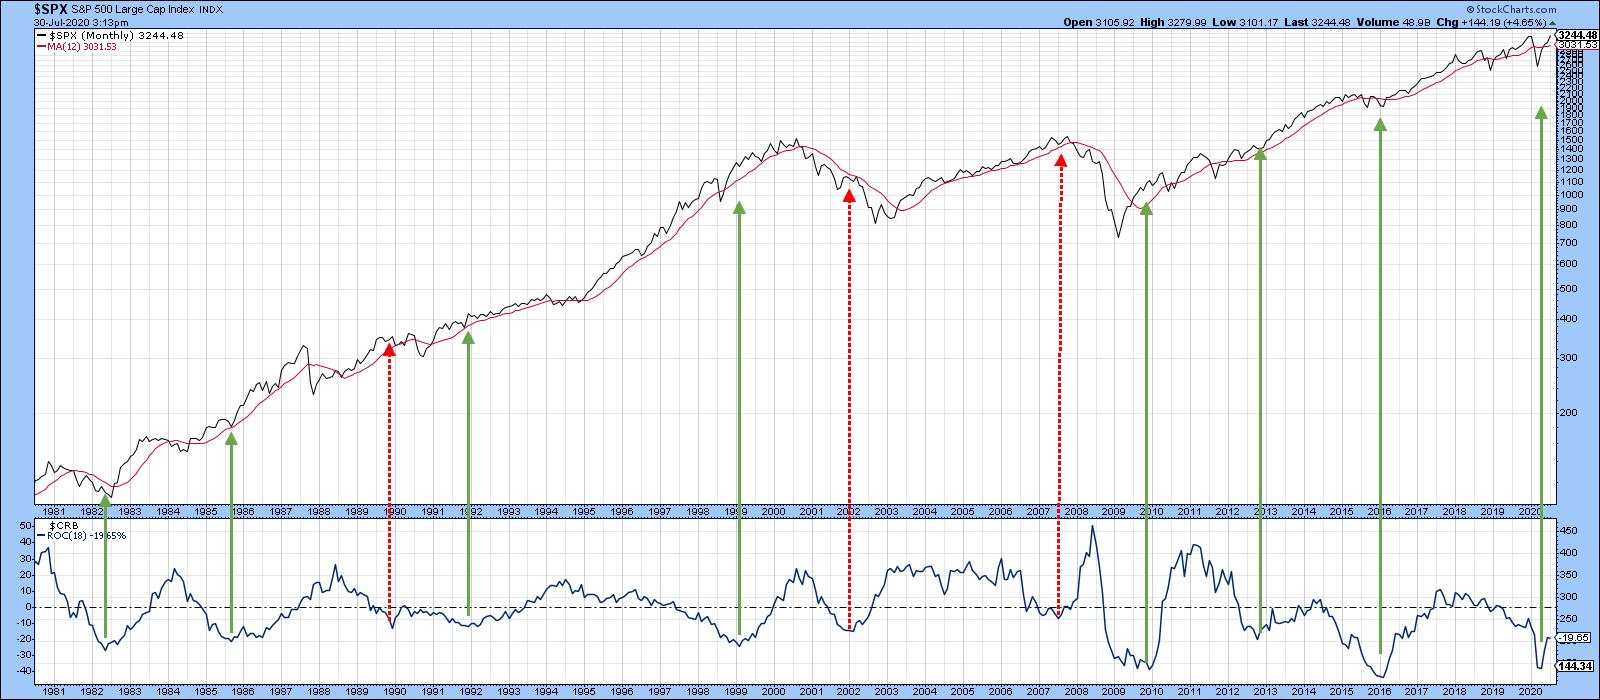
The S&P 500 recently got back to positive territory for 2020, with a year-to-date return of 1.4% as of July 22nd. It didn't stay positive for long though. Trading was down on the 23rd and 24th, bringing it back into negative territory as...
READ MORE
MEMBERS ONLY

TECH STOCKS REBOUND -- DOLLAR DROPS NEAR TWO-YEAR LOW AS PRECIOUS METALS SURGE -- FOREIGN ETFS REBOUND
by John Murphy,
Chief Technical Analyst, StockCharts.com
REBOUND IN NASDAQ 100 STEADIES MARKET... Stocks are opening the week on a firmer note. A rebound in tech stocks is one of the reasons why. Last Thursday's high-volume selloff in tech stocks caused some nervous profit-taking as the week ended. Chart 1 shows the Nasdaq...
READ MORE
MEMBERS ONLY
Sector Rotation Shows Weakness for Technology and Communication Services
by Julius de Kempenaer,
Senior Technical Analyst, StockCharts.com
Following Friday's close, we are facing a daily Relative Rotation Graph with some interesting (sector) rotations underway.
Energy
The Energy sector had a pretty good week. This comes after I suggested more weakness for this sector in Sector Spotlight on Tuesday 7/21... I recorded that show on...
READ MORE
MEMBERS ONLY
This Telecom Stock Seems To Be Giving Up...
by Milan Vaishnav,
Founder and Technical Analyst, EquityResearch.asia and ChartWizard.ae
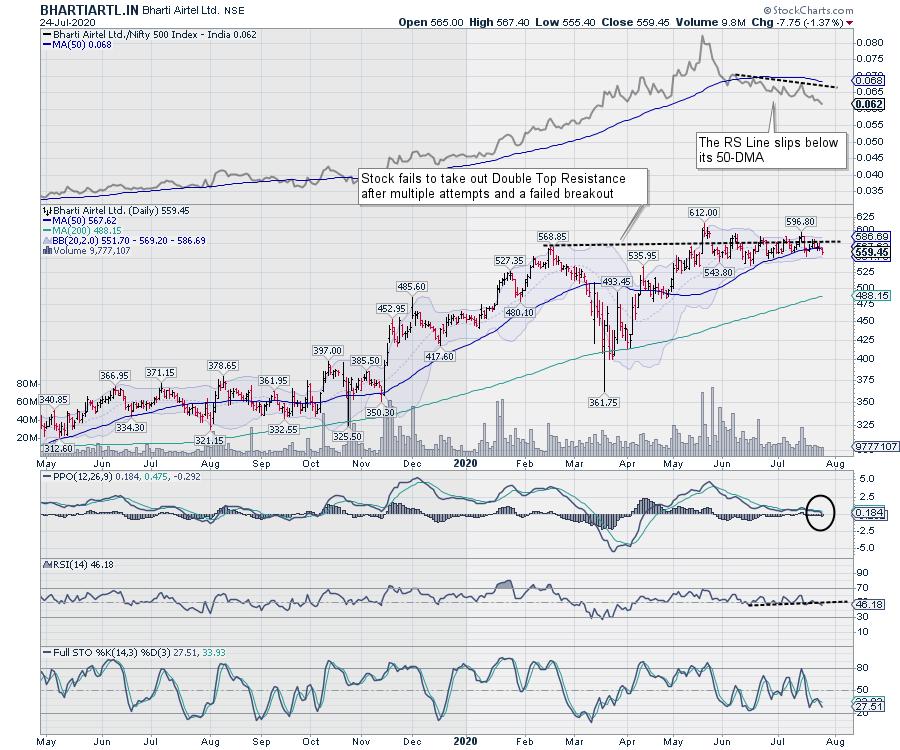
The upper extended trend line shows that the Double Top breakout not only fizzled out, but the price action failed to move past that double top resistance several times. This has reinforced the credibility of this resistance.
Presently, the price has slipped below the 50-DMA.
The daily MACD has...
READ MORE
MEMBERS ONLY
Two Of The Strongest Industry Groups Just Keep Getting Stronger
by Tom Bowley,
Chief Market Strategist, EarningsBeats.com
It's no secret that I like finding leading stocks in leading industry groups. In my view, however, THAT is the secret sauce in building a portfolio to outperform the benchmark S&P 500 over time. Of course, there will be hiccups along the way and we'...
READ MORE
MEMBERS ONLY
Week Ahead: Chase Momentum Vigilantly If NIFTY Attempts Higher Levels; RRG Chart Show This Sector Taking a U-Turn
by Milan Vaishnav,
Founder and Technical Analyst, EquityResearch.asia and ChartWizard.ae
The week before this one had seen the headline index testing a couple of important levels on daily and weekly timeframe charts. On the daily chart, the index had closed a notch above the 200-DMA; on the weekly chart, it had tested the 50-week MA. Over the past...
READ MORE
MEMBERS ONLY
Explosive Earnings Are Propelling Stocks Higher In These 2 Surprising Areas
by Mary Ellen McGonagle,
President, MEM Investment Research
It's been proven that strong earnings are the number one driver of a stock's upward advance and with earnings season under way, there's no better time to vet the next set of stocks poised to trade much higher.
So far, over a quarter of...
READ MORE
MEMBERS ONLY
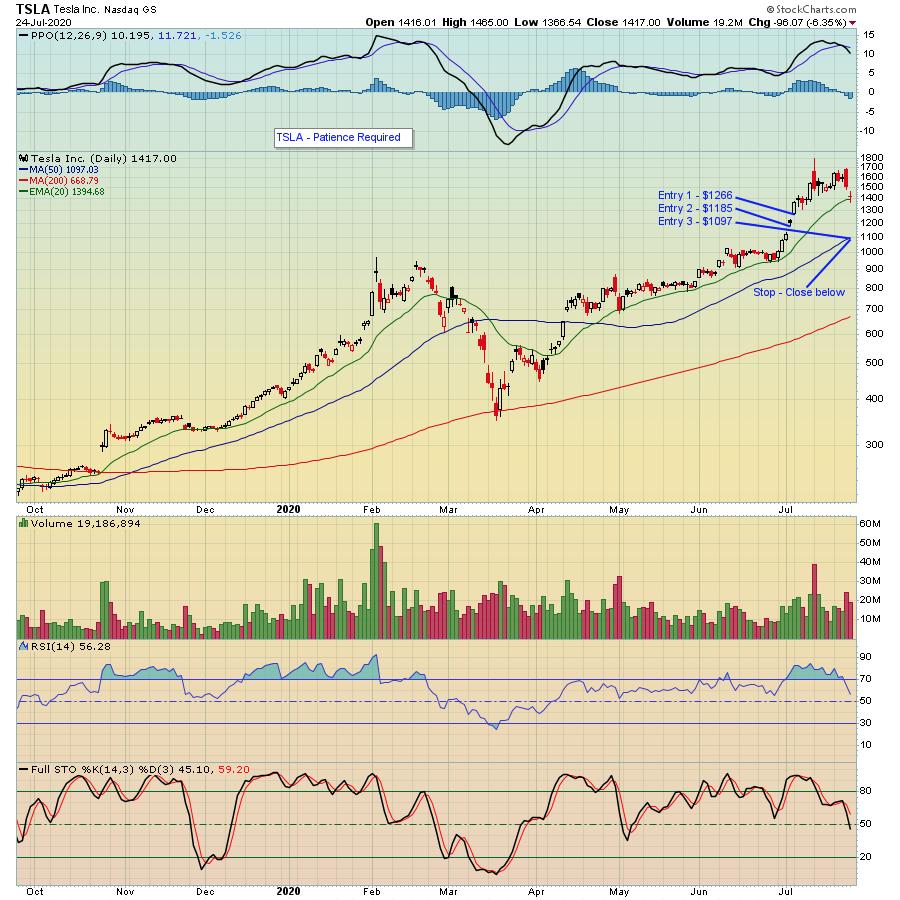
Those Who Are Patient Could REALLY Cash In!

by John Hopkins,
President and Co-founder, EarningsBeats.com
When Tesla (TSLA) reported its earnings last week, they smashed all expectations, both on the top and bottom line. The immediate reaction was mixed, but then we saw the tech sector in general take a hit for a few days in a row, and TSLA did not escape the selling....
READ MORE
MEMBERS ONLY
Big Techs Lead Market Retreat
by John Murphy,
Chief Technical Analyst, StockCharts.com
A selloff in the biggest tech stocks is putting downside pressure on stocks today; and is helping make the Nasdaq 100 the day's biggest percentage loser. And it looks technically vulnerable to a deeper pullback. The daily bars in Chart 1 show the Nasdaq 100 (QQQ) testing its...
READ MORE
MEMBERS ONLY

Are the Markets Stalling?
by Mary Ellen McGonagle,
President, MEM Investment Research
In this episode of StockCharts TV'sThe MEM Edge, Mary Ellen reviews the market's action and highlights key levels for the Indices. She also shares insights into the move away from recently leading areas and how earnings reports are signaling some near-term trend changes.
This video...
READ MORE