MEMBERS ONLY

Our Top Trade Targets Are On The Table For You To See: Don't Miss The Latest Edition Of "The Pitch"

by Grayson Roze,
Chief Strategist, StockCharts.com
Without a doubt, one of my favorite shows on StockCharts TV right now is "The Pitch", a monthly series where we assemble three different technical analysts and ask each of them to bring their five best individual ideas to the table.
With each guest pitching a narrow list...
READ MORE
MEMBERS ONLY
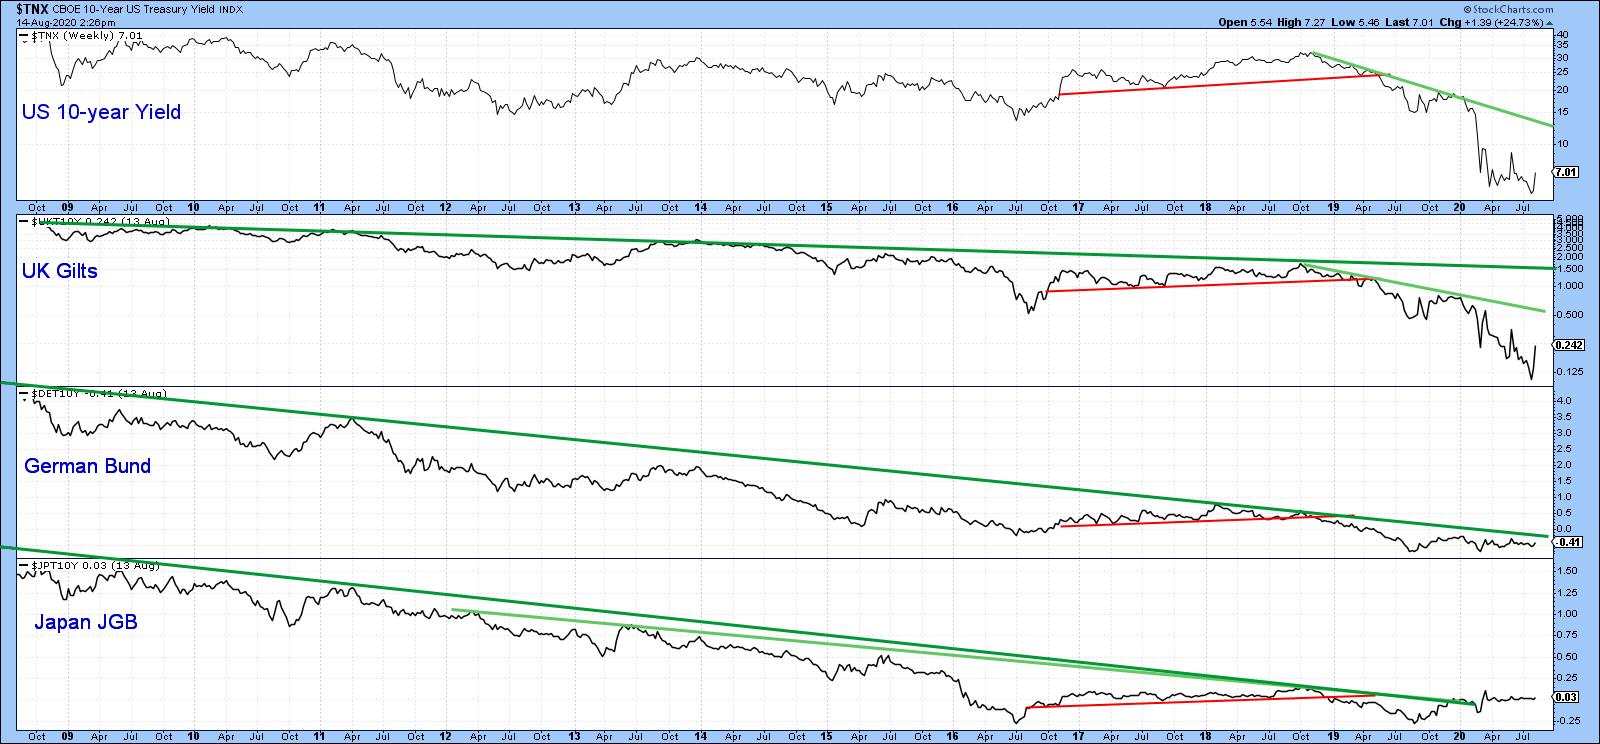
Time for a Little Firmness in Bond Yields?

by Martin Pring,
President, Pring Research
Chart 1 shows that the basic trend for bond yields around the world is still negative, as all series are in a clear-cut downtrend. The only exception is Japan, where the secular down trendline was violated earlier in the year. So far, though, the yield has only managed a...
READ MORE
MEMBERS ONLY

S&P 500 TESTING ITS FEBRUARY HIGH -- USING BOLLINGER BANDS FOR GUIDANCE

by John Murphy,
Chief Technical Analyst, StockCharts.com
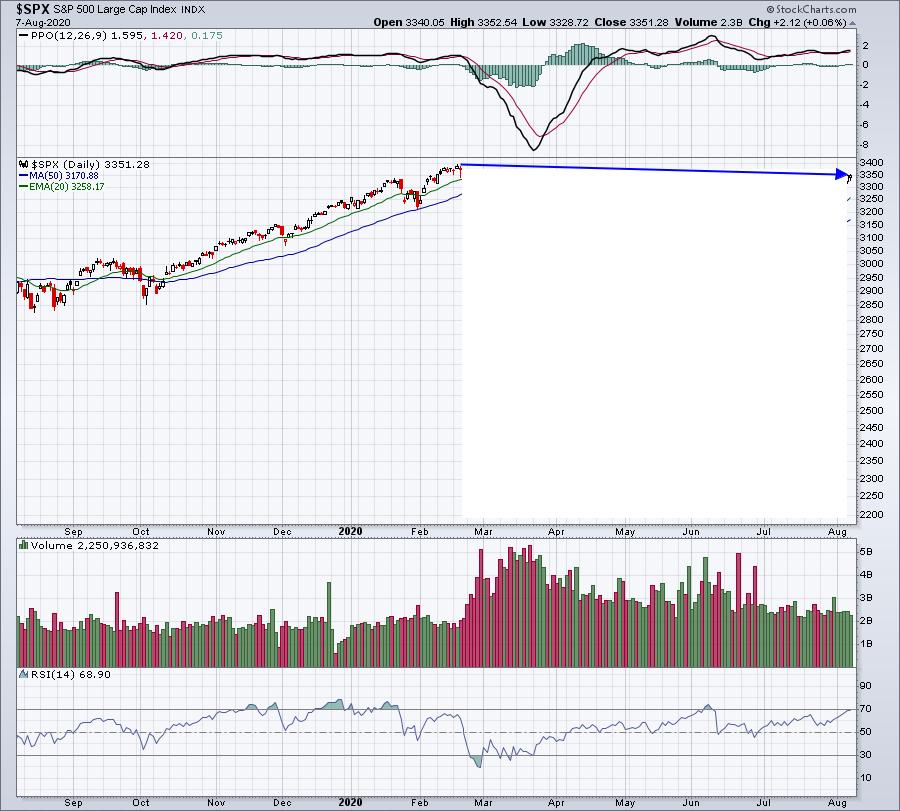
S&P 500 IS TESTING ITS FEBRUARY HIGH... The most important test going on at the moment is the S&P 500 challenging its February high. Its highest intra-day value shown in Chart 1 is 3393.52. The SPX closing high for February was 3386.15. Although...
READ MORE
MEMBERS ONLY

If This Line Doesn't Hold, Stocks May Get Hit

by Geoff Bysshe,
Co-founder and President, MarketGuage.com
While the media is obsessively focused on cheering for the S&P 500 to close at a new all-time high, the bond market is quietly collapsing.
TLT broke its 50-DMA today and has now had its second worst 5-day slide since the March 2020 meltdown.
The...
READ MORE
MEMBERS ONLY
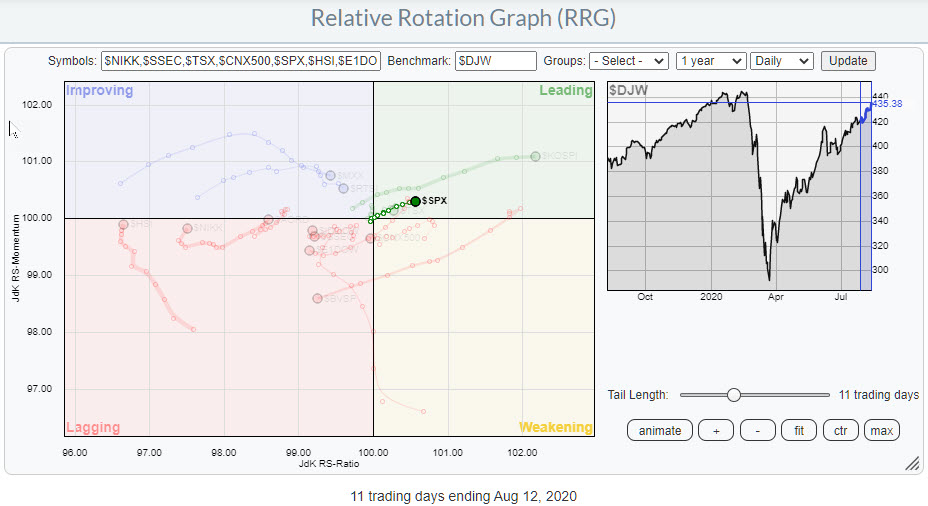
Break to New Highs in $SPX is Crucial for Leadership vs. Rest of the World

by Julius de Kempenaer,
Senior Technical Analyst, StockCharts.com
Towards the end of May, the US stock market ($SPX) started to lose relative strength vs. other major world market stock indexes.
Around that time the $SPX tail vs. $DJW, the Dow Jones Global Index, rolled over inside the leading quadrant and started to rotate into and through weakening. This...
READ MORE
MEMBERS ONLY

This Base Breakout Should Concern You
by Geoff Bysshe,
Co-founder and President, MarketGuage.com
Today's chart is one that every investor should keep an eye on (but most will not), as that double bottom base breakout pattern is in a market that has been declining for almost a decade! However, there's good reason to believe it could wake up like...
READ MORE
MEMBERS ONLY

Darvas and Breakouts

by Dave Landry,
Founder, Sentive Trading, LLC
In this edition of Trading Simplified, Dave explains Darvas and continuing his "Methodology In Action" series. He also presents examples of his "Landry Light" indicator to help qualify setups.
This video was originally broadcast on August 12th, 2020. Click anywhere on the Trading Simplified logo above...
READ MORE
MEMBERS ONLY

WEAK DOLLAR ALSO BOOSTS EMERGING MARKET ETFS -- SOUTH KOREA ETF IS BREAKING OUT -- TAIWAN IS ALREADY IN RECORD TERRITORY
by John Murphy,
Chief Technical Analyst, StockCharts.com
EMERGING MARKET ETFS ALSO BENEFIT FROM WEAKER DOLLAR... My earlier message today made the point that a weaker dollar is benefiting foreign stock ETFs that are quoted in dollars. The message showed the rising euro benefiting eurozone ETFs with Germany on the verge of a bullish breakout. The same principle...
READ MORE
MEMBERS ONLY

WEAK DOLLAR CONTINUES TO BOOST FOREIGN STOCK ETFS QUOTED IN DOLLARS -- EUROZONE ETF REACHES SIX-MONTH HIGH -- GERMANY ISHARES MAY BE BREAKING OUT -- THE NETHERLANDS ETF HITS NEW RECORD
by John Murphy,
Chief Technical Analyst, StockCharts.com
EAFE ISHARES REACH SIX-MONTH HIGH... I wrote a message three weeks ago on Wednesday, July 22 to the effect that a weaker U.S. dollar was boosting foreign stocks ETFs that are quoted in dollars. When American investors buy foreign stocks, they're also indirectly buying local currencies....
READ MORE
MEMBERS ONLY

A Potential Breakout from a Bollinger Band Squeeze

by Milan Vaishnav,
Founder and Technical Analyst, EquityResearch.asia and ChartWizard.ae
SBIN.in (State Bank Of India)
SBI.in has seen a prolonged period of low volatility over the past several weeks, which has led to contraction of the Bollinger bands. Periods of low volatility are often followed by the periods of high volatility. The probability of the sharp move in...
READ MORE
MEMBERS ONLY

Mish Warned You About Junk Bonds...
by Geoff Bysshe,
Co-founder and President, MarketGuage.com
Will today's market tremors shake the QQQ out of its solidly bullish 4-month channel?
On April 14th, the QQQ broke above its 50 DMA (blue line) and began the trend that you see above. A steady trend line with 6 points is an impressive feat. Today'...
READ MORE
MEMBERS ONLY

Time for a Little Firmness in Bond Yields?
by Martin Pring,
President, Pring Research
Chart 1 shows that the basic trend for bond yields around the world is still negative, as all series are in a clear-cut downtrend. The only exception is Japan, where the secular down trendline was violated earlier in the year. So far, though, the yield has only managed a...
READ MORE
MEMBERS ONLY

Sector Spotlight: Four Interesting Sector Rotations
by Julius de Kempenaer,
Senior Technical Analyst, StockCharts.com
In this edition of Sector Spotlight, I look at the rotations for Asset Classes and US sectors, zooming in on the combination of weekly and daily rotations for Consumer Discretionary, Materials, Communication Services and Technology. After the break, I touch on the current positions in the long short baskets and...
READ MORE
MEMBERS ONLY
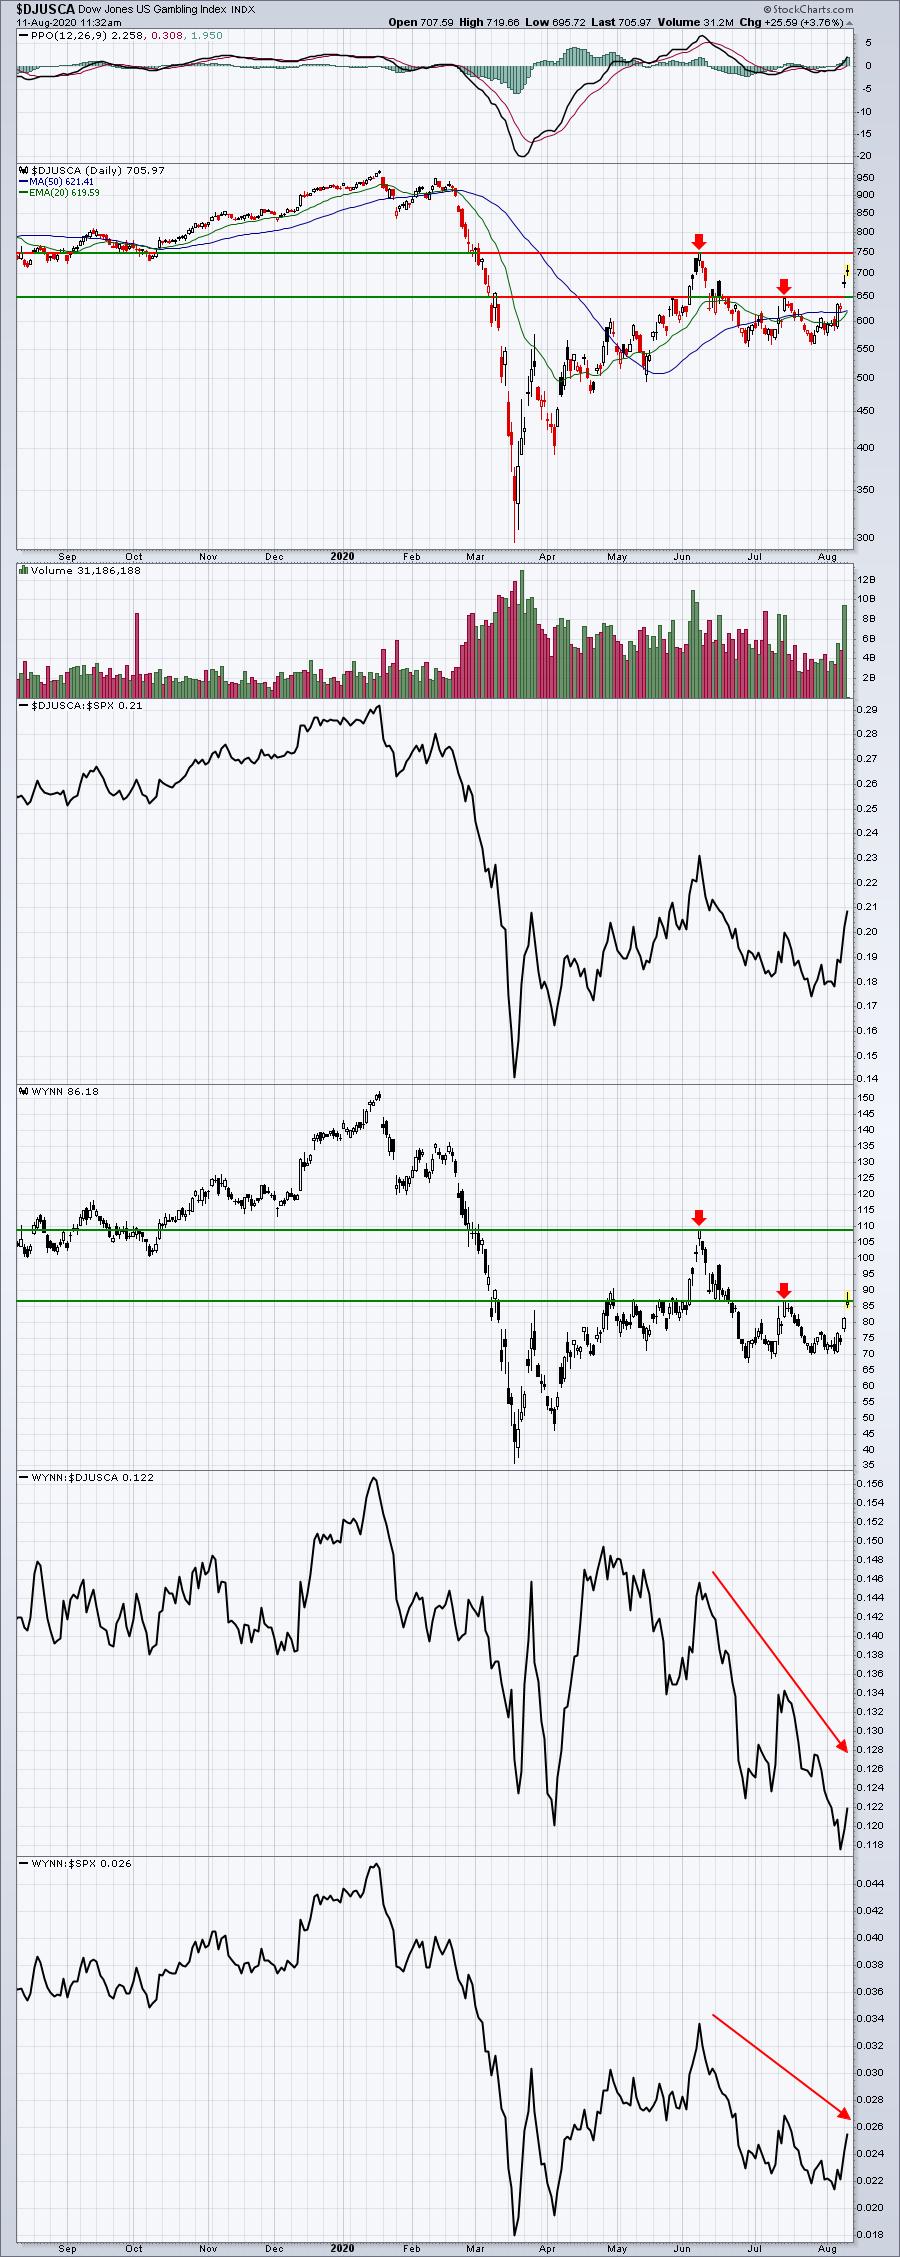
Gambling Stocks Are Looking For A WYNN-Win

by Tom Bowley,
Chief Market Strategist, EarningsBeats.com
Many of the worst-hit stocks during the pandemic are leading this latest rally and, among those, are gambling stocks ($DJUSCA). The group broke out yesterday above July highs and now has its collective sight set on the June 8th closing high of 747. Wynn Resorts (WYNN), one of the...
READ MORE
MEMBERS ONLY

BOUNCING BOND YIELDS BOOST BANKS AND FINANCIALS -- AND CONTRIBUTE TO PROFIT-TAKING IN GOLD
by John Murphy,
Chief Technical Analyst, StockCharts.com
GLOBAL YIELDS REBOUND... Bond yields are rebounding today. That may be partially due to an uptick in producer price inflation. Or the fact that global stocks are also rebounding which is driving some money out of bonds and into stocks. Global yields are rebounding along with stocks. Chart 1 shows...
READ MORE
MEMBERS ONLY

DP Show: Is It Time to Leave Technology Behind?

by Erin Swenlin,
Vice President, DecisionPoint.com

by Carl Swenlin,
President and Founder, DecisionPoint.com
In this episode of DecisionPoint, Carl and Erin discuss the demise of Technology and the resurgence of Industrials. Should we leave Technology behind? Negative divergences still persist on major indexes, so Erin discusses her strategy of using trailing stops to maximize profit with excellent protection when the overall market is...
READ MORE
MEMBERS ONLY

UPS vs. FedEx: It's Like Splitting Hairs
by Tom Bowley,
Chief Market Strategist, EarningsBeats.com
Earlier today, I was a guest on "Your Daily 5" and I featured 5 charts that I believe we should all be focused on right now. One of the charts I discussed was the Dow Jones U.S. Delivery Services Index ($DJUSAF), which has exploded higher after two...
READ MORE
MEMBERS ONLY

DOW INDUSTRIALS EXCEED JUNE HIGH -- CATERPILLAR AND NIKE BREAK OUT -- AIRLINES LEAD TRANSPORTS HIGHER -- FEDEX HAS ANOTHER BIG DAY
by John Murphy,
Chief Technical Analyst, StockCharts.com
DOW EXCEEDS JUNE HIGH... The Dow Industrials continue to gain ground on the rest of the stock market. And is the strongest of the three major stock indexes today. Chart 1 shows the Dow Industrials trading above their June intra-day peak at 27,600. The Dow is the last...
READ MORE
MEMBERS ONLY

ALUMINUM AND STEEL STOCKS LEAD MATERIALS HIGHER -- ALCOA AND CENTURY ALUMINUM HAVE STRONGER CHART PATTERNS -- SO DO NUCOR AND STEEL DYNAMICS
by John Murphy,
Chief Technical Analyst, StockCharts.com
ALCOA CLEARS 200-DAY LINE...CENTURY ALUMINUM LEADS... Material stocks continue to act as market leaders. Strong gold miners are a big part of that. So are copper miners. Last Wednesday' message showed the Dow Jones Nonferrous Metals Index scoring a bullish breakout along with Freeport McMoran (FCX); and...
READ MORE
MEMBERS ONLY
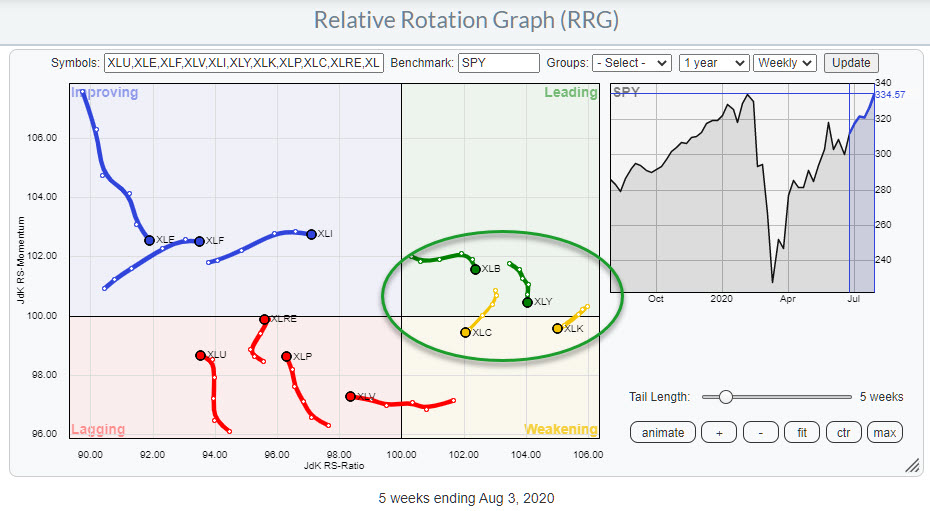
Sector Rotation From Materials and Discretionary to Tech and Communication
by Julius de Kempenaer,
Senior Technical Analyst, StockCharts.com
The weekly Relative Rotation Graph for US sectors shows four sectors at the right-hand side of the plot, JdK RS-Ratio > 100 and all seven other sectors at the left-hand side. This indicates that, from a relative strength perspective, the market is driven by only four sectors....
READ MORE
MEMBERS ONLY
The Aftermath of 2020: What Will It Look Like?
by Tom Bowley,
Chief Market Strategist, EarningsBeats.com
Somehow, we've been able to weather the storm that's called 2020. I'm speaking from a stock market perspective. The health care crisis has taken its toll and continues to take its toll and impact our everyday lives. But if you pulled up an S&...
READ MORE
MEMBERS ONLY

Week Ahead: NIFTY Likely to Stay in a Range; RRG Chart Shows These Sectors Staying Resilient
by Milan Vaishnav,
Founder and Technical Analyst, EquityResearch.asia and ChartWizard.ae
After clocking robust gains in July, the NIFTY started off the first week of August on a positive note. Over the past five sessions, the markets traded in a 374-point range before closing the week with modest gains. The NIFTY stayed above its critical levels on both the daily...
READ MORE
MEMBERS ONLY
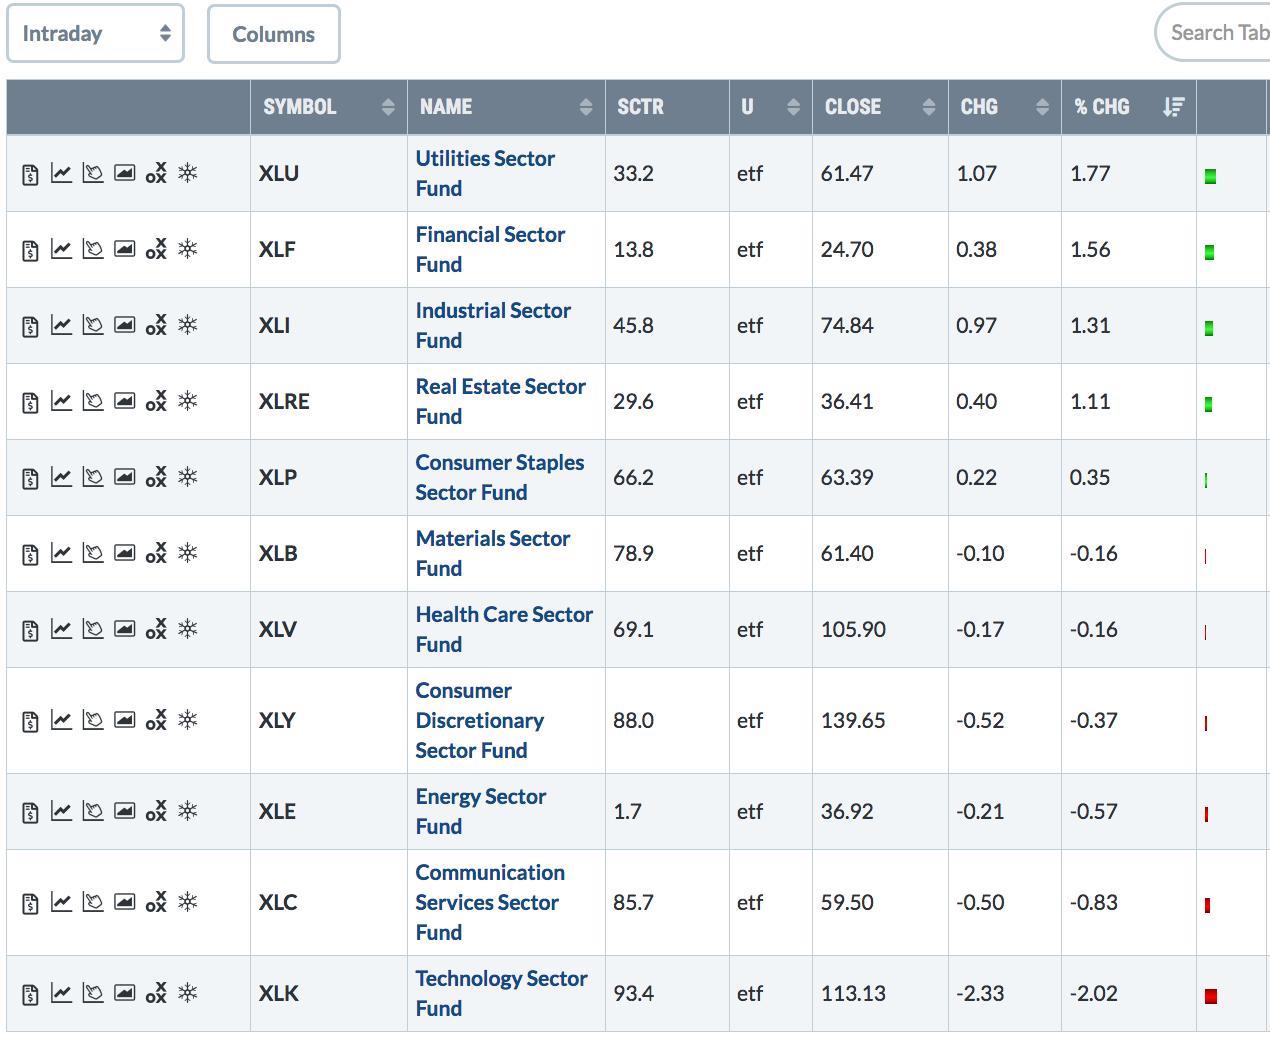
Techs Retreat as Other Groups Gain
by John Murphy,
Chief Technical Analyst, StockCharts.com
Big tech has been the main story in the market since the start of the pandemic with most of the rest of the market largely left behind. Over the past couple of weeks, however, we've started to see some money moving into weaker parts of the stock market...
READ MORE
MEMBERS ONLY
Two Industrial Sector Stocks that are Prepared to Perform!
by Erin Swenlin,
Vice President, DecisionPoint.com
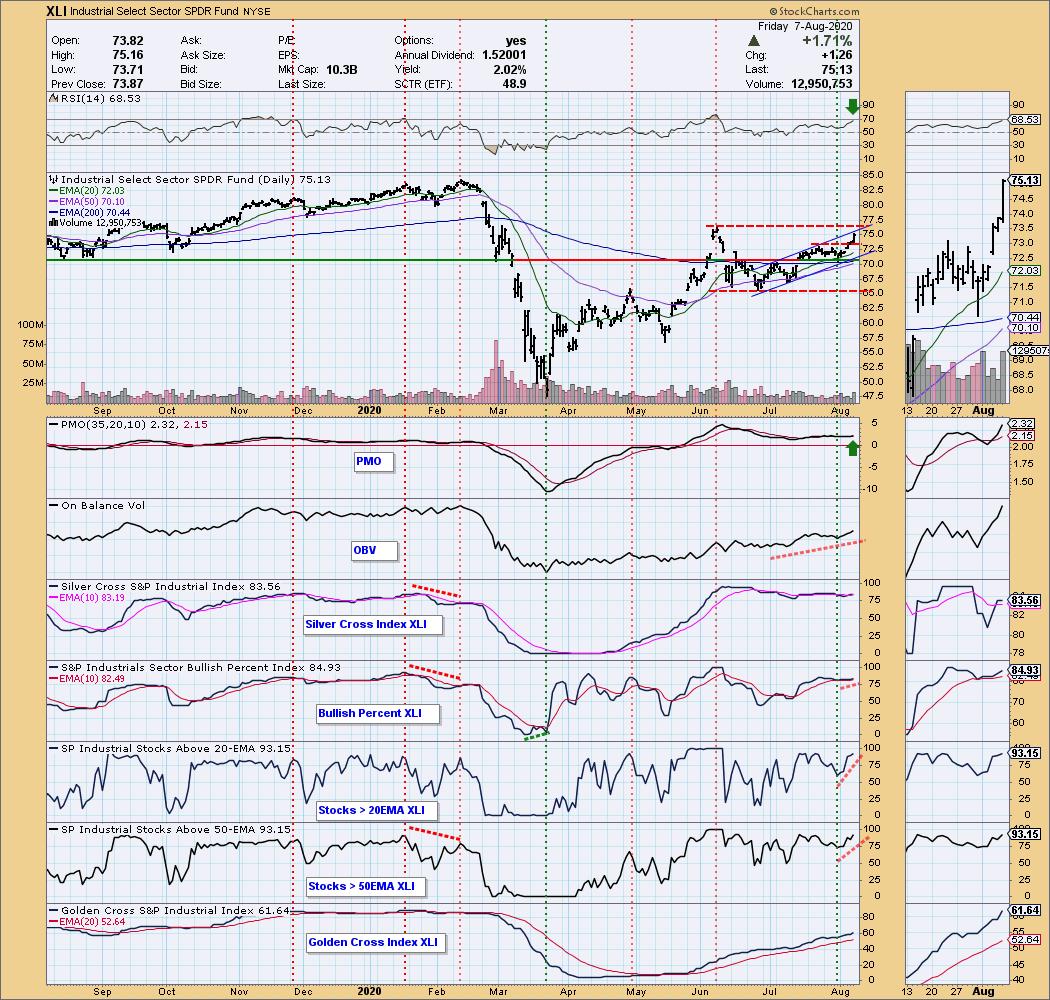
On Wednesday afternoon, as I was preparing to record the DecisionPoint show, I did a scan of the sectors in preparation and the Industrial Sector SPDR (XLI) caught my eye after a nice gap up. I scanned my Tuesday DecisionPoint Diamonds and, sure enough, I had presented an Industrial stock...
READ MORE
MEMBERS ONLY

Major Market Rotation Taking Shape!

by Mary Ellen McGonagle,
President, MEM Investment Research
In this episode of StockCharts TV'sThe MEM Edge, Mary Ellen explores significant moves taking place in the market and reviews the best ways to play them. She also shares the 3 triggers of a highly bullish stock and where you can uncover them.
This video was originally broadcast...
READ MORE
MEMBERS ONLY
Powerhouse Stocks with Smashing Results

by John Hopkins,
President and Co-founder, EarningsBeats.com
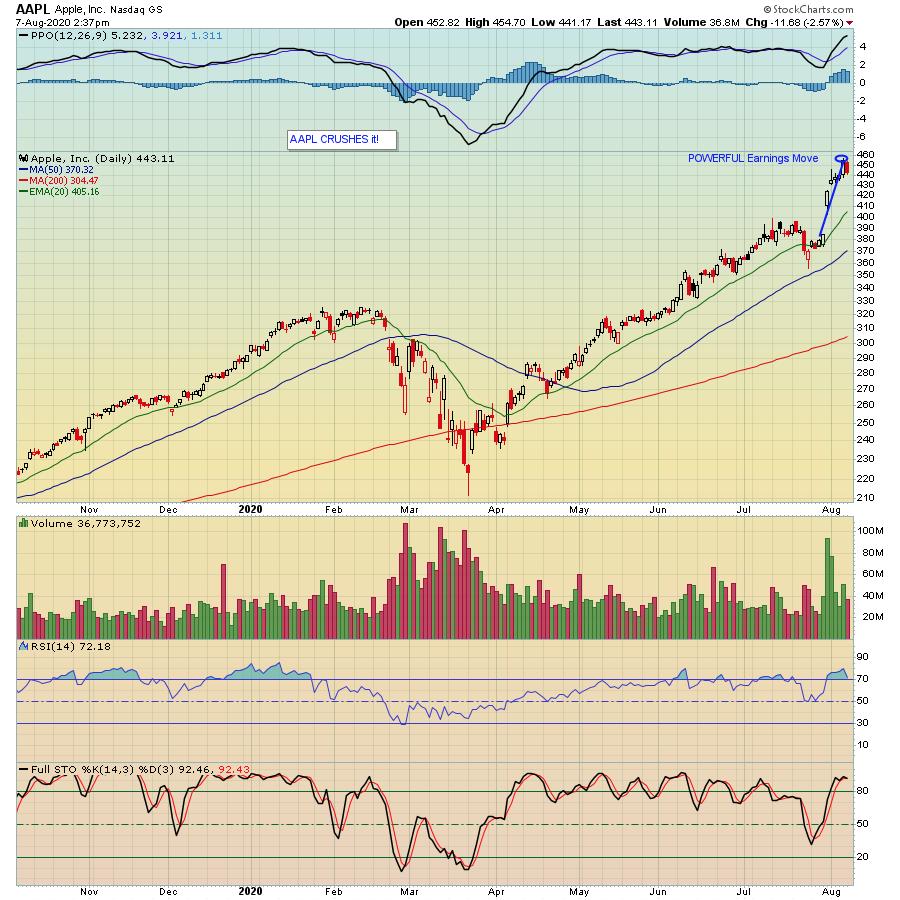
A number of tech giants have crushed earnings expectations, something that becomes quite apparent when you look at their charts. For example, take a look at Apple (AAPL), which recently reported its numbers:
Your eyes are not deceiving you. Since the company reported its earnings on July 30, the stock...
READ MORE
MEMBERS ONLY

A Top-Down Approach To Find Market-Beating Stocks
by Grayson Roze,
Chief Strategist, StockCharts.com
Back at it this week on StockCharts TV! I had the pleasure of once again hosting "Your Daily Five" this afternoon and I gotta say – I am a HUGE fan of this format. In just about 10 minutes, we bring you a concise, action-packed daily rundown of...
READ MORE
MEMBERS ONLY

Four Stocks Poised to Drive Healthcare Higher

by Arthur Hill,
Chief Technical Strategist, TrendInvestorPro.com
The Healthcare SPDR (XLV) is one of the strongest sectors in 2020. Even though it does not sport the biggest gain, XLV recorded a new high in July and some 80% of its components are above their 200-day EMAs. The new high points to a long-term uptrend and...
READ MORE
MEMBERS ONLY

The Dance Of The Outperformers: Peter Lynch Preaches You Best Start With Yourself

by Gatis Roze,
Author, "Tensile Trading"
Novice investors seldom like to hear that before asset growth (trading) must come asset protection. Boring! Similarly, they are reticent in embracing the reality that before they begin analyzing equities, they must first analyze themselves. Really? Legendary stock-picker Peter Lynch specifically warned investors of these "Investor Self"...
READ MORE
MEMBERS ONLY

TECHS RETREAT AS OTHER GROUPS GAIN -- INDUSTRIALS ARE WEEK'S TOP SECTOR -- SMALL CAPS AND TRANSPORTS ALSO GAIN -- FEDEX DELIVERS 52-WEEK HIGH WHILE UPS REACHES NEW RECORD--
by John Murphy,
Chief Technical Analyst, StockCharts.com
MODEST ROTATION TAKES PLACE... Big tech has been the main story in the market since the start of the pandemic with most of the rest of the market largely left behind. Over the past couple of weeks, however, we've started to see some money moving into weaker parts...
READ MORE
MEMBERS ONLY
3 Major Market Themes for the Rest of August
As Keith and I are heading on a vacation (with social distancing) starting Monday for 3 weeks, this is the last Daily that I will write until September 1st. Yet, not to worry, Geoff Bysshe will be taking over both my subscription service and the writing of the Daily blog....
READ MORE
MEMBERS ONLY

MicroSector ETN With All The Right Stocks - And It's Leveraged!
by Mary Ellen McGonagle,
President, MEM Investment Research
We can thank one of the subscribers to my MEM Edge Report for today's chart you don't want to ignore! It's for an Exchange Traded Note (ETN) that tracks 3x the daily movements of an index of U.S. listed technology and consumer discretionary...
READ MORE
MEMBERS ONLY

Evidence of a Commodity Bull Market Continues to Grow
by Martin Pring,
President, Pring Research
I have written about commodities several times in the last four months or so as evidence of a major reversal had begun to appear. Now, more indicators are starting to turn. Near-term, things look overdone, but if this is really is a bull market, that will not matter, as...
READ MORE
MEMBERS ONLY
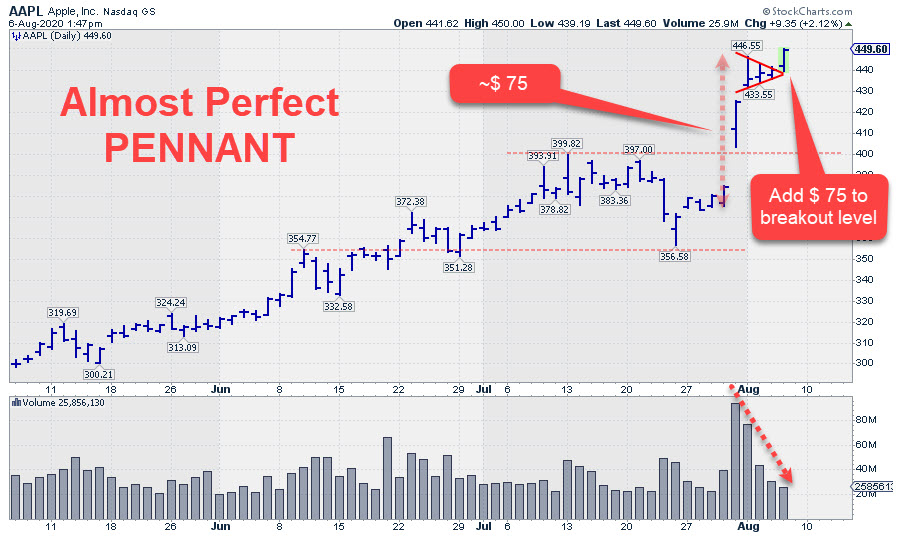
Break from "Pennant" Targets $500 for AAPL
by Julius de Kempenaer,
Senior Technical Analyst, StockCharts.com
To get some inspiration for a nice subject or stock to show in this article, I went to my dashboard, on which I have one widget that shows the most actively traded stocks in the Dow Jones Industrials index.
A nice little gimmick is that you can run an RRG...
READ MORE
MEMBERS ONLY

DP Show: Sky's the Limit for Gold (and Silver!)
by Erin Swenlin,
Vice President, DecisionPoint.com
by Carl Swenlin,
President and Founder, DecisionPoint.com
In this episode of DecisionPoint, Erin reviews the technicals on the DecisionPoint Scoreboard Indexes (SPX, NDX, OEX & Dow) and points out some negative divergences on primary indicators that are troubling her bullish outlook. Carl discusses how Gold Premiums and Discounts are calculated and the implications of seeing high discounts...
READ MORE
MEMBERS ONLY
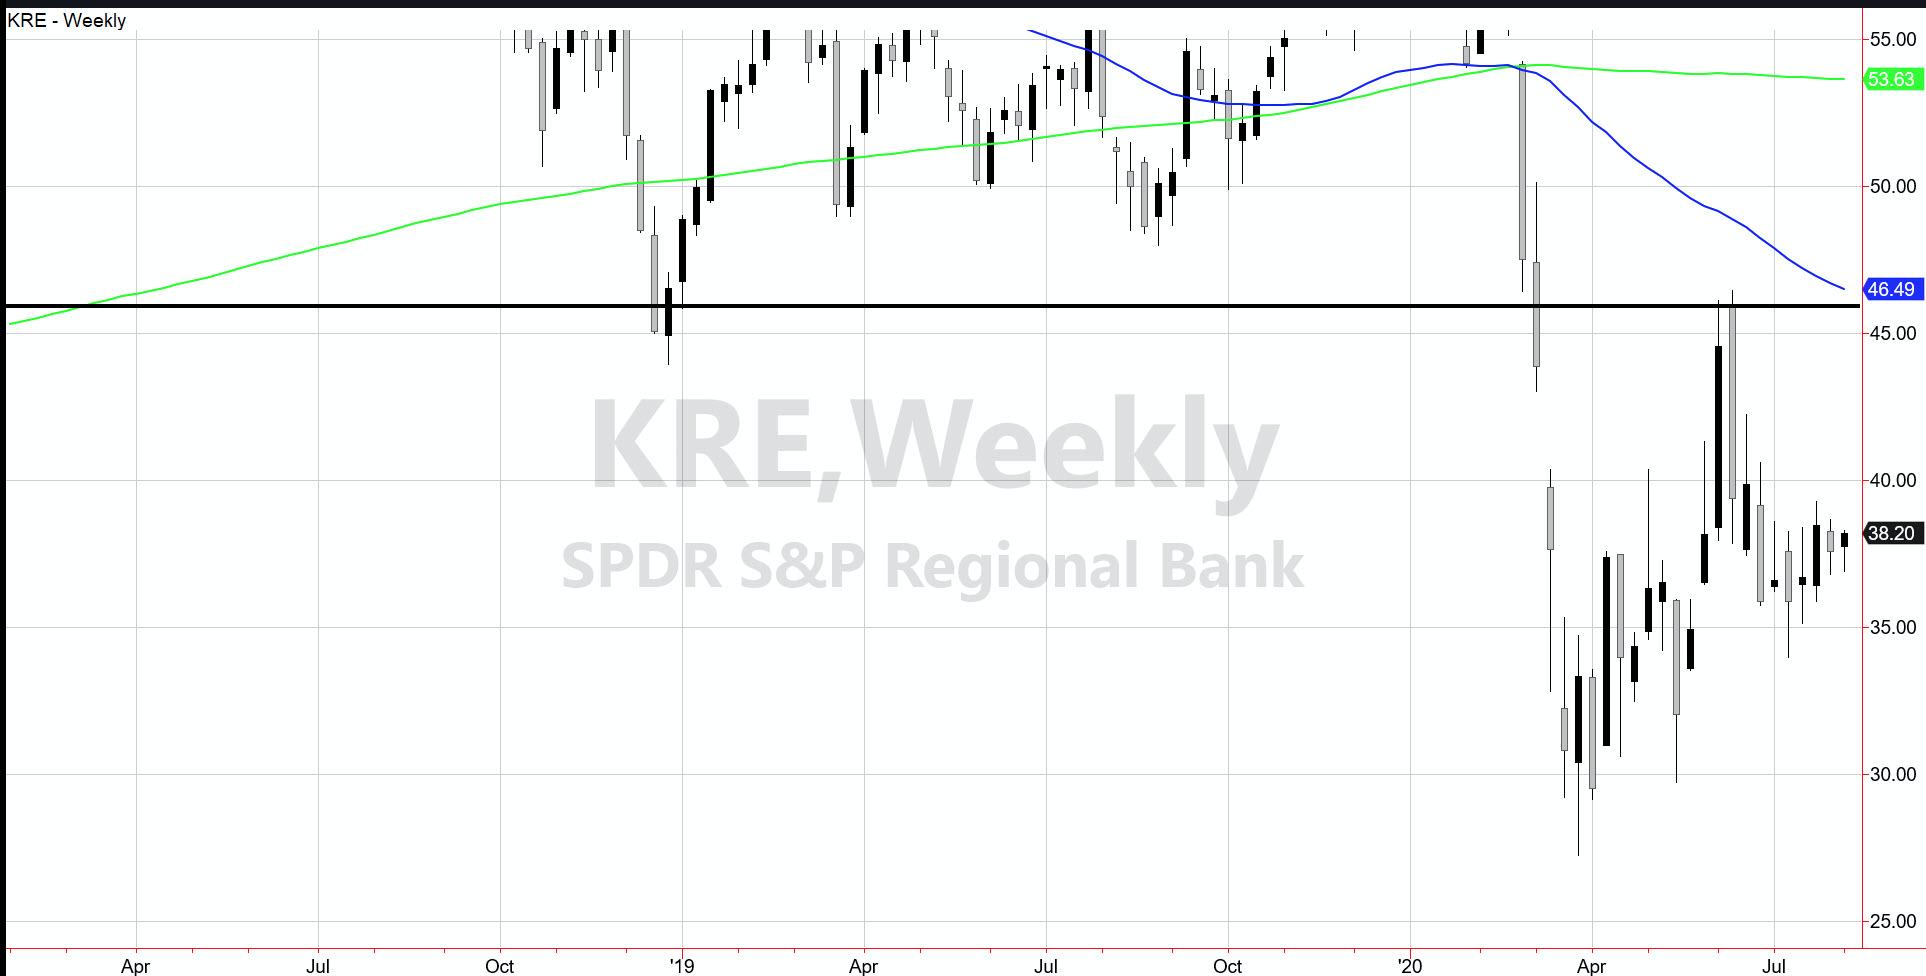
Regional Banks - The Prodigal Dunce
With the Russell 2000 breaking out over the 50 and 200-week moving averages, the market looks like blue skies, right?
Retail (XRT) ran to just over $50.00. Sister Semiconductors (SMH) rocked to another new all-time high. Transportation (IYT) passed the critical test at the 200-WMA. Biotechnology...
READ MORE
MEMBERS ONLY

SMALL CAPS AND DOW TRANSPORTS EXCEED THEIR JUNE PEAKS -- DOW EXCEEDS JULY PEAK -- XLI CLEARS 200-DAY LINE -- DEERE BREAKS OUT -- S&P 500 NEARS TEST OF FEBRUARY PEAK
by John Murphy,
Chief Technical Analyst, StockCharts.com
RUSSELL 2000 ISHARES AND DOW TRANSPORTS PASS JUNE HIGH...DOW GAINS...The rally in stocks continues to broaden out. Market groups that had lagged behind the stock recovery are starting to catch up. Small caps and transports are two examples. Chart 1 shows the Russell 2000 iShares (IWM) trading above...
READ MORE
MEMBERS ONLY

The Right Place at the Right Time
by Dave Landry,
Founder, Sentive Trading, LLC
In this edition of Trading Simplified, Dave explains that right now, we are in the right place at the right time. This episode is a second show on Methodology where Dave further explores money management, stocks in action and trading psychology.
This video was originally broadcast on August 5th, 2020....
READ MORE
MEMBERS ONLY

Waters Corp (WAT) Tests Key Gap Support - Could be a Great Trading Opportunity!
by Tom Bowley,
Chief Market Strategist, EarningsBeats.com
When a stock gaps higher and keeps running, it generally tells me that the top of gap support is what we need to concern ourselves with. It's definitely not a guarantee that it holds, but the odds are greater. When I trade stocks, it's all about...
READ MORE
MEMBERS ONLY

DOLLAR DROP BOOSTS COMMODITIES -- AND STOCKS TIED TO THEM -- GOLD MOVES FURTHER ABOVE $2000 -- COPPER MINERS BREAK OUT -- SO DOES FREEPORT MCMORAN -- A STRONG COPPER MARKET IS A GOOD SIGN FOR THE GLOBAL ECONOMY
by John Murphy,
Chief Technical Analyst, StockCharts.com
COPPER MINERS LEAD MATERIALS HIGHER... A falling dollar has been one of the big factors pushing commodity prices higher and stocks tied to them. Today's drop in the greenback to another two-year low is continuing the flow of money into commodity assets. Several messages over the last...
READ MORE